428 Riverland Rd SE · Roanoke, VA
Flood risk 1/10 · Minimal
- FEMA flood zone
- X (unshaded)
- Chance of flooding over 30 yrs
- 0.0%
- Est. flood insurance / yr
- $473 – $860
Fire risk 3/10 · Minor
- Est. fire insurance / yr
- $666 – $1,236
Heat risk 5/10 · Moderate
- Hot days now (above 101°F)
- 7 days/yr
- Hot days in 30 yrs
- 20 days/yr
Wind risk 2/10 · Minimal
- Chance of severe wind over 30 yrs
- 1.0%
Air-quality risk 2/10 · Minimal
- Unhealthy air days now
- 1 days/yr
- Unhealthy air days in 30 yrs
- 1 days/yr
Risk factors via First Street. Map © Google.
Why this score? — see what drove the D- grade
The composite is a weighted blend of 9 inputs, each scored 0–100. Each bar is that input's sub-score; the figure is the points it added to the 100-point composite (weight × sub-score).
- Cash flow +13.3/30.0
- Rent growth +4.7/5.0
- Schools +4.1/10.0
- DSCR +4.0/10.0
- Livability +3.7/5.0
- 1% rule +3.4/10.0
- Condition / age +2.5/5.0
- ARV discount +0.0/15.0
- Appreciation +0.0/10.0
$175,000
🖨 Deal sheet (PDF) 📄 Offer letter ✓ Due diligence
Listing remarks MLS
ASK YOUR AGENT FOR DETAILS AND SUBMIT ALL OFFERS TO WWW. HUDHOMESTORE. COM. MARKETED BY WWW. HOMETELOSFIRST. COM. EXCLUSIVE AGENCY. MORE PROPERTIES MAY BE FOUND ON WWW. HUDHOMESTORE. COM. GREAT TUDOR WITH CHARM, CHARACTER AND ONE LEVEL LIVING.
Key facts
- Sunny breakfast nook
- Front porch
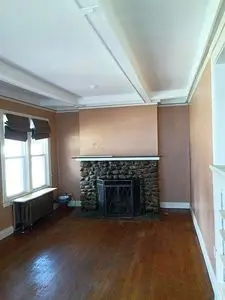
- Cozy fireplace
Tags
Neighborhood map
What this means for you Summary
Snapshot
- This is a 3-bed/1.0-bath single-family listed at $175k.
Deal economics
- At list price, monthly cash flow is $-1 ($-12/yr) — negative.
- To cash-flow at today's rent, offer at most $175k (0.1% below list).
- To meet the 1% rule (rent ≥ 1% of price), the offer needs to be $148k (15.6% below list).
- Recommended offer: $148k (15.6% below list) — sets the bar for 1% rule.
- Cap rate 6.3% vs local median 4.2% in Roanoke — top-decile yield for the area; either an underpriced asset or a hidden risk that comps aren't pricing in. Stress-test before assuming the spread holds.
Location & tenants
- Location reads 73/100 on livability (#163 in VA) — a middle-class / working-renter tenant base. Strengths: cost of living A+, health & safety A+, housing A; Watch: amenities C-, employment D, crime F.
- Roanoke City Public School District (urban): math 40% / reading 58% proficiency, ranked #102 of 131 in VA (top 78%) — families likely to look elsewhere, expect single-tenant / working-renter base with shorter leases; 67% free/reduced lunch — lower-income household profile, screen leases tightly.
- Market conditions: Rents rising fast (+8.8%/yr); 155 active listings in the ZIP; 26 comparable units currently listed for rent nearby; rentals at typical pace (median 22d on market — plan ~3-4 weeks tenant-placement turnaround); 46% of comp listings sitting > 30 days — soft ceiling on asking rent; 113 units permitted in Roanoke city in 2024 (0 in 5+ unit buildings).
Forward outlook
- Local home prices are declining (-3.0%/yr); year-one equity from $1k of loan paydown is wiped out by about $5k of value loss. Plan a longer hold.
- Roanoke County population projected at +11% by 2050 — modest demand growth; plan on rents tracking national, not racing it.
Negotiation context
- Only 1 days on market — expect competitive offers; lowballing is unlikely to land.
- 3 sale attempts since 22y ago with the ask held roughly flat each time — persistent listings suggest the price (not the market) is what's stuck; bring a comps-based counter.
- Current owner paid $71k; list at $175k implies a 145% gain — meaningful room to come down on a strong offer.
Risks & watch-outs
- Watch-outs: built in 1910 — expect roof / HVAC / electrical / plumbing capex.
- Climate carrying-cost: extreme-heat days projected 7→20/yr by 2055 (HVAC capex compounding) — expect insurance premiums to compound above CPI over the hold.
Questions for the listing agent
- What do current leases actually rent for vs. the listed asking? Can we see a recent rent roll and the last 12 months of T-12 income?
- Built in 1910 — when were the roof, HVAC, electrical panel, plumbing, and water heater last replaced?
- Is there a deadline driving the sale (1031 exchange, divorce, estate, relocation)? That informs how much negotiation room exists.
- Schools are A-rated — typically a magnet for longer-tenancy family renters. What's the average tenant stay here, and is there a school-zone premium baked into asking?
- Crime grade is F in this area — have there been break-ins, vandalism, or insurance claims at this property in the last 3 years? What carrier currently insures it and at what premium?
- The area grade is low — what's the realistic commute time and amenity access for the typical tenant pool here? Any planned neighborhood developments (good or bad) we should know about?
- What's the average days-on-market for RENTAL listings here right now (not sales)? A rising rental-DOM trend means longer vacancies and softer asking-rent achievability than the comps imply.
- What's the recent tenant-quality profile in this submarket — average credit score on applications, eviction rate, late-payment / NSF rate, and stable-employment percentage? A property-management company in the area should have these aggregated.
- How much new for-sale + rental construction is in the pipeline within 1–3 miles? Heavy new supply typically softens prices + rents 12–24 months out; constrained supply supports both.
Investment metrics
- 1% rule
- 0.84% ✗
- Cap rate
- 6.29%
- Cash-on-cash
- -0.02%
- DSCR
- 1.00
- GRM
- 9.9
CMA / ARV
- ARV (on-the-fly)
- $126,024
- Comps found
- 12
Show comp detail 12 sales within ~0.75 mi
| Address | Dist | Beds/Ba | Sqft | Sold | Price | $/sf | Match |
|---|---|---|---|---|---|---|---|
| 910 Ivy St SE | 0.20mi | 3/2.0 | 1,418 (+0%) | 2mo | $248,000 | $175 | 84 |
| 645 Albemarle Ave SE | 0.37mi | 3/1.5 | 1,410 (-0%) | 10mo | $125,000 | $89 | 72 |
| 816 Morrill Ave SE | 0.56mi | 3/1.5 | 1,414 (-0%) | 2mo | $45,000 | $32 | 70 |
| 628 Montrose Ave SE | 0.33mi | 2/1.0 (-1) | 1,467 (+4%) | 6mo | $130,000 | $89 | 68 |
| 1626 8th St SE | 0.56mi | 4/1.5 (+1) | 1,476 (+4%) | 9mo | $79,000 | $54 | 52 |
| 728 Jamison Ave SE | 0.75mi | 3/1.5 | 1,348 (-5%) | 10mo | $190,000 | $141 | 47 |
| 518 6th St SE | 0.69mi | 3/1.5 | 1,352 (-4%) | 14mo | $70,000 | $52 | 47 |
| 1015 Pechin Ave SE | 0.61mi | 3/2.0 | 1,549 (+9%) | 8mo | $113,000 | $73 | 45 |
| 1111 Pechin Ave SE | 0.68mi | 3/2.0 | 1,300 (-8%) | 7mo | $218,000 | $168 | 44 |
| 728 Bullitt Ave SE | 0.70mi | 3/2.0 | 1,564 (+10%) | 8mo | $95,000 | $61 | 39 |
| 930 Penmar Ave SE | 0.65mi | 3/2.0 | 1,262 (-11%) | 14mo | $200,000 | $158 | 36 |
| 815 Bullitt Ave SE | 0.72mi | 3/2.0 | 1,613 (+14%) | 15mo | $179,950 | $112 | 27 |
Match score weights: distance 35% · size 25% · config 20% · recency 20%. Top-matched comps best support the ARV.
Projected returns pro-forma
-3.0% appreciation · 8.0% rent growth · sell at horizon
- IRR
- -11.1%
- Equity multiple
- 0.58×
- Total profit
- $-20,616
- Equity at exit
- $26,093
- IRR
- 4.0%
- Equity multiple
- 1.36×
- Total profit
- $17,489
- Equity at exit
- $15,131
Cash invested: $49,000 (down + closing). Projections, not guarantees.
Landlord ↔ Tenant lean methodology
- Overall (STATE)
- 55 Moderately Landlord-Leaning
- State Virginia
- 55 Moderately Landlord-Leaning · D+2
- County
- — inherits STATE
- City
- — inherits STATE
ZIP-level market 24014
- Rents YoY
- 8.8%
- Active inventory
- 155
- Price-to-rent
- 9.9×
Monthly cashflow live
- Estimated rent
- $1,477 high interval (Pro) →
- Mortgage (P&I)
- −$918
- Tax from tax record
- −$177 /mo · $2,129/yr
- Insurance
- −$73
- HOA
- −$0
- Vacancy / Maint / Mgmt
- −$310
- Net cashflow
- $-1
Break-even live
Sensitivity live
| Price | -10% $98 | -5% $49 | +0% $-1 | +5% $-51 | +10% $-100 |
|---|---|---|---|---|---|
| Rent | -10% $-118 | -5% $-59 | +0% $-1 | +5% $57 | +10% $116 |
| Rate | -1.0pp $87 | -0.5pp $44 | base $-1 | +0.5pp $-46 | +1.0pp $-92 |
UW: 25.0% down · 7.5% · 30yr · 1.5% tax · 5.0% vac · 8.0% maint · 8.0% mgmt
Financing live
Cash to close
- Down payment
- $43,750
- Closing costs
- $5,250
- Reserves months
- —
- Total cash needed
- —
Loan-product check · same deal, 3 products live
Conventional
25% down · 7.5% · 30yr
- Down + closing
- —
- Monthly P&I
- —
- Monthly cashflow
- —
- DSCR
- —
- Eligible?
- —
Personal DTI + credit; lowest rate.
DSCR
20% down · 8.5% · 30yr
- Down + closing
- —
- Monthly P&I
- —
- Monthly cashflow
- —
- DSCR
- —
- Eligible?
- —
No personal income docs; deal must DSCR.
Hard money
10% down · 12.0% · 12mo
- Down + closing
- —
- Monthly P&I
- —
- Monthly cashflow
- —
- DSCR
- —
- Eligible?
- —
Short-term bridge; refi at stabilization.
Rent comps 26 comps
| Address | Beds | Baths | Sqft | Rent | $/sqft | DOM | Units | Dist |
|---|---|---|---|---|---|---|---|---|
| 520 Riverland Rd SE Roanoke, VA | 2.0 | 1.0 | 948 | $1,500 | $1.58 | 44d | 1 | 0.16mi |
| 635 Riverland Rd SE Roanoke, VA | 2.0 | 1.0 | 905 | $1,250 | $1.38 | 14d | 1 | 0.26mi |
| 703 Riverland Rd SE Roanoke, VA | 2.0 | 1.0 | 1000 | $1,250 | $1.25 | 44d | 1 | 0.27mi |
| 770 Riverland Rd SE Roanoke, VA | 3.0 | 2.0 | 1200 | $2,100 | $1.75 | 44d | 1 | 0.44mi |
| 730 Murray Ave SE Roanoke, VA | 3.0 | 1.0 | 1163 | $1,525 | $1.31 | 22d | 1 | 0.56mi |
| 730 Murray Ave SE Roanoke, VA | 3.0 | 1.0 | 1163 | $1,525 | $1.31 | 44d | 1 | 0.56mi |
| 1119 Franklin Rd SW Unit BensonFranklin 05 Roanoke, VA | 2.0 | 1.0 | 900 | $1,297 | $1.44 | 44d | 1 | 0.67mi |
| 355 Highland Ave SW Apt 1 Roanoke, VA | 2.0 | 1.0 | 900 | $1,150 | $1.28 | 22d | 1 | 0.76mi |
| 1513 Morningside St SE Roanoke, VA | 2.0 | 1.0 | 900 | $1,200 | $1.33 | 14d | 1 | 0.90mi |
| 430 Day Ave SW Unit A Roanoke, VA | 2.0 | 1.0 | 1444 | $1,650 | $1.14 | 44d | 1 | 0.97mi |
| 1015 12th St SE Roanoke, VA | 3.0 | 1.0 | 1072 | $923 | $0.86 | 44d | 1 | 1.00mi |
| 602 Elm Ave Unit B Roanoke, VA | 2.0 | 1.0 | 1804 | $1,250 | $0.69 | 44d | 1 | 1.09mi |
| 909 13th St SE Roanoke, VA | 3.0 | 1.0 | 1870 | $1,199 | $0.64 | 44d | 1 | 1.11mi |
| 2429 Avenham Ave SW Unit 7 Roanoke, VA | 3.0 | 2.5 | 1536 | $2,000 | $1.30 | 22d | 1 | 1.24mi |
| 1016 15th St SE #2 Roanoke, VA | 3.0 | 1.5 | 1084 | $995 | $0.92 | 14d | 1 | 1.25mi |
| 1816 Bennington St SE Roanoke, VA | 2.0 | 1.5 | 938 | $1,023 | $1.09 | 22d | 1 | 1.27mi |
| 711 Suburban Ave SW Roanoke, VA | 2.0 | 1.5 | 910 | $1,050 | $1.15 | 22d | 1 | 1.27mi |
| 1331 Main St SW Roanoke, VA | 2.0 | 1.0 | 877 | $1,023 | $1.17 | 22d | 1 | 1.33mi |
| 216 Patton Ave NW Unit 2 Roanoke, VA | 2.0 | 1.0 | 1240 | $1,025 | $0.83 | 22d | 1 | 1.34mi |
| 743 Suburban Ave SW Unit Suburban 745 Roanoke, VA | 2.0 | 1.0 | 1134 | $1,100 | $0.97 | 14d | 1 | 1.35mi |
| 1625 Padbury Ave SE Roanoke, VA | 4.0 | 1.0 | 1210 | $1,700 | $1.40 | 14d | 1 | 1.36mi |
| 1817 Dale Ave SE Roanoke, VA | 3.0 | 1.0 | 1820 | $2,100 | $1.15 | 44d | 1 | 1.37mi |
| 701 Salem Ave SW Roanoke, VA | 2.0 | 1.0 | 1250 | $1,950 | $1.56 | 44d | 1 | 1.39mi |
| 1922 Catawba St SE Roanoke, VA | 4.0 | 1.0 | 1629 | $2,000 | $1.23 | 22d | 1 | 1.40mi |
| 333 Harrison Ave NW Roanoke, VA | 3.0 | 2.0 | 1186 | $1,123 | $0.95 | 22d | 1 | 1.48mi |
| 2610 Colonial Ave SW Roanoke, VA | 3.0 | 1.0 | 1104 | $1,500 | $1.36 | 44d | 1 | 1.49mi |
Listing history 9 events
-
2026-05-26$175,000 Active
-
2013-08-14soldstatus $71,358 243-char remark
Show marketing remark (243 chars)
ASK YOUR AGENT FOR DETAILS AND SUBMIT ALL OFFERS TO WWW. HUDHOMESTORE. COM. MARKETED BY WWW. HOMETELOSFIRST. COM. EXCLUSIVE AGENCY. MORE PROPERTIES MAY BE FOUND ON WWW. HUDHOMESTORE. COM. GREAT TUDOR WITH CHARM, CHARACTER AND ONE LEVEL LIVING.
-
2013-07-09$28,000 243-char remark
Show marketing remark (243 chars)
ASK YOUR AGENT FOR DETAILS AND SUBMIT ALL OFFERS TO WWW. HUDHOMESTORE. COM. MARKETED BY WWW. HOMETELOSFIRST. COM. EXCLUSIVE AGENCY. MORE PROPERTIES MAY BE FOUND ON WWW. HUDHOMESTORE. COM. GREAT TUDOR WITH CHARM, CHARACTER AND ONE LEVEL LIVING.
-
2004-05-21soldstatus $85,350 164-char remark
Show marketing remark (164 chars)
CHARMING & WELL MAINTAINED HOME. LARGE FAMILY RM W/ FP-GAS LOGS. COZY BREAKFAST NOOK, BUILT IN BOOKCASES. AFFORDABLE & ADORABLE. W/ D TO PASS ''AS IS''.
-
2004-05-18soldstatus $85,350
-
2004-05-18soldstatus $85,350
-
2004-04-04$82,500 164-char remark
Show marketing remark (164 chars)
CHARMING & WELL MAINTAINED HOME. LARGE FAMILY RM W/ FP-GAS LOGS. COZY BREAKFAST NOOK, BUILT IN BOOKCASES. AFFORDABLE & ADORABLE. W/ D TO PASS ''AS IS''.
-
1988-03-15soldstatus $25,000
-
1982-09-24soldstatus $25,000
ⓘ Source: listings_history table (triggers on properties + properties_extension) + one-shot
backfill from property_details.listing_events for pre-trigger history.
Tax reassessment forecast VA · Resets to sale price
- Current annual tax
- $2,129 · $177/mo
- Projected year-2 tax
- $2,129 · $177/mo
- Expected delta
- $0/yr ($0/mo · 0.0%)
ⓘ Screening estimate from a state-policy table — verify with the county assessor before closing.
Climate risk First Street
- Flood 1/10 Low FEMA zone X (unshaded) · 0% chance over 30 yrs
- Wildfire 3/10 Moderate
- Heat 5/10 Major 7 d/yr ≥101°F today · 20 d/yr by 30 yrs out
- Wind 2/10 Low 100% chance of damaging wind over 30 yrs
- Air quality 2/10 Low 1 unhealthy d/yr today · 1 by 30 yrs out
Nearby sold comps map
Loading sold comps map…
Walkable amenities ~0.75 mi
Loading nearby amenities…
Taxation est. · year 1
- Rental income
- $17,728
- − Mortgage interest
- −$9,803
- − Property taxes
- −$2,129
- − Insurance
- −$875
- − Repairs & maintenance
- −$1,418
- − Management
- −$1,418
- − Depreciation
- −$5,091
- Taxable loss
- −$3,006
- Est. tax savings @ 24.0%
- +$722
- After-tax cash flow
- $710/yr
For passive investors: Depreciation is non-cash, so a rental often shows a tax loss while cash-flowing — sheltering income. Rental losses are passive: they offset passive income freely, and up to $25,000/yr can offset ordinary (W-2) income if you actively participate and your MAGI is under $100k (phasing out to $0 by $150k); unused losses carry forward. On sale, claimed depreciation is recaptured at up to 25%, and gains may owe capital-gains tax (a 1031 exchange can defer both). Figures are a year-1 estimate at your 24.0% rate — not tax advice; consult a CPA.
Schools (NCES district)
- District
- Roanoke City Public School District
- NCES district ID
- 5103300
- Math proficiency
- 40% ▼ -38.00%
- Reading proficiency
- 58% ▼ -12.00%
- Median HH income
- $38,592
- Composite
- 40.8/100
- National rank
- #3639
- State rank
- #102 of 131 in VA
Livability — Roanoke
- Score
- 73/100
- State rank
- #163
- US rank
- #5055
Category grades
Schools grade is shown separately in the Schools card above.
Census & demographics
- Census place
- Roanoke, VA
- County
- Roanoke City · 101,625 people
- City population
- 168,930
- Metro
- Roanoke, VA
- Population (ZIP)
- 15,300
- Household income
- $70,381
- Rent vs Own
- Severe rent burden
- 209.0
Population outlook (Roanoke County) Hauer SSP2
- Today (2025)
- 106,094 people
- By 2030
- 108,927 · +2.7%
- By 2040
- 114,104 · +7.5%
- By 2050
- 118,032 · +11.3%
- By 2075
- 123,363 · +16.3%
- By 2100
- 116,827 · +10.1%
Race, ethnicity, and origin ACS 2023
- Neighborhood character
- Predominantly White (85%)
- Race & ethnicity
- White 85% Two or more races 7% Black 5% Hispanic / Latino 5% Asian 1%
- Common ancestry
- Serbian 3% Slovak 2% Italian 2%
- Foreign-born
- 2% · Canada
- Languages at home
- 94% English-only · Spanish 3% Other Indo-European 1% French/Haitian/Cajun 1%
Political lean MEDSL · Roanoke
- 2024 margin
- Strong D (+23.6) · D 61.1% · R 37.5% · Other 1.4%
- 2008→2024 swing
- +0.2pp no change · 2008: 23.4pp · 2024: 23.6pp
- All cycles
- 2024: D+23.6 2020: D+25.8 2016: D+17.6 2012: D+21.5 2008: D+23.4
Not yet ingested
- Civics
- —
Market trends
- HPI YoY
- ▼ -344.06%
- Current HPI
- 173.6728
- Rent YoY
- ▲ 8.80%
- Metro
- Roanoke, VA
- State GDP YoY
- ▲ 2.40%
- F500 in state
- 50
Industry mix (Fortune 500 HQ in VA)
| Industry | F500 HQs | Revenue |
|---|---|---|
| Aerospace / Defense | 4 | $236B |
|
||
| Technology / Defense | 3 | $32B |
|
||
| Financial Services | 2 | $176B |
|
||
| Utilities | 2 | $27B |
|
||
| Insurance | 2 | $25B |
|
||
| Technology | 2 | $15B |
|
||
Price history
+600.0% since first listed9 events — show timeline
- 2026-05-26 Listed $175,000 FSBO.com
- 2013-08-14 Sold (MLS) $71,358 MLSRV
- 2013-07-09 Listed $28,000 MLSRV
- 2004-05-21 Sold (MLS) $85,350 MLSRV
- 2004-05-18 Sold (Public Records) $85,350 Public Records
- 2004-05-18 Sold (Public Records) $85,350 Public Records
- 2004-04-04 Listed $82,500 MLSRV
- 1988-03-15 Sold (Public Records) $25,000 Public Records
- 1982-09-24 Sold (Public Records) $25,000 Public Records
Property tax history
+7.2%/yrLatest (2025): $2,129 · +5.2% YoY. Source: county tax records.
Cash-flow waterfall
monthlySold comps — $/sqft
last 12 mo · ≤1 miLoading sold comps…