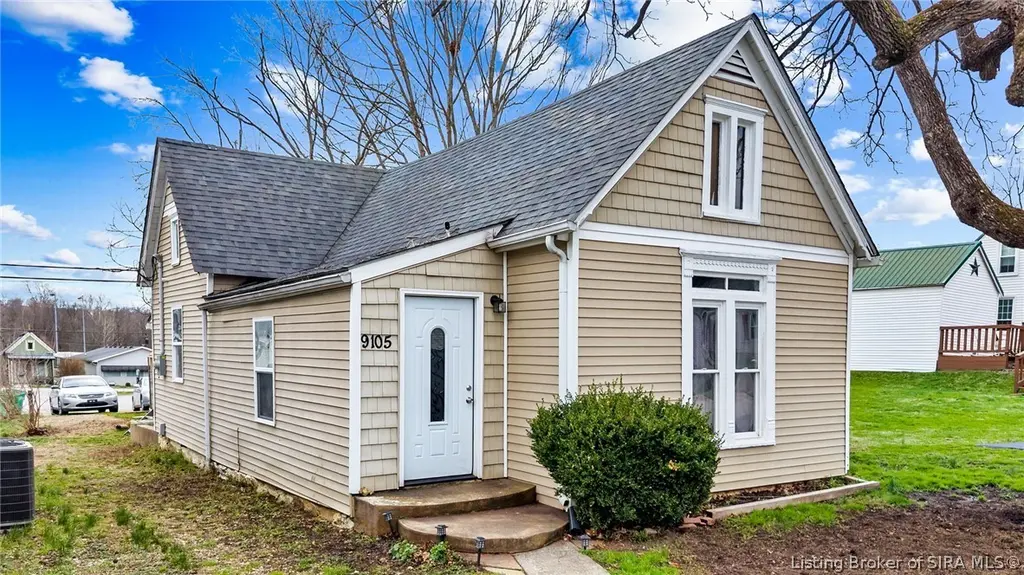
9105 High St · Georgetown, IN
Flood risk 8/10 · Major
- FEMA flood zone
- X (unshaded)
- Chance of flooding over 30 yrs
- 0.99%
- Est. flood insurance / yr
- $473 – $860
Fire risk 3/10 · Minor
- Est. fire insurance / yr
- $717 – $1,331
Heat risk 5/10 · Moderate
- Hot days now (above 103°F)
- 7 days/yr
- Hot days in 30 yrs
- 21 days/yr
Wind risk 2/10 · Minimal
- Chance of severe wind over 30 yrs
- 2.0%
Air-quality risk 2/10 · Minimal
- Unhealthy air days now
- 1 days/yr
- Unhealthy air days in 30 yrs
- 2 days/yr
Risk factors via First Street. Map © Google.
Why this score? — see what drove the C+ grade
The composite is a weighted blend of 9 inputs, each scored 0–100. Each bar is that input's sub-score; the figure is the points it added to the 100-point composite (weight × sub-score).
- Cash flow +21.5/30.0
- ARV discount +15.0/15.0
- DSCR +6.9/10.0
- 1% rule +4.4/10.0
- Schools +4.2/10.0
- Livability +3.6/5.0
- Rent growth +2.5/5.0
- Condition / age +2.5/5.0
- Appreciation +0.0/10.0
$149,000
🖨 Deal sheet (PDF) 📄 Offer letter ✓ Due diligence
Listing remarks MLS
Adorable 3 bedroom, 1 bath home in downtown Georgetown with off-street parking. This home was completely remodeled 8 years ago down to the studs. Neutral colors, granite countertops and a large laundry/mud room makes this home perfect for anyone. This is a one time list & sell. Listing will be added to the MLS at closing. Seller is a licensed real estate agent.
Key facts
- 3,484 sq ft lot
- Built 1929
- Listed 8 days
Property features AI
Exterior
- Parking: Off-street parking
- Utilities: Public water (connected); Public sewer; Central air conditioning; Forced air heating
- Home design: Single-story home; Resale property
- Construction: Metal siding; Shingle roof; Crawlspace and stone foundation; Built area above grade: 871
- Exterior features: Deck; Porch; Shed(s); Paved road access; Residential zoning
Interior
- Kitchen: Dishwasher; Oven; Range; Refrigerator
- Bedrooms: Main level primary bedroom
- Bathrooms: 1 full bathroom
- Interior features: Ceiling fans; Mud room; Utility room; Window treatments; Blinds; Window screens; Main level primary bedroom
- Laundry & utility: Main level laundry room
Neighborhood map
What this means for you Summary
Snapshot
- This is a 3-bed/1.0-bath single-family listed at $149k.
Deal economics
- At list price, monthly cash flow is $169 ($2k/yr) — positive.
- The deal already cash-flows at list — no discount required.
- To meet the 1% rule (rent ≥ 1% of price), the offer needs to be $139k (6.4% below list).
- Recommended offer: $139k (6.4% below list) — sets the bar for 1% rule.
- Cap rate 8.1% vs local median 2.2% in Georgetown — top-decile yield for the area; either an underpriced asset or a hidden risk that comps aren't pricing in. Stress-test before assuming the spread holds.
Location & tenants
- Location reads 72/100 on livability (#117 in IN) — a middle-class / working-renter tenant base. Strengths: crime A+, employment A+, cost of living A+; Watch: amenities F, commute F, health & safety F.
- New Albany-Floyd County Consolidated Schools (suburban): math 46% / reading 50% proficiency, ranked #68 of 301 in IN (top 23%) — families likely to look elsewhere, expect single-tenant / working-renter base with shorter leases.
- Zoned schools: Georgetown Elementary School (math 67% / reading 52%, grade B-, #128 of 994 statewide, top 15%, 683 students, 28% FRL); Highland Hills Middle School (math 53% / reading 57%, grade B-, #26 of 330 statewide, top 8%, 1,652 students, 19% FRL); Floyd Central High School (math 50% / reading 80%, grade B, #31 of 369 statewide, top 9%, 1,873 students, 19% FRL) — zoned schools average 22% FRL vs 38% district-wide (16 pts lower); this property's tenant base skews higher-income than the district average.
- Market conditions: 114 active listings in the ZIP; 297 units permitted in Floyd County in 2024 (84 in 5+ unit buildings).
Forward outlook
- Local home prices are declining (-3.0%/yr); year-one equity from $1k of loan paydown is wiped out by about $4k of value loss. Plan a longer hold.
- Floyd County population projected at +10% by 2050 — modest demand growth; plan on rents tracking national, not racing it.
Negotiation context
- Only 8 days on market — expect competitive offers; lowballing is unlikely to land.
- 4 sale attempts since 22y ago with the ask held roughly flat each time — persistent listings suggest the price (not the market) is what's stuck; bring a comps-based counter.
- Current owner paid $116k; 29% above their basis — modest negotiation headroom, anchor on the comps not their cost.
Risks & watch-outs
- Watch-outs: flood insurance adds $56/mo; built in 1929 — expect roof / HVAC / electrical / plumbing capex.
- Climate carrying-cost: severe flood risk; extreme-heat days projected 7→21/yr by 2055 (HVAC capex compounding) — expect insurance premiums to compound above CPI over the hold.
Questions for the listing agent
- Built in 1929 — when were the roof, HVAC, electrical panel, plumbing, and water heater last replaced?
- What's the actual annual flood-insurance premium (NFIP or private), and is the property in a SFHA with mandatory coverage?
- Is there a deadline driving the sale (1031 exchange, divorce, estate, relocation)? That informs how much negotiation room exists.
- Schools are B-rated — typically a magnet for longer-tenancy family renters. What's the average tenant stay here, and is there a school-zone premium baked into asking?
- What's the average days-on-market for RENTAL listings here right now (not sales)? A rising rental-DOM trend means longer vacancies and softer asking-rent achievability than the comps imply.
- What's the recent tenant-quality profile in this submarket — average credit score on applications, eviction rate, late-payment / NSF rate, and stable-employment percentage? A property-management company in the area should have these aggregated.
- How much new for-sale + rental construction is in the pipeline within 1–3 miles? Heavy new supply typically softens prices + rents 12–24 months out; constrained supply supports both.
Investment metrics
- 1% rule
- 0.94% ✗
- Cap rate
- 8.10%
- Cash-on-cash
- 6.47%
- DSCR
- 1.29
- GRM
- 8.9
CMA / ARV
- ARV (on-the-fly)
- $185,523
- Comps found
- 4
Show comp detail 4 sales within ~0.75 mi
| Address | Dist | Beds/Ba | Sqft | Sold | Price | $/sf | Match |
|---|---|---|---|---|---|---|---|
| 8970 High St | 0.14mi | 3/1.0 | 864 (-1%) | 10mo | $199,000 | $230 | 83 |
| 8935 High St | 0.16mi | 2/1.0 (-1) | 840 (-4%) | 12mo | $178,500 | $213 | 71 |
| 9255 State Road 64 | 0.16mi | 2/1.0 (-1) | 836 (-4%) | 17mo | $88,000 | $105 | 67 |
| 8825 High St | 0.27mi | 2/1.0 (-1) | 768 (-12%) | 21mo | $149,900 | $195 | 46 |
Match score weights: distance 35% · size 25% · config 20% · recency 20%. Top-matched comps best support the ARV.
Projected returns pro-forma
-3.0% appreciation · 3.0% rent growth · sell at horizon
- IRR
- -8.8%
- Equity multiple
- 0.68×
- Total profit
- $-13,399
- Equity at exit
- $22,216
- IRR
- 0.7%
- Equity multiple
- 1.05×
- Total profit
- $2,062
- Equity at exit
- $12,883
Cash invested: $41,720 (down + closing). Projections, not guarantees.
Landlord ↔ Tenant lean methodology
- Overall (STATE)
- 90 Strongly Landlord-Friendly
- State Indiana
- 90 Strongly Landlord-Friendly · R+11
- County
- — inherits STATE
- City
- — inherits STATE
ZIP-level market 47122
- Home prices YoY
- -34.0%
- Active inventory
- 114
- Price-to-rent
- 8.9×
Monthly cashflow live
- Estimated rent
- $1,395 medium interval (Pro) →
- Mortgage (P&I)
- −$781
- Tax from tax record
- −$33 /mo · $401/yr
- Insurance
- −$62
- Flood insurance flood zone
- −$56 /mo · $666/yr
- HOA
- −$0
- Vacancy / Maint / Mgmt
- −$293
- Net cashflow
- $169
Break-even live
Sensitivity live
| Price | -10% $254 | -5% $211 | +0% $169 | +5% $127 | +10% $85 |
|---|---|---|---|---|---|
| Rent | -10% $59 | -5% $114 | +0% $169 | +5% $224 | +10% $279 |
| Rate | -1.0pp $244 | -0.5pp $207 | base $169 | +0.5pp $131 | +1.0pp $91 |
UW: 25.0% down · 7.5% · 30yr · 1.5% tax · 5.0% vac · 8.0% maint · 8.0% mgmt
Financing live
Cash to close
- Down payment
- $37,250
- Closing costs
- $4,470
- Reserves months
- —
- Total cash needed
- —
Loan-product check · same deal, 3 products live
Conventional
25% down · 7.5% · 30yr
- Down + closing
- —
- Monthly P&I
- —
- Monthly cashflow
- —
- DSCR
- —
- Eligible?
- —
Personal DTI + credit; lowest rate.
DSCR
20% down · 8.5% · 30yr
- Down + closing
- —
- Monthly P&I
- —
- Monthly cashflow
- —
- DSCR
- —
- Eligible?
- —
No personal income docs; deal must DSCR.
Hard money
10% down · 12.0% · 12mo
- Down + closing
- —
- Monthly P&I
- —
- Monthly cashflow
- —
- DSCR
- —
- Eligible?
- —
Short-term bridge; refi at stabilization.
Listing history 17 events
-
2026-06-21days on market $149,000 Active 8 DOM
-
2026-06-18days on market $149,000 Active 5 DOM
-
2026-06-17days on market $149,000 Active 4 DOM
-
2026-06-16days on market $149,000 Active 3 DOM
-
2026-06-15days on market $149,000 Active 2 DOM
-
2026-06-13days on market $149,000 Active 1 DOM
-
2026-06-01days on market $149,000 Active 10 DOM
-
2026-05-31days on market $149,000 Active 9 DOM
-
2026-05-22$149,000 Active
-
2026-04-23price $157,000
-
2022-06-17soldstatus $115,500 Closed 369-char remark
Show marketing remark (369 chars)
Adorable 3 bedroom, 1 bath home in downtown Georgetown with off-street parking. This home was completely remodeled 8 years ago down to the studs. Neutral colors, granite countertops and a large laundry/mud room makes this home perfect for anyone. This is a one time list & sell. Listing will be added to the MLS at closing. Seller is a licensed real estate agent.
-
2022-06-17$115,500 369-char remark
Show marketing remark (369 chars)
Adorable 3 bedroom, 1 bath home in downtown Georgetown with off-street parking. This home was completely remodeled 8 years ago down to the studs. Neutral colors, granite countertops and a large laundry/mud room makes this home perfect for anyone. This is a one time list & sell. Listing will be added to the MLS at closing. Seller is a licensed real estate agent.
-
2022-06-17historical 369-char remark
Show marketing remark (369 chars)
Adorable 3 bedroom, 1 bath home in downtown Georgetown with off-street parking. This home was completely remodeled 8 years ago down to the studs. Neutral colors, granite countertops and a large laundry/mud room makes this home perfect for anyone. This is a one time list & sell. Listing will be added to the MLS at closing. Seller is a licensed real estate agent.
-
2017-06-01soldstatus $29,600
-
2017-05-12$27,000
-
2005-01-28historical
-
2004-12-10$19,900
ⓘ Source: listings_history table (triggers on properties + properties_extension) + one-shot
backfill from property_details.listing_events for pre-trigger history.
Tax reassessment forecast IN · Partial reset (capped growth)
- Current annual tax
- $401 · $33/mo
- Projected year-2 tax
- $834 · $69/mo
- Expected delta
- +$433/yr (+$36/mo · 107.8%)
ⓘ Screening estimate from a state-policy table — verify with the county assessor before closing.
Climate risk First Street
- Flood 8/10 Severe FEMA zone X (unshaded) · 99% chance over 30 yrs
- Wildfire 3/10 Moderate
- Heat 5/10 Major 7 d/yr ≥103°F today · 21 d/yr by 30 yrs out
- Wind 2/10 Low 2% chance of damaging wind over 30 yrs
- Air quality 2/10 Low 1 unhealthy d/yr today · 2 by 30 yrs out
Nearby sold comps map
Loading sold comps map…
Walkable amenities ~0.75 mi
Loading nearby amenities…
Taxation est. · year 1
- Rental income
- $16,736
- − Mortgage interest
- −$8,346
- − Property taxes
- −$401
- − Insurance
- −$1,412
- − Repairs & maintenance
- −$1,339
- − Management
- −$1,339
- − Depreciation
- −$4,335
- Taxable loss
- −$436
- Est. tax savings @ 24.0%
- +$105
- After-tax cash flow
- $2,136/yr
For passive investors: Depreciation is non-cash, so a rental often shows a tax loss while cash-flowing — sheltering income. Rental losses are passive: they offset passive income freely, and up to $25,000/yr can offset ordinary (W-2) income if you actively participate and your MAGI is under $100k (phasing out to $0 by $150k); unused losses carry forward. On sale, claimed depreciation is recaptured at up to 25%, and gains may owe capital-gains tax (a 1031 exchange can defer both). Figures are a year-1 estimate at your 24.0% rate — not tax advice; consult a CPA.
Schools (NCES district)
- District
- New Albany-Floyd County Consolidated Schools
- NCES district ID
- 1807410
- Math proficiency
- 46% ▼ -4.00%
- Reading proficiency
- 50% ▼ -3.00%
- Median HH income
- $54,709
- Composite
- 41.57/100
- National rank
- #3441
- State rank
- #68 of 301 in IN
Livability — Georgetown
- Score
- 72/100
- State rank
- #117
- US rank
- #6329
Category grades
Schools grade is shown separately in the Schools card above.
Census & demographics
- Census place
- Georgetown, IN
- Population (ZIP)
- 11,230
Population outlook (Floyd County) Hauer SSP2
- Today (2025)
- 82,092 people
- By 2030
- 84,384 · +2.8%
- By 2040
- 87,919 · +7.1%
- By 2050
- 89,958 · +9.6%
- By 2075
- 94,159 · +14.7%
- By 2100
- 91,907 · +12.0%
Race, ethnicity, and origin ACS 2023
- Neighborhood character
- Predominantly White (95%)
- Race & ethnicity
- White 95% Two or more races 3% Hispanic / Latino 2%
- Common ancestry
- Italian 2% Slovak 2% Lithuanian 2%
- Foreign-born
- 0%
- Languages at home
- 99% English-only · Spanish 1%
Political lean MEDSL · Floyd
- 2024 margin
- R (+15.5) · D 41.4% · R 56.9% · Other 1.7%
- 2008→2024 swing
- -5.4pp toward R · 2008: -10.1pp · 2024: -15.5pp
- All cycles
- 2024: R+15.5 2020: R+14.1 2016: R+20.1 2012: R+14.3 2008: R+10.1
Not yet ingested
- Civics
- —
Market trends
- HPI YoY
- ▼ -101.62%
- Current HPI
- 197.107
- Rent YoY
- —
- Metro
- —
- State GDP YoY
- ▲ 2.90%
- F500 in state
- 18
Industry mix (Fortune 500 HQ in IN)
| Industry | F500 HQs | Revenue |
|---|---|---|
| Industrial Machinery | 2 | $37B |
|
||
| Healthcare | 1 | $177B |
|
||
| Pharmaceuticals | 1 | $45B |
|
||
| Metals / Steel | 1 | $18B |
|
||
| Agriculture | 1 | $17B |
|
||
| Packaging | 1 | $12B |
|
||
Price history
+648.7% since first listed9 events — show timeline
- 2026-05-22 Listed $149,000 SIRA
- 2026-04-23 Price Changed $157,000 SIRA
- 2022-06-17 Delisted — SIRA
- 2022-06-17 Listed $115,500 SIRA
- 2022-06-17 Sold (MLS) $115,500 SIRA
- 2017-06-01 Sold (MLS) $29,600 SIRA
- 2017-05-12 Listed $27,000 SIRA
- 2005-01-28 Listing Removed — MIBOR as Distributed by MLS Grid
- 2004-12-10 Listed $19,900 MIBOR as Distributed by MLS Grid
Property tax history
-2.8%/yrLatest (2024): $401 · -11.5% YoY. Source: county tax records.
Cash-flow waterfall
monthlySold comps — $/sqft
last 12 mo · ≤1 miLoading sold comps…