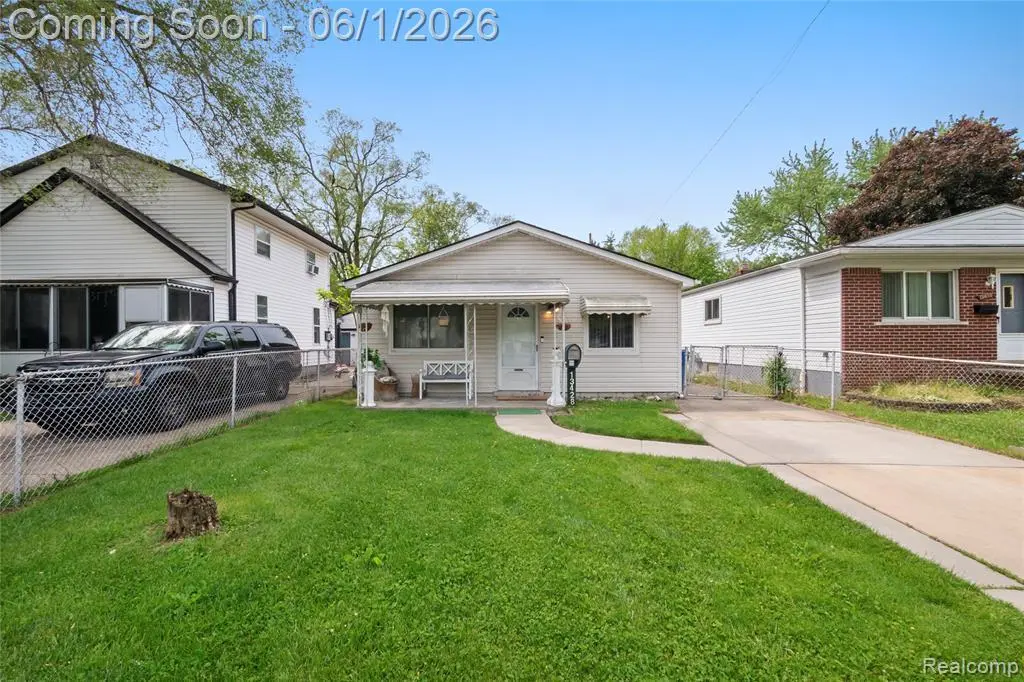
13428 Sarsfield Ave · Warren, MI
Flood risk 1/10 · Minimal
- FEMA flood zone
- X (unshaded)
- Chance of flooding over 30 yrs
- 0.0%
- Est. flood insurance / yr
- $507 – $1,088
Fire risk 1/10 · Minimal
- Est. fire insurance / yr
- $784 – $1,456
Heat risk 3/10 · Minor
- Hot days now (above 96°F)
- 7 days/yr
- Hot days in 30 yrs
- 15 days/yr
Wind risk 1/10 · Minimal
- Chance of severe wind over 30 yrs
- —
Air-quality risk 3/10 · Minor
- Unhealthy air days now
- 3 days/yr
- Unhealthy air days in 30 yrs
- 4 days/yr
Risk factors via First Street. Map © Google.
Why this score? — see what drove the C- grade
The composite is a weighted blend of 9 inputs, each scored 0–100. Each bar is that input's sub-score; the figure is the points it added to the 100-point composite (weight × sub-score).
- Cash flow +23.5/30.0
- DSCR +7.6/10.0
- ARV discount +7.5/15.0
- 1% rule +5.5/10.0
- Livability +3.7/5.0
- Rent growth +3.2/5.0
- Condition / age +2.5/5.0
- Schools +1.0/10.0
- Appreciation +0.0/10.0
$129,900
🖨 Deal sheet (PDF) 📄 Offer letter ✓ Due diligence
Listing remarks MLS
Completely renovated 3 bedroom ranch in Warren for sale! This home has NEW flooring and FRESH paint throughout. Brand NEW kitchen with NEW cabinets and granite counter tops, stainless steel stove, microwave, fridge, and dishwasher. Laundry room off the kitchen. Spacious fenced in backyard with shed for plenty of room for storage. Nice covered porch. Brand new forced air heating system. This home is MOVE IN READY! Perfect home to start a family in. Information deemed reliable but not guaranteed. Room sizes are estimated. Owner occupant only for the first 30 days.
Key facts
- 3,920 sq ft lot
- Built 1963
- Listed 14 days
Property features AI
Exterior
- Utilities: Public water; Natural gas; Forced air heating
- Home design: Single-story residential home; Built in 1963; Entry-level living
- Construction: Vinyl siding construction; Slab foundation; Built in 1963
- Exterior features: Vinyl siding; Paved street access; Frontage approximately 35 feet
Interior
- Kitchen: Kitchen at entry level, approximately 10 x 10; Includes Dishwasher, Microwave, Range/Oven, Refrigerator
- Bedrooms: Bedroom 1 (Entry): 11 x 11; Bedroom 2 (Entry): 10 x 10; Bedroom 3 (Entry): 10 (approx.)
- Bathrooms: 1 full bathroom (Entry level)
- Heating & cooling: Forced air heating; Natural gas heat
- Interior features: 7 total rooms; Dishwasher, Microwave, Range/Oven, Refrigerator
- Laundry & utility: Laundry room at entry level, approximately 9 x 9
Neighborhood map
What this means for you Summary
Snapshot
- This is a 3-bed/1.0-bath single-family listed at $130k.
Deal economics
- At list price, monthly cash flow is $242 ($3k/yr) — positive.
- The deal already cash-flows at list — no discount required.
- Meets the 1% rule at list price ($1k rent vs $130k).
- Cap rate 8.5% vs local median 5.2% in Warren — top-decile yield for the area; either an underpriced asset or a hidden risk that comps aren't pricing in. Stress-test before assuming the spread holds.
Location & tenants
- Location reads 74/100 on livability (#171 in MI, #4,491 nationally) — a middle-class / working-renter tenant base. Strengths: commute A+, cost of living A+, housing A+; Watch: schools D, amenities D, employment D.
- Van Dyke Public Schools (urban): math 7% / reading 19% proficiency, ranked #512 of 540 in MI (top 95%) — low school quality limits family demand, transient renter base, plan for 1-2y turnover; 80% free/reduced lunch — lower-income household profile, screen leases tightly.
- Market conditions: Rents rising (+2.9%/yr); 168 active listings in the ZIP; 32 comparable units currently listed for rent nearby; rentals at typical pace (median 19d on market — plan ~3-4 weeks tenant-placement turnaround); 1,321 units permitted in Macomb County in 2024 (86 in 5+ unit buildings).
- This rent runs 31% of the median local income ($52k/yr) — at the standard rent-burdened threshold; future hikes will face affordability resistance.
Forward outlook
- Local home prices are declining (-3.0%/yr); year-one equity from $898 of loan paydown is wiped out by about $4k of value loss. Plan a longer hold.
- Macomb County population projected at +9% by 2050 — modest demand growth; plan on rents tracking national, not racing it.
Negotiation context
- Only 14 days on market — expect competitive offers; lowballing is unlikely to land.
- 3 sale attempts since 30y ago; this cycle's ask is 117% above the opening price — seller raised mid-cycle; expect resistance to lowballs.
- Current owner paid $62k; list at $130k implies a 110% gain — meaningful room to come down on a strong offer.
Questions for the listing agent
- Built in 1963 — when were the roof, HVAC, electrical panel, plumbing, and water heater last replaced?
- Is there a deadline driving the sale (1031 exchange, divorce, estate, relocation)? That informs how much negotiation room exists.
- Schools are D-rated, which usually means shorter tenancies and higher turnover. Who's the typical renter profile here, and what's been the actual vacancy rate?
- Crime grade is D in this area — have there been break-ins, vandalism, or insurance claims at this property in the last 3 years? What carrier currently insures it and at what premium?
- What's the average days-on-market for RENTAL listings here right now (not sales)? A rising rental-DOM trend means longer vacancies and softer asking-rent achievability than the comps imply.
- What's the recent tenant-quality profile in this submarket — average credit score on applications, eviction rate, late-payment / NSF rate, and stable-employment percentage? A property-management company in the area should have these aggregated.
- How much new for-sale + rental construction is in the pipeline within 1–3 miles? Heavy new supply typically softens prices + rents 12–24 months out; constrained supply supports both.
Investment metrics
- 1% rule
- 1.05% ✓
- Cap rate
- 8.53%
- Cash-on-cash
- 7.98%
- DSCR
- 1.36
- GRM
- 7.9
CMA / ARV
- ARV (on-the-fly)
- $57,584
- Comps found
- 12
Show comp detail 12 sales within ~0.75 mi
| Address | Dist | Beds/Ba | Sqft | Sold | Price | $/sf | Match |
|---|---|---|---|---|---|---|---|
| 20300 Hickory St | 0.36mi | 3/1.0 | 918 (-3%) | 1mo | $31,000 | $34 | 78 |
| 20218 Hickory St | 0.43mi | 3/1.0 | 930 (-2%) | 1mo | $26,000 | $28 | 76 |
| 12416 Vernon Ave | 0.50mi | 3/1.0 | 944 (0%) | 2mo | $128,000 | $136 | 75 |
| 12753 Georgiana Ave | 0.35mi | 3/1.0 | 888 (-6%) | 2mo | $120,000 | $135 | 72 |
| 13046 Sherman Ave | 0.19mi | 4/1.0 (+1) | 870 (-8%) | 1mo | $120,000 | $138 | 72 |
| 20218 Goulburn St | 0.54mi | 3/1.0 | 965 (+2%) | 1mo | $12,000 | $12 | 70 |
| 20543 Waltham St | 0.51mi | 3/1.0 | 890 (-6%) | 1mo | $50,000 | $56 | 66 |
| 20541 Barlow St | 0.55mi | 2/1.0 (-1) | 980 (+4%) | 2mo | $60,000 | $61 | 61 |
| 14068 Carlisle St | 0.54mi | 3/1.0 | 1,020 (+8%) | 2mo | $55,000 | $54 | 60 |
| 20577 Fairport St | 0.34mi | 3/1.0 | 1,078 (+14%) | 1mo | $65,000 | $60 | 60 |
| 20020 Pelkey St | 0.56mi | 3/1.0 | 1,020 (+8%) | 2mo | $75,000 | $74 | 59 |
| 13505 Saint Andrews Ave | 0.49mi | 2/1.5 (-1) | 888 (-6%) | 2mo | $86,000 | $97 | 58 |
Match score weights: distance 35% · size 25% · config 20% · recency 20%. Top-matched comps best support the ARV.
Projected returns pro-forma
-3.0% appreciation · 2.94% rent growth · sell at horizon
- IRR
- -4.2%
- Equity multiple
- 0.84×
- Total profit
- $-5,735
- Equity at exit
- $19,369
- IRR
- 5.4%
- Equity multiple
- 1.40×
- Total profit
- $14,450
- Equity at exit
- $11,231
Cash invested: $36,372 (down + closing). Projections, not guarantees.
Landlord ↔ Tenant lean methodology
- Overall (STATE)
- 62 Landlord-Friendly
- State Michigan
- 62 Landlord-Friendly · EVEN
- County
- — inherits STATE
- City
- — inherits STATE
ZIP-level market 48089
- Rents YoY
- 2.9%
- Active inventory
- 168
- Price-to-rent
- 7.9×
Monthly cashflow live
- Estimated rent
- $1,368 high interval (Pro) →
- Mortgage (P&I)
- −$681
- Tax from tax record
- −$103 /mo · $1,241/yr
- Insurance
- −$54
- HOA
- −$0
- Vacancy / Maint / Mgmt
- −$287
- Net cashflow
- $242
Break-even live
Sensitivity live
| Price | -10% $316 | -5% $279 | +0% $242 | +5% $205 | +10% $168 |
|---|---|---|---|---|---|
| Rent | -10% $134 | -5% $188 | +0% $242 | +5% $296 | +10% $350 |
| Rate | -1.0pp $307 | -0.5pp $275 | base $242 | +0.5pp $208 | +1.0pp $174 |
UW: 25.0% down · 7.5% · 30yr · 1.5% tax · 5.0% vac · 8.0% maint · 8.0% mgmt
Financing live
Cash to close
- Down payment
- $32,475
- Closing costs
- $3,897
- Reserves months
- —
- Total cash needed
- —
Loan-product check · same deal, 3 products live
Conventional
25% down · 7.5% · 30yr
- Down + closing
- —
- Monthly P&I
- —
- Monthly cashflow
- —
- DSCR
- —
- Eligible?
- —
Personal DTI + credit; lowest rate.
DSCR
20% down · 8.5% · 30yr
- Down + closing
- —
- Monthly P&I
- —
- Monthly cashflow
- —
- DSCR
- —
- Eligible?
- —
No personal income docs; deal must DSCR.
Hard money
10% down · 12.0% · 12mo
- Down + closing
- —
- Monthly P&I
- —
- Monthly cashflow
- —
- DSCR
- —
- Eligible?
- —
Short-term bridge; refi at stabilization.
Rent comps 32 comps
| Address | Beds | Baths | Sqft | Rent | $/sqft | DOM | Units | Dist |
|---|---|---|---|---|---|---|---|---|
| 13501 Vernon Ave Warren, MI | 2.0 | 1.0 | 850 | $1,300 | $1.53 | 25d | 1 | 0.07mi |
| 12846 Georgiana Ave Warren, MI | 3.0 | 1.0 | 912 | $1,300 | $1.43 | 25d | 1 | 0.25mi |
| 13050 Couwlier Ave Warren, MI | 3.0 | 1.0 | 850 | $1,350 | $1.59 | 25d | 1 | 0.29mi |
| 12807 Coleen Ave Warren, MI | 3.0 | 1.0 | 1080 | $1,250 | $1.16 | 25d | 1 | 0.30mi |
| 20242 Hickory St Detroit, MI | 3.0 | 1.0 | 747 | $1,300 | $1.74 | 12d | 1 | 0.38mi |
| 20227 Pelkey St Detroit, MI | 3.0 | 1.0 | 968 | $1,350 | $1.39 | 18d | 1 | 0.40mi |
| 21412 Waltham Rd Warren, MI | 2.0 | 1.0 | 696 | $1,225 | $1.76 | 44d | 1 | 0.40mi |
| 20215 Schoenherr St Unit 1 Detroit, MI | 2.0 | 1.0 | 1000 | $1,200 | $1.20 | 19d | 1 | 0.42mi |
| 20296 Waltham St Detroit, MI | 3.0 | 1.5 | 986 | $1,300 | $1.32 | 18d | 1 | 0.50mi |
| 20027 Alcoy St Detroit, MI | 3.0 | 1.0 | 1000 | $1,349 | $1.35 | 18d | 1 | 0.53mi |
| 14068 Carlisle St Detroit, MI | 3.0 | 1.0 | 1020 | $1,300 | $1.27 | 25d | 1 | 0.53mi |
| 20553 Hamburg St Detroit, MI | 3.0 | 1.0 | 1074 | $1,300 | $1.21 | 4d | 1 | 0.58mi |
| 20091 Barlow St Detroit, MI | 3.0 | 1.0 | 930 | $1,300 | $1.40 | 18d | 1 | 0.65mi |
| 22852 Sharrow Ave Warren, MI | 3.0 | 1.0 | 1000 | $1,400 | $1.40 | 6d | 1 | 0.76mi |
| 13669 Pfent St Detroit, MI | 3.0 | 2.0 | 1031 | $1,374 | $1.33 | 18d | 1 | 0.99mi |
| 19220 Alcoy St Detroit, MI | 3.0 | 1.0 | 1023 | $1,350 | $1.32 | 18d | 1 | 1.07mi |
| 19170 Joann St Detroit, MI | 4.0 | 1.0 | 1020 | $1,400 | $1.37 | 44d | 1 | 1.12mi |
| 19143 Fairport St Detroit, MI | 3.0 | 1.0 | 1070 | $1,225 | $1.14 | 18d | 1 | 1.15mi |
| 11319 Chalmers Ave Warren, MI | 3.0 | 1.0 | 975 | $1,500 | $1.54 | 25d | 1 | 1.22mi |
| 11228 Sherman Ave Warren, MI | 2.0 | 1.0 | 1000 | $1,200 | $1.20 | 13d | 1 | 1.24mi |
| 14461 Lappin St Detroit, MI | 3.0 | 1.5 | 989 | $1,150 | $1.16 | 18d | 1 | 1.25mi |
| 11236 Studebaker Ave Warren, MI | 2.0 | 1.0 | 672 | $1,175 | $1.75 | 44d | 1 | 1.29mi |
| 11359 Maxwell Ave Unit 11359 Warren, MI | 2.0 | 1.0 | 900 | $1,000 | $1.11 | 4d | 1 | 1.33mi |
| 19335 Hoover St Detroit, MI | 2.0 | 1.0 | 620 | $1,099 | $1.77 | 18d | 1 | 1.36mi |
| 19335 Hoover St Detroit, MI | 2.0 | 1.0 | 620 | $1,099 | $1.77 | 44d | 1 | 1.36mi |
| 18703 Waltham St Detroit, MI | 2.0 | 1.0 | 1000 | $1,100 | $1.10 | 44d | 1 | 1.39mi |
| 11076 Hudson Ave Warren, MI | 3.0 | 1.0 | 936 | $1,395 | $1.49 | 4d | 1 | 1.39mi |
| 18624 Fairport St Unit NA Detroit, MI | 3.0 | 1.0 | 924 | $1,450 | $1.57 | 25d | 1 | 1.41mi |
| 18624 Fairport St Detroit, MI | 3.0 | 1.0 | 874 | $1,450 | $1.66 | 23d | 1 | 1.41mi |
| 18681 Barlow St Detroit, MI | 3.0 | 1.0 | 1041 | $1,400 | $1.34 | 25d | 1 | 1.43mi |
| 15663 Carlisle St Detroit, MI | 2.0 | 1.0 | 803 | $1,050 | $1.31 | 16d | 1 | 1.45mi |
| 11331 Continental Ave Warren, MI | 2.0 | 1.0 | 765 | $1,250 | $1.63 | 25d | 1 | 1.48mi |
Listing history 11 events
-
2026-06-15statusdays on market $129,900 Pending 14 DOM
-
2026-06-13days on market $129,900 Active 13 DOM
-
2026-06-13days on market $129,900 Active 12 DOM
-
2026-06-09days on market $129,900 Active 9 DOM
-
2026-06-08days on market $129,900 Active 8 DOM
-
2026-06-07days on market $129,900 Active 7 DOM
-
2026-06-04days on market $129,900 Active 4 DOM
-
2026-06-03days on market $129,900 Active 3 DOM
-
2026-06-02days on market $129,900 Active 2 DOM
-
2026-06-01statusdays on market $129,900 Active 1 DOM
-
2026-05-31days on market $129,900 Coming Soon 2 DOM
ⓘ Source: listings_history table (triggers on properties + properties_extension) + one-shot
backfill from property_details.listing_events for pre-trigger history.
Tax reassessment forecast MI · Partial reset (capped growth)
- Current annual tax
- $1,241 · $103/mo
- Projected year-2 tax
- $1,620 · $135/mo
- Expected delta
- +$380/yr (+$32/mo · 30.6%)
ⓘ Screening estimate from a state-policy table — verify with the county assessor before closing.
Climate risk First Street
- Flood 1/10 Low FEMA zone X (unshaded) · 0% chance over 30 yrs
- Wildfire 1/10 Low
- Heat 3/10 Moderate 7 d/yr ≥96°F today · 15 d/yr by 30 yrs out
- Wind 1/10 Low
- Air quality 3/10 Moderate 3 unhealthy d/yr today · 4 by 30 yrs out
Nearby sold comps map
Loading sold comps map…
Walkable amenities ~0.75 mi
Loading nearby amenities…
Taxation est. · year 1
- Rental income
- $16,416
- − Mortgage interest
- −$7,276
- − Property taxes
- −$1,241
- − Insurance
- −$650
- − Repairs & maintenance
- −$1,313
- − Management
- −$1,313
- − Depreciation
- −$3,779
- Taxable income
- $844
- Est. tax owed @ 24.0%
- −$203
- After-tax cash flow
- $2,701/yr
For passive investors: Depreciation is non-cash, so a rental often shows a tax loss while cash-flowing — sheltering income. Rental losses are passive: they offset passive income freely, and up to $25,000/yr can offset ordinary (W-2) income if you actively participate and your MAGI is under $100k (phasing out to $0 by $150k); unused losses carry forward. On sale, claimed depreciation is recaptured at up to 25%, and gains may owe capital-gains tax (a 1031 exchange can defer both). Figures are a year-1 estimate at your 24.0% rate — not tax advice; consult a CPA.
Schools (NCES district)
- District
- Van Dyke Public Schools
- NCES district ID
- 2634680
- Math proficiency
- 7% ▼ -11.00%
- Reading proficiency
- 19% ▼ -5.00%
- Median HH income
- $33,231
- Composite
- 10.46/100
- National rank
- #9784
- State rank
- #512 of 540 in MI
Livability — Warren
- Score
- 74/100
- State rank
- #171
- US rank
- #4491
Category grades
Schools grade is shown separately in the Schools card above.
Census & demographics
- Census place
- Warren, MI
- County
- Macomb County · 638,552 people
- City population
- 114,937
- Metro
- Detroit-Warren-Dearborn, MI
- Population (ZIP)
- 31,853
- Household income
- $52,366
- Rent vs Own
- Severe rent burden
- 1754.0
Population outlook (Macomb County) Hauer SSP2
- Today (2025)
- 925,296 people
- By 2030
- 948,226 · +2.5%
- By 2040
- 983,961 · +6.3%
- By 2050
- 1,010,200 · +9.2%
- By 2075
- 1,076,222 · +16.3%
- By 2100
- 1,077,065 · +16.4%
Race, ethnicity, and origin ACS 2023
- Neighborhood character
- Diverse neighborhood (Simpson 0.61)
- Race & ethnicity
- White 53% Black 31% Asian 7% Two or more races 6% Hispanic / Latino 3%
- Common ancestry
- Romanian 11% Lithuanian 3% Slovak 2%
- Foreign-born
- 5% · Canada
- Languages at home
- 92% English-only · Other Asian/Pacific 3% Other Indo-European 2% Arabic 1%
Political lean MEDSL · Macomb
- 2024 margin
- R (+13.7) · D 42.2% · R 55.9% · Other 1.9%
- 2008→2024 swing
- -22.3pp toward R · 2008: 8.6pp · 2024: -13.7pp
- All cycles
- 2024: R+13.7 2020: R+8.1 2016: R+11.6 2012: D+4.0 2008: D+8.6
Not yet ingested
- Civics
- —
Market trends
- HPI YoY
- ▼ -211.46%
- Current HPI
- 154.8325
- Rent YoY
- ▲ 2.94%
- Metro
- Detroit-Warren-Dearborn, MI
- State GDP YoY
- ▲ 1.37%
- F500 in state
- 28
Industry mix (Fortune 500 HQ in MI)
| Industry | F500 HQs | Revenue |
|---|---|---|
| Automotive Parts | 3 | $48B |
|
||
| Automotive | 2 | $372B |
|
||
| Chemicals | 1 | $45B |
|
||
| Automotive Retail | 1 | $29B |
|
||
| Healthcare / Medical Devices | 1 | $23B |
|
||
| Automotive Technology | 1 | $20B |
|
||
Price history
+233.9% since first listed10 events — show timeline
- 2026-05-29 Coming Soon $129,900 MiRealSource-MiMLS
- 2019-03-28 Sold (MLS) $62,000 MiRealSource-MiMLS
- 2019-03-28 Sold (MLS) $62,000 REALCOMP
- 2019-03-26 Sold (Public Records) $62,000 Public Records
- 2019-02-01 Pending — MiRealSource-MiMLS
- 2019-02-01 Pending — REALCOMP
- 2019-01-22 Listed $59,900 MiRealSource-MiMLS
- 2019-01-22 Listed $59,900 REALCOMP
- 1996-08-23 Listing Removed — REALCOMP
- 1996-04-23 Listed $38,900 REALCOMP
Property tax history
+3.8%/yrLatest (2025): $1,241 · +2.5% YoY. Source: county tax records.
Cash-flow waterfall
monthlySold comps — $/sqft
last 12 mo · ≤1 miLoading sold comps…