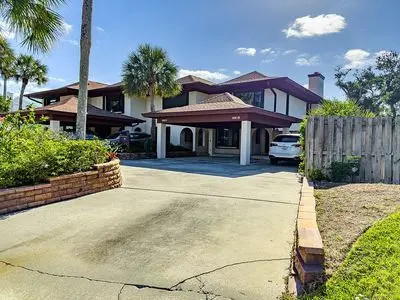
4913 Bethel Creek Dr · Vero Beach, FL
Flood risk 7/10 · Major
- FEMA flood zone
- X (unshaded)
- Chance of flooding over 30 yrs
- 0.76%
- Est. flood insurance / yr
- $507 – $1,088
Fire risk 1/10 · Minimal
- Est. fire insurance / yr
- $947 – $1,759
Heat risk 10/10 · Severe
- Hot days now (above 105°F)
- 7 days/yr
- Hot days in 30 yrs
- 25 days/yr
Wind risk 10/10 · Severe
- Chance of severe wind over 30 yrs
- 99.0%
Air-quality risk 1/10 · Minimal
- Unhealthy air days now
- 0 days/yr
- Unhealthy air days in 30 yrs
- 0 days/yr
Risk factors via First Street. Map © Google.
Why this score? — see what drove the C grade
The composite is a weighted blend of 9 inputs, each scored 0–100. Each bar is that input's sub-score; the figure is the points it added to the 100-point composite (weight × sub-score).
- Cash flow +21.1/30.0
- ARV discount +7.5/15.0
- DSCR +6.7/10.0
- 1% rule +5.6/10.0
- Rent growth +5.0/5.0
- Schools +4.2/10.0
- Livability +4.0/5.0
- Condition / age +3.8/5.0
- Appreciation +0.0/10.0
$485,000
🖨 Deal sheet 📄 Offer letter ✓ Due diligence
Listing remarks
Enjoy living steps away from the beach in this 2 Bedroom / 2.5 Bath Townhome. Walk 1/2 a block to Village Beach Market or stroll down the street to Van Busch Park. This home includes a bedroom balcony, a walk in closet, an updated master bathroom, a stone patio with a wall of plants. The pool is right outside the back sliding glass doors. The kitchen has 1 year old appliances including an induction heat range. Feel secure with storm shudders and a roof that is warrantied against leaks.
Key facts
- Pool access
- Beach access
- Walk in closet
Tags
Neighborhood map
What this means for you Summary
Snapshot
- This is a 2-bed/3.0-bath other listed at $485k. Condition is rated good.
Deal economics
- At list price, monthly cash flow is $625 ($8k/yr) — positive.
- The deal already cash-flows at list — no discount required.
- Meets the 1% rule at list price ($5k rent vs $485k).
- Recommended offer: $470k (3.0% below list) — sets the bar for market timing.
- Cap rate 8.0% vs local median 2.9% in Vero Beach — top-decile yield for the area; either an underpriced asset or a hidden risk that comps aren't pricing in. Stress-test before assuming the spread holds.
Location & tenants
- Location reads 80/100 on livability (#116 in FL, #1,784 nationally) — a professional / high-income tenant draw. Strengths: crime A+, commute A+, health & safety A+; Watch: employment D+, amenities D.
- Indian River (other): math 48% / reading 52% proficiency, ranked #35 of 73 in FL (top 48%) — acceptable for families but not a draw, mixed tenant base, ~2y average lease.
- Market conditions: Rents rising fast (+11.0%/yr); 498 active listings in the ZIP; 40 comparable units currently listed for rent nearby; rentals at typical pace (median 21d on market — plan ~3-4 weeks tenant-placement turnaround); high-income renter base; 564 units permitted in Indian River County in 2024 (281 in 5+ unit buildings).
- This rent runs 41% of the median local income ($150k/yr) — at the standard rent-burdened threshold; future hikes will face affordability resistance.
Forward outlook
- Local home prices are declining (-3.0%/yr); year-one equity from $3k of loan paydown is wiped out by about $15k of value loss. Plan a longer hold.
- Indian River County population projected at +18% by 2050 — long-run rental-demand tailwind backs the buy-and-hold thesis.
- At projected returns (-3.0% appreciation + 8.0% rent growth), your $136k cash investment doubles in ~9 years — after that, you're playing with house money.
Negotiation context
- It's been on market 34 days — a 3% lower offer ($470k) is reasonable based on typical stale-listing flexibility.
Risks & watch-outs
- Watch-outs: flood insurance adds $66/mo.
- Climate carrying-cost: major flood risk; severe wind risk, 99% chance of damaging wind over 30y; extreme-heat days projected 7→25/yr by 2055 (HVAC capex compounding) — expect insurance premiums to compound above CPI over the hold.
Questions for the listing agent
- It's been on market 34 days. Have you received any prior offers? Is the seller open to a 3% concession, seller financing, or rate buy-down credit?
- What's the actual annual flood-insurance premium (NFIP or private), and is the property in a SFHA with mandatory coverage?
- Is there a deadline driving the sale (1031 exchange, divorce, estate, relocation)? That informs how much negotiation room exists.
- What's the average days-on-market for RENTAL listings here right now (not sales)? A rising rental-DOM trend means longer vacancies and softer asking-rent achievability than the comps imply.
- What's the recent tenant-quality profile in this submarket — average credit score on applications, eviction rate, late-payment / NSF rate, and stable-employment percentage? A property-management company in the area should have these aggregated.
- How much new for-sale + rental construction is in the pipeline within 1–3 miles? Heavy new supply typically softens prices + rents 12–24 months out; constrained supply supports both.
Investment metrics
- 1% rule
- 1.06% ✓
- Cap rate
- 8.00%
- Cash-on-cash
- 6.11%
- DSCR
- 1.27
- GRM
- 7.9
CMA / ARV
No comps found within radius.
Projected returns pro-forma
-3.0% appreciation · 8.0% rent growth · sell at horizon
- IRR
- -2.1%
- Equity multiple
- 0.91×
- Total profit
- $-11,595
- Equity at exit
- $72,315
- IRR
- 12.4%
- Equity multiple
- 2.21×
- Total profit
- $164,782
- Equity at exit
- $41,934
Cash invested: $135,800 (down + closing). Projections, not guarantees.
Landlord ↔ Tenant lean methodology
- Overall (STATE)
- 87 Strongly Landlord-Friendly
- State Florida
- 87 Strongly Landlord-Friendly · R+3
- County
- — inherits STATE
- City
- — inherits STATE
ZIP-level market 32963
- Rents YoY
- 11.0%
- Active inventory
- 498
- Price-to-rent
- 7.9×
Monthly cashflow live
- Estimated rent
- $5,118 high interval (Pro) →
- Mortgage (P&I)
- −$2,543
- Tax est. 1.5%
- −$606 /mo · $7,275/yr
- Insurance
- −$202
- Flood insurance flood zone
- −$66 /mo · $798/yr
- HOA
- −$0
- Vacancy / Maint / Mgmt
- −$1,075
- Net cashflow
- $625
Break-even live
UW: 25.0% down · 7.5% · 30yr · 1.5% tax · 5.0% vac · 8.0% maint · 8.0% mgmt
Financing live
Cash to close
- Down payment
- $121,250
- Closing costs
- $14,550
- Reserves months
- —
- Total cash needed
- —
Loan-product check · same deal, 3 products live
Conventional
25% down · 7.5% · 30yr
- Down + closing
- —
- Monthly P&I
- —
- Monthly cashflow
- —
- DSCR
- —
- Eligible?
- —
Personal DTI + credit; lowest rate.
DSCR
20% down · 8.5% · 30yr
- Down + closing
- —
- Monthly P&I
- —
- Monthly cashflow
- —
- DSCR
- —
- Eligible?
- —
No personal income docs; deal must DSCR.
Hard money
10% down · 12.0% · 12mo
- Down + closing
- —
- Monthly P&I
- —
- Monthly cashflow
- —
- DSCR
- —
- Eligible?
- —
Short-term bridge; refi at stabilization.
Rent comps 40 comps
| Address | Beds | Baths | Sqft | Rent | $/sqft | DOM | Units | Dist |
|---|---|---|---|---|---|---|---|---|
| 4890 Bethel Creek Dr #5 Vero Beach, FL | 2.0 | 2.5 | 1244 | $2,200 | $1.77 | 21d | 1 | 0.07mi |
| 4836 Bethel Creek Dr Unit 4836 Vero Beach, FL | 2.0 | 2.5 | 1650 | $3,000 | $1.82 | 13d | 1 | 0.08mi |
| 4834 Bethel Creek Dr Vero Beach, FL | 2.0 | 2.5 | 1500 | $2,900 | $1.93 | 21d | 1 | 0.08mi |
| 926 Tropic Dr Vero Beach, FL | 1.0 | 1.0 | 2000 | $2,000 | $1.00 | 13d | 1 | 0.08mi |
| 907 Tropic Dr Vero Beach, FL | 3.0 | 2.0 | 1830 | $10,000 | $5.46 | 21d | 1 | 0.10mi |
| 705 Bahia Mar Rd Vero Beach, FL | 3.0 | 2.0 | 2214 | $16,000 | $7.23 | 13d | 1 | 0.11mi |
| 4800 Bethel Creek Dr Unit 5S Vero Beach, FL | 2.0 | 2.5 | 2215 | $5,500 | $2.48 | 13d | 1 | 0.12mi |
| 5000 Highway A1A #320 Vero Beach, FL | 2.0 | 2.0 | 1980 | $5,000 | $2.53 | 21d | 1 | 0.17mi |
| 4800 Highway A1A #207 Vero Beach, FL | 2.0 | 2.0 | 1850 | $7,000 | $3.78 | 21d | 1 | 0.18mi |
| 4800 Highway A1A #506 Vero Beach, FL | 2.0 | 2.0 | 1850 | $4,500 | $2.43 | 21d | 1 | 0.18mi |
| 4800 Highway A1A #116 Vero Beach, FL | 2.0 | 2.0 | 1822 | $3,000 | $1.65 | 21d | 1 | 0.18mi |
| 902 Tides Rd Vero Beach, FL | 3.0 | 3.0 | 1810 | $8,500 | $4.70 | 13d | 1 | 0.19mi |
| 4601 Highway A1A #202 Vero Beach, FL | 2.0 | 2.0 | 1440 | $3,250 | $2.26 | 21d | 1 | 0.25mi |
| 4601 Highway A1A #103 Vero Beach, FL | 2.0 | 2.0 | 1600 | $2,500 | $1.56 | 21d | 1 | 0.25mi |
| 4600 Highway A1A #409 Vero Beach, FL | 2.0 | 2.0 | 1725 | $7,500 | $4.35 | 21d | 1 | 0.31mi |
| 4600 Highway A1A #507 Vero Beach, FL | 2.0 | 2.0 | 1400 | $5,000 | $3.57 | 21d | 1 | 0.31mi |
| 4617 Pebble Bay S Vero Beach, FL | 3.0 | 2.5 | 2240 | $8,500 | $3.79 | 21d | 1 | 0.31mi |
| 4450 Highway A1A #303 Vero Beach, FL | 2.0 | 2.0 | 1080 | $3,500 | $3.24 | 21d | 1 | 0.35mi |
| 4450 Highway A1A #404 Vero Beach, FL | 2.0 | 2.0 | 1080 | $3,499 | $3.24 | 13d | 1 | 0.35mi |
| 5100 Jimmy Buffett Memorial Hwy Unit 58G INDN RIV SHRS, FL | 2.0 | 2.0 | 1170 | $6,000 | $5.13 | 21d | 1 | 0.39mi |
| 4150 Highway A1A #111 Vero Beach, FL | 2.0 | 2.0 | 1300 | $2,600 | $2.00 | 21d | 1 | 0.52mi |
| 5101 Highway A1A #109 Vero Beach, FL | 3.0 | 2.0 | 1848 | $5,500 | $2.98 | 21d | 1 | 0.57mi |
| 4141 Ocean Dr Vero Beach, FL | 2.0–3.0 | 2.0 | 1200 | $3,500 | $2.92 | 13d | 4 | 0.58mi |
| 5151 Jimmy Buffett Memorial Hwy Unit 512 Indian River Shores, FL | 2.0 | 2.0 | 1339 | $4,600 | $3.44 | 21d | 1 | 0.65mi |
| 5151 Jimmy Buffett Memorial Hwy Unit 305 Indian River Shores, FL | 2.0 | 2.0 | 1339 | $2,300 | $1.72 | 21d | 1 | 0.65mi |
| 4019 Silver Palm Dr #8 Vero Beach, FL | 2.0 | 2.5 | 1460 | $3,000 | $2.05 | 21d | 1 | 0.67mi |
| 4009 Silver Palm Dr #3 Vero Beach, FL | 2.0 | 2.5 | 1430 | $5,100 | $3.57 | 21d | 1 | 0.69mi |
| 4026 Silver Palm Dr Vero Beach, FL | 2.0 | 2.0 | 1200 | $3,500 | $2.92 | 13d | 1 | 0.69mi |
| 4049 Ocean Dr Vero Beach, FL | 2.0 | 2.0 | 1250 | $3,750 | $3.00 | 21d | 2 | 0.71mi |
| 3816 Mockingbird Dr Vero Beach, FL | 3.0 | 3.0 | 1600 | $13,000 | $8.12 | 21d | 1 | 0.74mi |
| 3939 Ocean Dr Unit B-407 Vero Beach, FL | 3.0 | 2.0 | 1700 | $7,000 | $4.12 | 21d | 1 | 0.76mi |
| 3939 Ocean Dr Ph 8 Vero Beach, FL | 2.0 | 2.0 | 1080 | $7,500 | $6.94 | 21d | 1 | 0.76mi |
| 5300 Jimmy Buffett Memorial Hwy Unit 314 Indian River Shores, FL | 2.0 | 2.0 | 1300 | $3,000 | $2.31 | 21d | 1 | 0.77mi |
| 5300 Jimmy Buffett Memorial Hwy Unit 408 Indian River Shores, FL | 2.0 | 2.0 | 1300 | $9,000 | $6.92 | 21d | 1 | 0.77mi |
| 5300 Jimmy Buffett Memorial Hwy Unit 305 Indian River Shores, FL | 2.0 | 2.0 | 1300 | $6,000 | $4.62 | 21d | 1 | 0.77mi |
| 5300 Jimmy Buffett Memorial Hwy Unit 214 Indian River Shores, FL | 2.0 | 2.0 | 1300 | $5,500 | $4.23 | 21d | 1 | 0.77mi |
| 5300 Jimmy Buffett Memorial Hwy #301 Indian River Shores, FL | 2.0 | 2.0 | 1300 | $7,000 | $5.38 | 21d | 1 | 0.78mi |
| 3939 Ocean Dr Unit 302B Vero Beach, FL | 2.0 | 2.0 | 1100 | $5,500 | $5.00 | 21d | 1 | 0.78mi |
| 3939 Ocean Dr Unit 201A Vero Beach, FL | 2.0 | 2.0 | 1130 | $4,000 | $3.54 | 21d | 1 | 0.78mi |
| 3939 Ocean Dr Unit 401B Vero Beach, FL | 2.0 | 2.0 | 1130 | $2,700 | $2.39 | 21d | 1 | 0.78mi |
Listing history 13 events
-
2026-06-15days on market $485,000 Active 34 DOM
-
2026-06-14days on market $485,000 Active 32 DOM
-
2026-06-13days on market $485,000 Active 31 DOM
-
2026-06-10days on market $485,000 Active 29 DOM
-
2026-06-09days on market $485,000 Active 28 DOM
-
2026-06-08days on market $485,000 Active 27 DOM
-
2026-06-07days on market $485,000 Active 26 DOM
-
2026-06-05days on market $485,000 Active 23 DOM
-
2026-06-02days on market $485,000 Active 21 DOM
-
2026-06-01days on market $485,000 Active 20 DOM
-
2026-05-31days on market $485,000 Active 19 DOM
-
2026-05-30days on market $485,000 Active 18 DOM
-
2026-05-12$485,000 Active
ⓘ Source: listings_history table (triggers on properties + properties_extension) + one-shot
backfill from property_details.listing_events for pre-trigger history.
Climate risk First Street
- Flood 7/10 Severe FEMA zone X (unshaded) · 76% chance over 30 yrs
- Wildfire 1/10 Low
- Heat 10/10 Extreme 7 d/yr ≥105°F today · 25 d/yr by 30 yrs out
- Wind 10/10 Extreme 99% chance of damaging wind over 30 yrs
- Air quality 1/10 Low 0 unhealthy d/yr today · 0 by 30 yrs out
Nearby sold comps map
Loading sold comps map…
Walkable amenities ~0.75 mi
Loading nearby amenities…
Taxation est. · year 1
- Rental income
- $61,421
- − Mortgage interest
- −$27,168
- − Property taxes
- −$7,275
- − Insurance
- −$3,222
- − Repairs & maintenance
- −$4,914
- − Management
- −$4,914
- − Depreciation
- −$14,109
- Taxable loss
- −$181
- Est. tax savings @ 24.0%
- +$43
- After-tax cash flow
- $7,548/yr
For passive investors: Depreciation is non-cash, so a rental often shows a tax loss while cash-flowing — sheltering income. Rental losses are passive: they offset passive income freely, and up to $25,000/yr can offset ordinary (W-2) income if you actively participate and your MAGI is under $100k (phasing out to $0 by $150k); unused losses carry forward. On sale, claimed depreciation is recaptured at up to 25%, and gains may owe capital-gains tax (a 1031 exchange can defer both). Figures are a year-1 estimate at your 24.0% rate — not tax advice; consult a CPA.
Condition & rehab AI · 1 photo
This 2-bedroom townhome is in good condition with recent updates and a well-maintained exterior. It offers a good starting point for potential buyers or renters, with minor improvements that could further enhance its value.
Value-add opportunities
- Both landscaping — enhances curb appeal and adds value
- Both painting — fresh paint can make a home look more inviting
- Both minor repairs to driveway — cracks in the driveway can be repaired to improve curb appeal and functionality
Renovation cost estimate screening
Value-add ROI direction
- Both landscaping — enhances curb appeal and adds value ↑
- Both painting — fresh paint can make a home look more inviting ↑
- Both minor repairs to driveway — cracks in the driveway can be repaired to improve curb appeal and functionality ↑
ⓘ Cost ranges are severity-bucket heuristics (US national rule-of-thumb). Get contractor quotes + a written scope before underwriting a rehab budget.
Schools (NCES district)
- District
- Indian River
- NCES district ID
- 1200930
- Math proficiency
- 48% ▼ -9.00%
- Reading proficiency
- 52% ▼ -3.00%
- Median HH income
- $46,597
- Composite
- 42.45/100
- National rank
- #3218
- State rank
- #35 of 73 in FL
Livability — Vero Beach
- Score
- 80/100
- State rank
- #116
- US rank
- #1784
Category grades
Schools grade is shown separately in the Schools card above.
Census & demographics
- Census place
- Vero Beach, FL
- County
- Indian River County · 143,738 people
- City population
- 98,707
- Metro
- Sebastian-Vero Beach, FL
- Population (ZIP)
- 15,008
- Household income
- $149,923
- Rent vs Own
- Severe rent burden
- 119.0
Population outlook (Indian River County) Hauer SSP2
- Today (2025)
- 165,104 people
- By 2030
- 172,869 · +4.7%
- By 2040
- 185,640 · +12.4%
- By 2050
- 194,465 · +17.8%
- By 2075
- 211,115 · +27.9%
- By 2100
- 211,781 · +28.3%
Race, ethnicity, and origin ACS 2023
- Neighborhood character
- Predominantly White (92%)
- Race & ethnicity
- White 92% Two or more races 5% Hispanic / Latino 4% Asian 2%
- Common ancestry
- Slovak 5% Lithuanian 4% Italian 3%
- Foreign-born
- 9% · Canada
- Languages at home
- 92% English-only · Spanish 3% Other Indo-European 1% German/W. Germanic 1%
Political lean MEDSL · Indian River
- 2024 margin
- Strong R (+27.4) · D 36.0% · R 63.4%
- 2008→2024 swing
- -12.5pp toward R · 2008: -14.8pp · 2024: -27.4pp
- All cycles
- 2024: R+27.4 2020: R+21.6 2016: R+24.5 2012: R+22.3 2008: R+14.8
Not yet ingested
- Civics
- —
Market trends
- HPI YoY
- ▼ -180.47%
- Current HPI
- 312.0326
- Rent YoY
- ▲ 11.04%
- Metro
- Sebastian-Vero Beach, FL
- State GDP YoY
- ▲ 3.28%
- F500 in state
- 36
Industry mix (Fortune 500 HQ in FL)
| Industry | F500 HQs | Revenue |
|---|---|---|
| Industrial Technology | 2 | $29B |
|
||
| Insurance | 2 | $17B |
|
||
| Retail | 1 | $60B |
|
||
| Technology Distribution | 1 | $58B |
|
||
| Homebuilding | 1 | $35B |
|
||
| Technology Manufacturing | 1 | $35B |
|
||
Price history
1 event — show timeline
- 2026-05-12 Listed $485,000 FSBO.com
Cash-flow waterfall
monthlySold comps — $/sqft
last 12 mo · ≤1 miLoading sold comps…