6708 N Meridian Ave Unit A · Oklahoma City, OK
Flood risk 1/10 · Minimal
- FEMA flood zone
- X (unshaded)
- Chance of flooding over 30 yrs
- 0.0%
- Est. flood insurance / yr
- $507 – $1,088
Fire risk 1/10 · Minimal
- Est. fire insurance / yr
- $2,463 – $4,575
Heat risk 6/10 · Moderate
- Hot days now (above 106°F)
- 7 days/yr
- Hot days in 30 yrs
- 19 days/yr
Wind risk 2/10 · Minimal
- Chance of severe wind over 30 yrs
- 2.0%
Air-quality risk 2/10 · Minimal
- Unhealthy air days now
- 1 days/yr
- Unhealthy air days in 30 yrs
- 2 days/yr
Risk factors via First Street. Map © Google.
Why this score? — see what drove the D grade
The composite is a weighted blend of 9 inputs, each scored 0–100. Each bar is that input's sub-score; the figure is the points it added to the 100-point composite (weight × sub-score).
- Cash flow +13.3/30.0
- ARV discount +7.5/15.0
- 1% rule +7.3/10.0
- DSCR +4.0/10.0
- Livability +4.0/5.0
- Rent growth +3.6/5.0
- Condition / age +2.5/5.0
- Schools +1.3/10.0
- Appreciation +0.0/10.0
$76,000
🖨 Deal sheet (PDF) 📄 Offer letter ✓ Due diligence
Listing remarks MLS
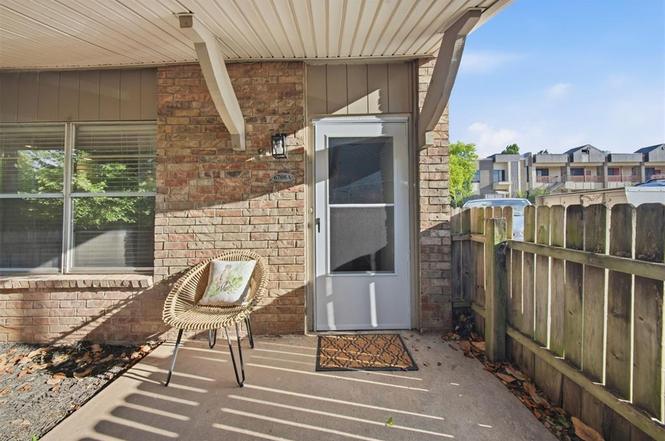
OPEN HOUSE Sunday 06.03.18 2-4PM. Don't miss this one! Enter Condo through gated private Open Patio area facing GREENBELT with view of mature trees and creek. 16x14 Living Area features wood look ceramic tile & view of greenbelt. Dining Area 10x9, is open to Living area. Kitchen is 7x6 with freestanding Range/Microwave & Dishwasher. Bedroom is 14x11 with large closet 11x2. 5x8 bath has tub & shower, and a great supply of HOT WATER!. Stackable washer & dryer included. One Reserved parking space next to Condo, guest parking to the west of building. UPDATES 2014 Wood look Ceramic Tile throughout, Carpet only in Bedroom, Living room Down Lights, Bathroom Tub, Toilet, Lighting, Vanity, Sink & Faucets. 2018: NEW GAS RANGE/MICROWAVE, PAINT IN LIVING , DINING & BEDROOM; KITCHEN LIGHT. HOA $123.75monthly covers Reserved Parking Space, Exterior insurance, Exterior maintenance, Heat Pump2010; shared fee for water & garbage utilities averages $70.00 monthly.
Key facts
- Greenbelt view
- Convenient location
- $256 HOA
Tags
Property features AI
Finance
- Other: Homestead exempt; First right of refusal for condo sales
- HOA & community: Mandatory association dues; Association covers greenbelt, exterior maintenance, and pool
Exterior
- Home design: Condominium (residential); Lower level unit; North-facing
- Construction: Brick and frame construction; Composition roof; Slab foundation; Existing property
- Exterior features: Open patio; Creek on property; Adjacent to greenbelt; Private gunite pool
Interior
- Kitchen: Dishwasher; Microwave; Refrigerator; 4-burner range
- Bedrooms: 1 bedroom (lower level condo)
- Bathrooms: 1 full bathroom
- Heating & cooling: Heat pump for heating and cooling
- Interior features: Open patio access from the unit; No fireplace
- Laundry & utility: Washer and dryer included
Neighborhood map
What this means for you Summary
Snapshot
- This is a 1-bed/1.0-bath condo listed at $76k.
Deal economics
- At list price, monthly cash flow is $0 ($3/yr) — positive.
- The deal already cash-flows at list — no discount required.
- Meets the 1% rule at list price ($938 rent vs $76k).
- Cap rate 6.3% vs local median 3.7% in Oklahoma City — top-decile yield for the area; either an underpriced asset or a hidden risk that comps aren't pricing in. Stress-test before assuming the spread holds.
Location & tenants
- Location reads 80/100 on livability (#3 in OK, #1,635 nationally) — a professional / high-income tenant draw. Strengths: amenities A+, commute A+, cost of living A+; Watch: crime F.
- Putnam City (urban): math 12% / reading 16% proficiency, ranked #227 of 270 in OK (top 84%) — low school quality limits family demand, transient renter base, plan for 1-2y turnover; 65% free/reduced lunch — lower-income household profile, screen leases tightly.
- Zoned schools: Coronado Heights Es (math 18% / reading 18%, grade F, #534 of 845 statewide, top 64%, 460 students, 0% FRL); James L. Capps Ms (math 9% / reading 18%, grade F, #252 of 345 statewide, top 74%, 975 students, 0% FRL); Putnam City Hs (math 12% / reading 23%, grade F, #307 of 447 statewide, top 69%, 2,014 students, 0% FRL) — zoned schools average 0% FRL vs 65% district-wide (65 pts lower); this property's tenant base skews higher-income than the district average.
- Market conditions: Rents rising fast (+4.3%/yr); 140 active listings in the ZIP; 8 comparable units currently listed for rent nearby; rentals leasing fast (median 5d on market — plan ~1-2 weeks tenant-placement turnaround); solid renter incomes; 5,365 units permitted in Oklahoma County in 2024 (569 in 5+ unit buildings).
- This rent is only 14% of the median local income ($81k/yr) — well below the 30% rent-burden line; pricing power to push rent on renewal without tenant pushback.
Forward outlook
- Local home prices are declining (-3.0%/yr); year-one equity from $525 of loan paydown is wiped out by about $2k of value loss. Plan a longer hold.
- Oklahoma County population projected at +41% by 2050 — long-run rental-demand tailwind backs the buy-and-hold thesis.
Negotiation context
- Only 7 days on market — expect competitive offers; lowballing is unlikely to land.
- 2 sale attempts since 8y ago with the ask held roughly flat each time — persistent listings suggest the price (not the market) is what's stuck; bring a comps-based counter.
- Current owner paid $39k; list at $76k implies a 95% gain — meaningful room to come down on a strong offer.
Risks & watch-outs
- Watch-outs: HOA is 27% of rent.
- Climate carrying-cost: extreme-heat days projected 7→19/yr by 2055 (HVAC capex compounding) — expect insurance premiums to compound above CPI over the hold.
Questions for the listing agent
- Built in 1970 — when were the roof, HVAC, electrical panel, plumbing, and water heater last replaced?
- What does the HOA fee cover, when was the last increase, and are there any pending special assessments or reserve-fund shortfalls?
- Any open or pending special assessments — roof, HVAC, plumbing, elevator, façade? What's the per-unit balance and payoff schedule, and is the seller paying it off at close or rolling it to the buyer?
- Is there a deadline driving the sale (1031 exchange, divorce, estate, relocation)? That informs how much negotiation room exists.
- Schools are F-rated, which usually means shorter tenancies and higher turnover. Who's the typical renter profile here, and what's been the actual vacancy rate?
- Crime grade is F in this area — have there been break-ins, vandalism, or insurance claims at this property in the last 3 years? What carrier currently insures it and at what premium?
- The area grade is low — what's the realistic commute time and amenity access for the typical tenant pool here? Any planned neighborhood developments (good or bad) we should know about?
- What's the average days-on-market for RENTAL listings here right now (not sales)? A rising rental-DOM trend means longer vacancies and softer asking-rent achievability than the comps imply.
- What's the recent tenant-quality profile in this submarket — average credit score on applications, eviction rate, late-payment / NSF rate, and stable-employment percentage? A property-management company in the area should have these aggregated.
- How much new apartment / multifamily construction is in the pipeline within 1–3 miles? Heavy new supply (>2% of stock underway) typically softens rents 12–24 months out; light construction supports rent growth.
Investment metrics
- 1% rule
- 1.23% ✓
- Cap rate
- 6.30%
- Cash-on-cash
- 0.01%
- DSCR
- 1.00
- GRM
- 6.8
CMA / ARV
No comps found within radius.
Projected returns pro-forma
-3.0% appreciation · 4.27% rent growth · sell at horizon
- IRR
- -14.1%
- Equity multiple
- 0.49×
- Total profit
- $-10,941
- Equity at exit
- $11,332
- IRR
- -2.4%
- Equity multiple
- 0.82×
- Total profit
- $-3,805
- Equity at exit
- $6,571
Cash invested: $21,280 (down + closing). Projections, not guarantees.
Landlord ↔ Tenant lean methodology
- Overall (STATE)
- 83 Strongly Landlord-Friendly
- State Oklahoma
- 83 Strongly Landlord-Friendly · R+20
- County
- — inherits STATE
- City
- — inherits STATE
ZIP-level market 73116
- Rents YoY
- 4.3%
- Active inventory
- 140
- Price-to-rent
- 6.8×
Monthly cashflow live
- Estimated rent
- $938 high interval (Pro) →
- Mortgage (P&I)
- −$399
- Tax from tax record
- −$54 /mo · $650/yr
- Insurance
- −$32
- HOA
- −$256
- Vacancy / Maint / Mgmt
- −$197
- Net cashflow
- $0
Break-even live
Sensitivity live
| Price | -10% $43 | -5% $22 | +0% $0 | +5% $-21 | +10% $-43 |
|---|---|---|---|---|---|
| Rent | -10% $-74 | -5% $-37 | +0% $0 | +5% $37 | +10% $74 |
| Rate | -1.0pp $39 | -0.5pp $20 | base $0 | +0.5pp $-19 | +1.0pp $-39 |
UW: 25.0% down · 7.5% · 30yr · 1.5% tax · 5.0% vac · 8.0% maint · 8.0% mgmt
Financing live
Cash to close
- Down payment
- $19,000
- Closing costs
- $2,280
- Reserves months
- —
- Total cash needed
- —
Loan-product check · same deal, 3 products live
Conventional
25% down · 7.5% · 30yr
- Down + closing
- —
- Monthly P&I
- —
- Monthly cashflow
- —
- DSCR
- —
- Eligible?
- —
Personal DTI + credit; lowest rate.
DSCR
20% down · 8.5% · 30yr
- Down + closing
- —
- Monthly P&I
- —
- Monthly cashflow
- —
- DSCR
- —
- Eligible?
- —
No personal income docs; deal must DSCR.
Hard money
10% down · 12.0% · 12mo
- Down + closing
- —
- Monthly P&I
- —
- Monthly cashflow
- —
- DSCR
- —
- Eligible?
- —
Short-term bridge; refi at stabilization.
Rent comps 8 comps
| Address | Beds | Baths | Sqft | Rent | $/sqft | DOM | Units | Dist |
|---|---|---|---|---|---|---|---|---|
| 6300 N Meridian Ave Oklahoma City, OK | 2.0 | 1.0–2.0 | 773 | $778 | $1.01 | 4d | 19 | 0.29mi |
| 6300 N Meridian Ave Unit 6312-102 Oklahoma City, OK | 1.0 | 1.0 | 700 | $700 | $1.00 | 23d | 1 | 0.30mi |
| 6300 N Meridian Ave Unit 6306-201 Oklahoma City, OK | 1.0 | 1.0 | 700 | $700 | $1.00 | 6d | 1 | 0.30mi |
| 5418 N Meridian Ave Oklahoma City, OK | 2.0 | 1.0–2.0 | 690 | $825 | $1.20 | 4d | 14 | 1.01mi |
| 7215 N Macarthur Blvd Unit 4 Warr Acres, OK | 1.0 | 1.0 | 700 | $595 | $0.85 | 5d | 1 | 1.16mi |
| 5560 N Portland Ave Oklahoma City, OK | 1.0–2.0 | 1.0–2.0 | 955 | $875 | $0.92 | 3d | 50 | 1.29mi |
| 6103 NW 63rd St Oklahoma City, OK | 1.0 | 1.0 | 696 | $795 | $1.14 | 25d | 1 | 1.33mi |
| 5577 NW 50th St Oklahoma City, OK | 1.0–2.0 | 1.0–2.0 | 725 | $689 | $0.95 | 5d | 6 | 1.39mi |
HOA detail condo
- Monthly dues
- $256 · $3,072/yr
- Likely covers
- watertrashgasexterior maint.security
- Assessments
- None detected in remarks — confirm with the listing agent.
Listing history 7 events
-
2026-06-21days on market $76,000 Active 7 DOM
-
2026-06-18remarks 619-char remark
-
2026-06-18days on market $76,000 Active 4 DOM
-
2026-06-17days on market $76,000 Active 3 DOM
-
2026-06-16days on market $76,000 Active 2 DOM
-
2026-06-15remarks 590-char remark
-
2026-06-15$76,000 Active 1 DOM
ⓘ Source: listings_history table (triggers on properties + properties_extension) + one-shot
backfill from property_details.listing_events for pre-trigger history.
Tax reassessment forecast OK · Resets to sale price
- Current annual tax
- $650 · $54/mo
- Projected year-2 tax
- $684 · $57/mo
- Expected delta
- +$34/yr (+$3/mo · 5.2%)
ⓘ Screening estimate from a state-policy table — verify with the county assessor before closing.
Climate risk First Street
- Flood 1/10 Low FEMA zone X (unshaded) · 0% chance over 30 yrs
- Wildfire 1/10 Low
- Heat 6/10 Major 7 d/yr ≥106°F today · 19 d/yr by 30 yrs out
- Wind 2/10 Low 2% chance of damaging wind over 30 yrs
- Air quality 2/10 Low 1 unhealthy d/yr today · 2 by 30 yrs out
Nearby sold comps map
Loading sold comps map…
Walkable amenities ~0.75 mi
Loading nearby amenities…
Taxation est. · year 1
- Rental income
- $11,250
- − Mortgage interest
- −$4,257
- − Property taxes
- −$650
- − Insurance
- −$380
- − Repairs & maintenance
- −$900
- − Management
- −$900
- − HOA
- −$3,072
- − Depreciation
- −$2,211
- Taxable loss
- −$1,120
- Est. tax savings @ 24.0%
- +$269
- After-tax cash flow
- $272/yr
For passive investors: Depreciation is non-cash, so a rental often shows a tax loss while cash-flowing — sheltering income. Rental losses are passive: they offset passive income freely, and up to $25,000/yr can offset ordinary (W-2) income if you actively participate and your MAGI is under $100k (phasing out to $0 by $150k); unused losses carry forward. On sale, claimed depreciation is recaptured at up to 25%, and gains may owe capital-gains tax (a 1031 exchange can defer both). Figures are a year-1 estimate at your 24.0% rate — not tax advice; consult a CPA.
Schools (NCES district)
- District
- Putnam City
- NCES district ID
- 4025290
- Math proficiency
- 12% ▼ -18.00%
- Reading proficiency
- 16% ▼ -14.00%
- Median HH income
- $46,657
- Composite
- 12.61/100
- National rank
- #9614
- State rank
- #227 of 270 in OK
Livability — Oklahoma City
- Score
- 80/100
- State rank
- #3
- US rank
- #1635
Category grades
Schools grade is shown separately in the Schools card above.
Census & demographics
- Census place
- Oklahoma City, OK
- County
- Oklahoma County · 771,644 people
- City population
- 498,656
- Metro
- Oklahoma City, OK
- Population (ZIP)
- 10,211
- Household income
- $81,226
- Rent vs Own
- Severe rent burden
- 262.0
Population outlook (Oklahoma County) Hauer SSP2
- Today (2025)
- 911,875 people
- By 2030
- 982,413 · +7.7%
- By 2040
- 1,130,468 · +24.0%
- By 2050
- 1,288,422 · +41.3%
- By 2075
- 1,711,482 · +87.7%
- By 2100
- 2,088,448 · +129.0%
Race, ethnicity, and origin ACS 2023
- Neighborhood character
- Predominantly White (72%)
- Race & ethnicity
- White 72% Two or more races 14% Hispanic / Latino 8% Black 5% Asian 3% Native American 2%
- Hispanic origin (detail)
- Mexican 6%
- Common ancestry
- Italian 3% Slovak 3% Lithuanian 2%
- Foreign-born
- 7% · Canada, South Korea, Philippines
- Languages at home
- 90% English-only · Spanish 6% Other Asian/Pacific 2% Arabic 1%
Political lean MEDSL · Oklahoma
- 2024 margin
- Toss-up / Even · D 48.0% · R 49.7% · Other 2.3%
- 2008→2024 swing
- +15.1pp toward D · 2008: -16.8pp · 2024: -1.7pp
- All cycles
- 2024: R+1.7 2020: R+1.1 2016: R+10.5 2012: R+16.7 2008: R+16.8
Not yet ingested
- Civics
- —
Market trends
- HPI YoY
- ▼ -260.29%
- Current HPI
- 258.0304
- Rent YoY
- ▲ 4.27%
- Metro
- Oklahoma City, OK
- State GDP YoY
- ▲ 1.55%
- F500 in state
- 6
Industry mix (Fortune 500 HQ in OK)
| Industry | F500 HQs | Revenue |
|---|---|---|
| Energy | 3 | $48B |
|
||
Price history
+230.4% since first listed7 events — show timeline
- 2026-06-12 Listed $76,000 MLSOK
- 2018-08-07 Sold (Public Records) $39,000 Public Records
- 2018-07-20 Sold (MLS) $39,000 MLSOK
- 2018-06-08 Pending — MLSOK
- 2018-05-29 Listed $38,800 MLSOK
- 2002-05-29 Sold (Public Records) $22,500 Public Records
- 2000-12-01 Sold (Public Records) $23,000 Public Records
Property tax history
+11.1%/yrLatest (2025): $650 · +5.7% YoY. Source: county tax records.
Cash-flow waterfall
monthlySold comps — $/sqft
last 12 mo · ≤1 miLoading sold comps…