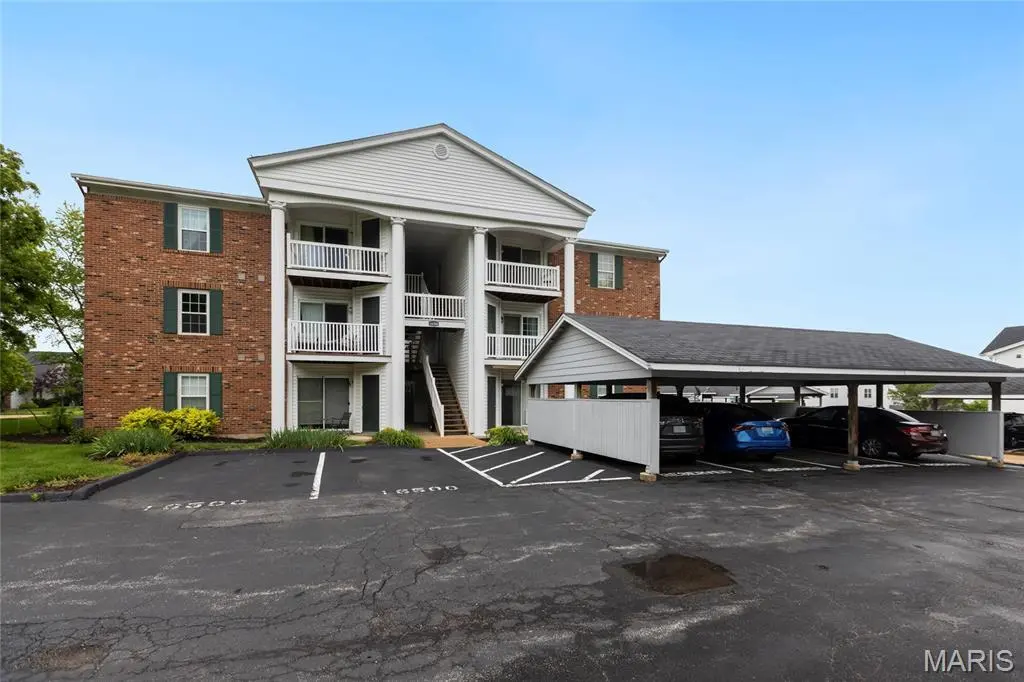
16500 Jubilee Hill Spur Unit J · Wildwood, MO
Flood risk 1/10 · Minimal
- FEMA flood zone
- X (unshaded)
- Chance of flooding over 30 yrs
- 0.0%
- Est. flood insurance / yr
- $507 – $1,088
Fire risk 2/10 · Minimal
- Est. fire insurance / yr
- $1,054 – $1,958
Heat risk 5/10 · Moderate
- Hot days now (above 106°F)
- 7 days/yr
- Hot days in 30 yrs
- 21 days/yr
Wind risk 2/10 · Minimal
- Chance of severe wind over 30 yrs
- 1.0%
Air-quality risk 2/10 · Minimal
- Unhealthy air days now
- 0 days/yr
- Unhealthy air days in 30 yrs
- 2 days/yr
Risk factors via First Street. Map © Google.
Why this score? — see what drove the D+ grade
The composite is a weighted blend of 9 inputs, each scored 0–100. Each bar is that input's sub-score; the figure is the points it added to the 100-point composite (weight × sub-score).
- Cash flow +16.3/30.0
- ARV discount +8.8/15.0
- 1% rule +5.9/10.0
- Schools +5.4/10.0
- DSCR +5.0/10.0
- Livability +3.2/5.0
- Rent growth +2.5/5.0
- Condition / age +2.5/5.0
- Appreciation +0.0/10.0
$160,000
🖨 Deal sheet 📄 Offer letter ✓ Due diligence
Listing remarks
Welcome to 16500 Jubilee Spur Hill #J in Wildwood, Missouri. This 2-bedroom, 2 full bath top-floor unit offers a functional layout, desirable features, and low-maintenance living in a convenient location within the Rockwood School District. Built in 1990 and offering 868 square feet, this third-floor residence features vaulted ceilings that create an open and spacious feel throughout the main living area. The gas fireplace serves as a focal point of the family room, adding warmth and character to the space. With no unit above, the top-floor location provides added privacy and a quieter setting. The family room flows into the eat in kitchen area, creating a practical layout for both everyday
Key facts
- $255 HOA
- Community pool
- Built 1992
Property features AI
Finance
- Other: Monthly association fee amount available ($255)
- HOA & community: HOA: Victoria Crossing; Monthly association fee; Community amenities include pool, tennis courts, basketball court; Association fee covers grounds maintenance, parking/roads maintenance, common area maintenance, parking fee, pool, sewer, snow removal, and trash
Exterior
- Parking: Assigned parking
- Utilities: Public water; Public sewer; Electric service (other)
- Home design: Condominium; Residential property; Private ownership; One level
- Construction: Brick construction
- Exterior features: Balcony; Adjoins common ground; Level lot
Interior
- Kitchen: Dishwasher; Microwave; Range; Refrigerator
- Bedrooms: 2 bedrooms on the main level
- Flooring: Carpet; Laminate; Vinyl
- Bathrooms: 2 full bathrooms on the main level
- Heating & cooling: Forced air heating (natural gas); Central air conditioning (electric)
- Interior features: Eat-in kitchen; Vaulted ceilings; Gas fireplace in living room
- Laundry & utility: Main-level laundry
Neighborhood map
What this means for you Summary
Snapshot
- This is a 2-bed/2.0-bath condo listed at $160k.
Deal economics
- At list price, monthly cash flow is $87 ($1k/yr) — positive.
- The deal already cash-flows at list — no discount required.
- Meets the 1% rule at list price ($2k rent vs $160k).
- Cap rate 6.9% vs local median 1.7% in Wildwood — top-decile yield for the area; either an underpriced asset or a hidden risk that comps aren't pricing in. Stress-test before assuming the spread holds.
Location & tenants
- Location reads 64/100 on livability (#300 in MO) — a middle-class / working-renter tenant base. Strengths: employment A+, housing A+, crime A-; Watch: amenities F, commute F, cost of living F.
- Rockwood R-VI (suburban): math 51% / reading 64% proficiency, ranked #9 of 324 in MO (top 3%) — acceptable for families but not a draw, mixed tenant base, ~2y average lease; only 10% free/reduced lunch — higher-income household profile.
- Zoned schools: Pond Elem. (math 47% / reading 67%, grade C+, #159 of 1,115 statewide, top 16%, 401 students, 11% FRL); Eureka Sr. High (math 36% / reading 66%, grade D+, #109 of 521 statewide, top 21%, 1,712 students, 10% FRL) — zoned schools at 10% FRL track the district average.
- Market conditions: 79 active listings in the ZIP; 5 comparable units currently listed for rent nearby; rentals at typical pace (median 17d on market — plan ~3-4 weeks tenant-placement turnaround); 920 units permitted in St. Louis County in 2024 (250 in 5+ unit buildings).
Forward outlook
- Local home prices are declining (-3.0%/yr); year-one equity from $1k of loan paydown is wiped out by about $5k of value loss. Plan a longer hold.
Negotiation context
- Only 7 days on market — expect competitive offers; lowballing is unlikely to land.
- Current owner paid $75k; list at $160k implies a 113% gain — meaningful room to come down on a strong offer.
Risks & watch-outs
- Climate carrying-cost: extreme-heat days projected 7→21/yr by 2055 (HVAC capex compounding) — expect insurance premiums to compound above CPI over the hold.
Questions for the listing agent
- What does the HOA fee cover, when was the last increase, and are there any pending special assessments or reserve-fund shortfalls?
- Any open or pending special assessments — roof, HVAC, plumbing, elevator, façade? What's the per-unit balance and payoff schedule, and is the seller paying it off at close or rolling it to the buyer?
- Is there a deadline driving the sale (1031 exchange, divorce, estate, relocation)? That informs how much negotiation room exists.
- Schools are A-rated — typically a magnet for longer-tenancy family renters. What's the average tenant stay here, and is there a school-zone premium baked into asking?
- The area grade is low — what's the realistic commute time and amenity access for the typical tenant pool here? Any planned neighborhood developments (good or bad) we should know about?
- What's the average days-on-market for RENTAL listings here right now (not sales)? A rising rental-DOM trend means longer vacancies and softer asking-rent achievability than the comps imply.
- What's the recent tenant-quality profile in this submarket — average credit score on applications, eviction rate, late-payment / NSF rate, and stable-employment percentage? A property-management company in the area should have these aggregated.
- How much new apartment / multifamily construction is in the pipeline within 1–3 miles? Heavy new supply (>2% of stock underway) typically softens rents 12–24 months out; light construction supports rent growth.
Investment metrics
- 1% rule
- 1.09% ✓
- Cap rate
- 6.95%
- Cash-on-cash
- 2.33%
- DSCR
- 1.10
- GRM
- 7.7
CMA / ARV
- ARV (median comp)
- $164,613
- List price
- $160,000
- Delta
- -2.80%
- Verdict
- FAIR
- Comps
- 20 within 1.0 mi
Projected returns pro-forma
-3.0% appreciation · 3.0% rent growth · sell at horizon
- IRR
- -12.5%
- Equity multiple
- 0.55×
- Total profit
- $-20,248
- Equity at exit
- $23,857
- IRR
- -3.3%
- Equity multiple
- 0.78×
- Total profit
- $-9,941
- Equity at exit
- $13,834
Cash invested: $44,800 (down + closing). Projections, not guarantees.
Landlord ↔ Tenant lean methodology
- Overall (STATE)
- 81 Strongly Landlord-Friendly
- State Missouri
- 81 Strongly Landlord-Friendly · R+10
- County
- — inherits STATE
- City
- — inherits STATE
ZIP-level market 63040
- Home prices YoY
- -12.7%
- Active inventory
- 79
- Price-to-rent
- 7.7×
Monthly cashflow live
- Estimated rent
- $1,737 high interval (Pro) →
- Mortgage (P&I)
- −$839
- Tax from tax record
- −$125 /mo · $1,496/yr
- Insurance
- −$67
- HOA
- −$255
- Vacancy / Maint / Mgmt
- −$365
- Net cashflow
- $87
Break-even live
UW: 25.0% down · 7.5% · 30yr · 1.5% tax · 5.0% vac · 8.0% maint · 8.0% mgmt
Financing live
Cash to close
- Down payment
- $40,000
- Closing costs
- $4,800
- Reserves months
- —
- Total cash needed
- —
Loan-product check · same deal, 3 products live
Conventional
25% down · 7.5% · 30yr
- Down + closing
- —
- Monthly P&I
- —
- Monthly cashflow
- —
- DSCR
- —
- Eligible?
- —
Personal DTI + credit; lowest rate.
DSCR
20% down · 8.5% · 30yr
- Down + closing
- —
- Monthly P&I
- —
- Monthly cashflow
- —
- DSCR
- —
- Eligible?
- —
No personal income docs; deal must DSCR.
Hard money
10% down · 12.0% · 12mo
- Down + closing
- —
- Monthly P&I
- —
- Monthly cashflow
- —
- DSCR
- —
- Eligible?
- —
Short-term bridge; refi at stabilization.
Rent comps 5 comps
| Address | Beds | Baths | Sqft | Rent | $/sqft | DOM | Units | Dist |
|---|---|---|---|---|---|---|---|---|
| 17054 Sandalwood Creek Dr Unit B Glencoe, MO | 2.0 | 2.0 | 939 | $1,650 | $1.76 | 17d | 1 | 0.90mi |
| 2337 Sandalwood Creek Ct Glencoe, MO | 2.0 | 2.0 | 915 | $1,650 | $1.80 | 43d | 1 | 0.96mi |
| 16342 Centerfield Ct Grover, MO | 1.0–3.0 | 1.0–2.0 | 1089 | $1,762 | $1.62 | 2d | 6 | 1.21mi |
| 16825 Autumn View Terrace Dr Ellisville, MO | 2.0–3.0 | 1.5–2.5 | 1223 | $2,125 | $1.74 | 17d | 16 | 1.37mi |
| 16318 Truman Rd Ellisville, MO | 2.0 | 1.0–2.0 | 1057 | $1,662 | $1.57 | 4d | 2 | 1.45mi |
HOA detail condo
- Monthly dues
- $255 · $3,060/yr
- Likely covers
- gas
- Assessments
- None detected in remarks — confirm with the listing agent.
Listing history 5 events
-
2026-05-15status Pending 1841-char remark
-
2026-05-08$160,000 Active 1841-char remark
-
2026-05-06historical $160,000 1841-char remark
-
1999-09-30soldstatus $75,000
-
1993-02-24soldstatus $49,500
ⓘ Source: listings_history table (triggers on properties + properties_extension) + one-shot
backfill from property_details.listing_events for pre-trigger history.
Tax reassessment forecast MO · Resets to sale price
- Current annual tax
- $1,496 · $125/mo
- Projected year-2 tax
- $1,552 · $129/mo
- Expected delta
- +$56/yr (+$5/mo · 3.7%)
ⓘ Screening estimate from a state-policy table — verify with the county assessor before closing.
Climate risk First Street
- Flood 1/10 Low FEMA zone X (unshaded) · 0% chance over 30 yrs
- Wildfire 2/10 Low
- Heat 5/10 Major 7 d/yr ≥106°F today · 21 d/yr by 30 yrs out
- Wind 2/10 Low 100% chance of damaging wind over 30 yrs
- Air quality 2/10 Low 0 unhealthy d/yr today · 2 by 30 yrs out
Nearby sold comps map
Loading sold comps map…
Walkable amenities ~0.75 mi
Loading nearby amenities…
Taxation est. · year 1
- Rental income
- $20,847
- − Mortgage interest
- −$8,962
- − Property taxes
- −$1,496
- − Insurance
- −$800
- − Repairs & maintenance
- −$1,668
- − Management
- −$1,668
- − HOA
- −$3,060
- − Depreciation
- −$4,655
- Taxable loss
- −$1,462
- Est. tax savings @ 24.0%
- +$351
- After-tax cash flow
- $1,395/yr
For passive investors: Depreciation is non-cash, so a rental often shows a tax loss while cash-flowing — sheltering income. Rental losses are passive: they offset passive income freely, and up to $25,000/yr can offset ordinary (W-2) income if you actively participate and your MAGI is under $100k (phasing out to $0 by $150k); unused losses carry forward. On sale, claimed depreciation is recaptured at up to 25%, and gains may owe capital-gains tax (a 1031 exchange can defer both). Figures are a year-1 estimate at your 24.0% rate — not tax advice; consult a CPA.
Schools (NCES district)
- District
- Rockwood R-VI
- NCES district ID
- 2926850
- Math proficiency
- 51% ▼ -7.00%
- Reading proficiency
- 64% ▼ -2.00%
- Median HH income
- $98,721
- Composite
- 53.61/100
- National rank
- #1438
- State rank
- #9 of 324 in MO
Livability — Wildwood
- Score
- 64/100
- State rank
- #300
- US rank
- #13770
Category grades
Schools grade is shown separately in the Schools card above.
Census & demographics
- Census place
- Wildwood, MO
- City population
- 35,637
- Population (ZIP)
- 8,826
Population outlook (St. Louis County) Hauer SSP2
- Today (2025)
- 1,025,227 people
- By 2030
- 1,028,023 · +0.3%
- By 2040
- 1,020,940 · -0.4%
- By 2050
- 1,007,280 · -1.8%
- By 2075
- 987,277 · -3.7%
- By 2100
- 921,984 · -10.1%
Race, ethnicity, and origin ACS 2023
- Neighborhood character
- Predominantly White (78%)
- Race & ethnicity
- White 78% Two or more races 13% Hispanic / Latino 7% Asian 5%
- Hispanic origin (detail)
- Mexican 4%
- Common ancestry
- Lithuanian 4% Romanian 4% Scotch-Irish 1%
- Foreign-born
- 6% · Canada, China
- Languages at home
- 89% English-only · Spanish 5% Other Asian/Pacific 1% Tagalog/Filipino 1%
Political lean MEDSL · St. Louis
- 2024 margin
- Strong D (+23.4) · D 60.8% · R 37.4% · Other 1.7%
- 2008→2024 swing
- +3.5pp toward D · 2008: 19.9pp · 2024: 23.4pp
- All cycles
- 2024: D+23.4 2020: D+24.0 2016: D+16.2 2012: D+13.7 2008: D+19.9
Not yet ingested
- Civics
- —
Market trends
- HPI YoY
- ▼ -31.73%
- Current HPI
- 218.5648
- Rent YoY
- —
- Metro
- —
- State GDP YoY
- ▲ 1.84%
- F500 in state
- 20
Industry mix (Fortune 500 HQ in MO)
| Industry | F500 HQs | Revenue |
|---|---|---|
| Healthcare | 1 | $163B |
|
||
| Insurance | 1 | $21B |
|
||
| Industrial Technology | 1 | $17B |
|
||
| Retail | 1 | $16B |
|
||
| Industrial Distribution | 1 | $10B |
|
||
| Utilities | 1 | $9B |
|
||
Price history
+223.2% since first listed6 events — show timeline
- 2026-06-12 Sold (MLS) — MARIS as Distributed by MLS Grid
- 2026-05-15 Pending — MARIS as Distributed by MLS Grid
- 2026-05-08 Listed $160,000 MARIS as Distributed by MLS Grid
- 2026-05-06 Coming Soon $160,000 MARIS as Distributed by MLS Grid
- 1999-09-30 Sold (Public Records) $75,000 Public Records
- 1993-02-24 Sold (Public Records) $49,500 Public Records
Property tax history
+2.3%/yrLatest (2022): $1,496 · +0.7% YoY. Source: county tax records.
Cash-flow waterfall
monthlySold comps — $/sqft
last 12 mo · ≤1 miLoading sold comps…