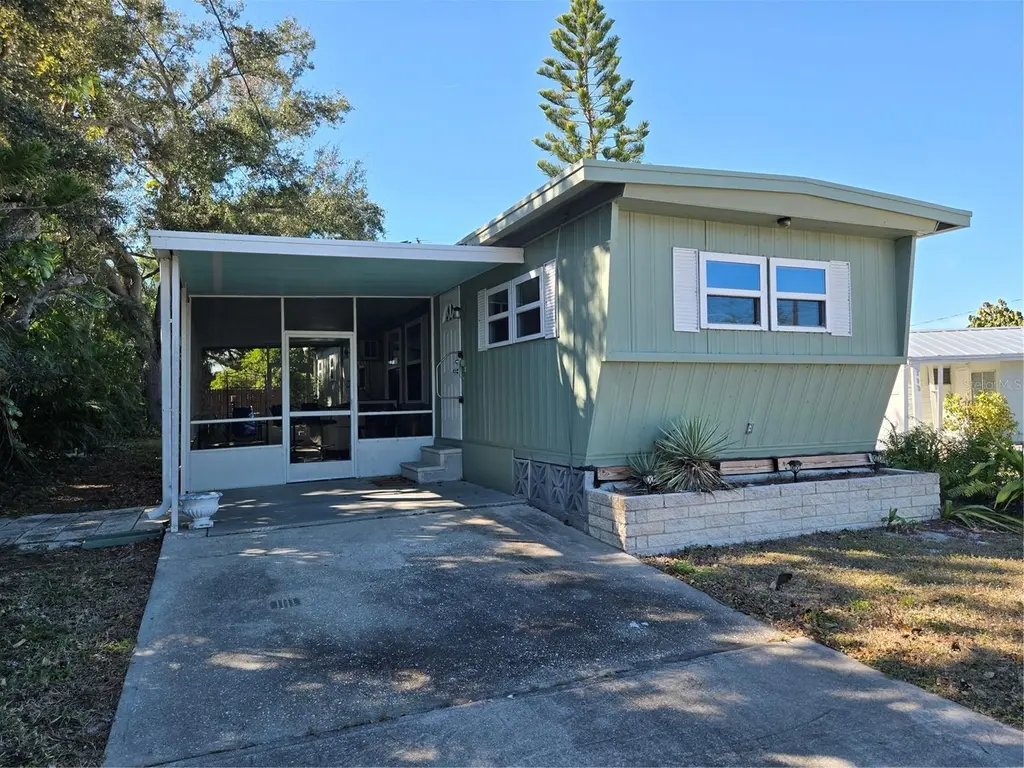
113 Ravenna St N · Nokomis, FL
Flood risk 5/10 · Moderate
- FEMA flood zone
- X (shaded)
- Chance of flooding over 30 yrs
- 0.23%
- Est. flood insurance / yr
- $507 – $1,088
Fire risk 1/10 · Minimal
- Est. fire insurance / yr
- $947 – $1,759
Heat risk 10/10 · Severe
- Hot days now (above 108°F)
- 7 days/yr
- Hot days in 30 yrs
- 28 days/yr
Wind risk 10/10 · Severe
- Chance of severe wind over 30 yrs
- 99.0%
Air-quality risk 2/10 · Minimal
- Unhealthy air days now
- 1 days/yr
- Unhealthy air days in 30 yrs
- 1 days/yr
Risk factors via First Street. Map © Google.
Why this score? — see what drove the C- grade
The composite is a weighted blend of 9 inputs, each scored 0–100. Each bar is that input's sub-score; the figure is the points it added to the 100-point composite (weight × sub-score).
- Cash flow +21.5/30.0
- ARV discount +7.5/15.0
- DSCR +6.9/10.0
- Schools +5.4/10.0
- 1% rule +5.0/10.0
- Livability +3.6/5.0
- Condition / age +2.5/5.0
- Rent growth +1.5/5.0
- Appreciation +0.0/10.0
$158,000
🖨 Deal sheet 📄 Offer letter ✓ Due diligence
Listing remarks MLS
Newly updated home being offered furnished. Own your own land with no HOA, not in a flood zone. Updates include A/C, water heater, flooring, windows and doors. Also has County water. Nice lot and large screened lanai. Just minutes to golf, shopping, restaurants, easy access to HWY 75, the new hospital. .. .only 2.4 miles to Historic downtown Venice and 3.5 Venice beach and 3 miles to Nokomis Beach. Several parks close by with hiking trails and a short distance to the Legacy Trail. Schedule your private showing today.
Key facts
- Own your own land
- County water
- Not in a flood zone
Tags
Neighborhood map
What this means for you Summary
Snapshot
- This is a 2-bed/2.0-bath manufactured listed at $158k.
Deal economics
- At list price, monthly cash flow is $237 ($3k/yr) — positive.
- The deal already cash-flows at list — no discount required.
- To meet the 1% rule (rent ≥ 1% of price), the offer needs to be $158k (0.2% below list).
- Recommended offer: $139k (12.0% below list) — sets the bar for market timing.
Location & tenants
- Location reads 72/100 on livability (#347 in FL) — a middle-class / working-renter tenant base. Strengths: crime A+, cost of living A+, housing A+; Watch: employment C-, amenities F, commute F.
- Sarasota (urban): math 63% / reading 63% proficiency, ranked #7 of 73 in FL (top 10%) — acceptable for families but not a draw, mixed tenant base, ~2y average lease.
- Market conditions: Rents falling (-4.0%/yr); 751 active listings in the ZIP; solid renter incomes; 7,466 units permitted in Sarasota County in 2024 (2,138 in 5+ unit buildings).
Forward outlook
- Local home prices are declining (-3.0%/yr); year-one equity from $1k of loan paydown is wiped out by about $5k of value loss. Plan a longer hold.
- Sarasota County population projected at +20% by 2050 — long-run rental-demand tailwind backs the buy-and-hold thesis.
Negotiation context
- It's been on market 148 days — a 12% lower offer ($139k) is reasonable based on typical stale-listing flexibility.
- 3 sale attempts since 2y ago with the ask held roughly flat each time — persistent listings suggest the price (not the market) is what's stuck; bring a comps-based counter.
- Current owner paid $70k; list at $158k implies a 126% gain — meaningful room to come down on a strong offer.
Risks & watch-outs
- Climate carrying-cost: moderate flood risk; severe wind risk, 99% chance of damaging wind over 30y; extreme-heat days projected 7→28/yr by 2055 (HVAC capex compounding) — expect insurance premiums to compound above CPI over the hold.
Questions for the listing agent
- It's been on market 148 days. Have you received any prior offers? Is the seller open to a 12% concession, seller financing, or rate buy-down credit?
- Built in 1970 — when were the roof, HVAC, electrical panel, plumbing, and water heater last replaced?
- Why hasn't it sold? Are there any deal-killer items the seller is aware of (foundation, flood, title, zoning, code violations)?
- Is there a deadline driving the sale (1031 exchange, divorce, estate, relocation)? That informs how much negotiation room exists.
- Schools are B-rated — typically a magnet for longer-tenancy family renters. What's the average tenant stay here, and is there a school-zone premium baked into asking?
- What's the average days-on-market for RENTAL listings here right now (not sales)? A rising rental-DOM trend means longer vacancies and softer asking-rent achievability than the comps imply.
- What's the recent tenant-quality profile in this submarket — average credit score on applications, eviction rate, late-payment / NSF rate, and stable-employment percentage? A property-management company in the area should have these aggregated.
- How much new for-sale + rental construction is in the pipeline within 1–3 miles? Heavy new supply typically softens prices + rents 12–24 months out; constrained supply supports both.
Investment metrics
- 1% rule
- 1.00% ✗
- Cap rate
- 8.09%
- Cash-on-cash
- 6.42%
- DSCR
- 1.29
- GRM
- 8.4
CMA / ARV
No comps found within radius.
Projected returns pro-forma
-3.0% appreciation · 0.0% rent growth · sell at horizon
- IRR
- -9.7%
- Equity multiple
- 0.66×
- Total profit
- $-15,184
- Equity at exit
- $23,558
- IRR
- -4.6%
- Equity multiple
- 0.73×
- Total profit
- $-11,788
- Equity at exit
- $13,661
Cash invested: $44,240 (down + closing). Projections, not guarantees.
Landlord ↔ Tenant lean methodology
- Overall (STATE)
- 87 Strongly Landlord-Friendly
- State Florida
- 87 Strongly Landlord-Friendly · R+3
- County
- — inherits STATE
- City
- — inherits STATE
ZIP-level market 34275
- Rents YoY
- -4.0%
- Active inventory
- 751
- Price-to-rent
- 8.4×
Monthly cashflow live
- Estimated rent
- $1,577 medium interval (Pro) →
- Mortgage (P&I)
- −$829
- Tax from tax record
- −$115 /mo · $1,376/yr
- Insurance
- −$66
- HOA
- −$0
- Vacancy / Maint / Mgmt
- −$331
- Net cashflow
- $237
Break-even live
UW: 25.0% down · 7.5% · 30yr · 1.5% tax · 5.0% vac · 8.0% maint · 8.0% mgmt
Financing live
Cash to close
- Down payment
- $39,500
- Closing costs
- $4,740
- Reserves months
- —
- Total cash needed
- —
Loan-product check · same deal, 3 products live
Conventional
25% down · 7.5% · 30yr
- Down + closing
- —
- Monthly P&I
- —
- Monthly cashflow
- —
- DSCR
- —
- Eligible?
- —
Personal DTI + credit; lowest rate.
DSCR
20% down · 8.5% · 30yr
- Down + closing
- —
- Monthly P&I
- —
- Monthly cashflow
- —
- DSCR
- —
- Eligible?
- —
No personal income docs; deal must DSCR.
Hard money
10% down · 12.0% · 12mo
- Down + closing
- —
- Monthly P&I
- —
- Monthly cashflow
- —
- DSCR
- —
- Eligible?
- —
Short-term bridge; refi at stabilization.
Listing history 27 events
-
2026-06-18days on market $158,000 Active 148 DOM
-
2026-06-17days on market $158,000 Active 147 DOM
-
2026-06-16days on market $158,000 Active 146 DOM
-
2026-06-15days on market $158,000 Active 145 DOM
-
2026-06-13days on market $158,000 Active 143 DOM
-
2026-06-13days on market $158,000 Active 142 DOM
-
2026-06-10days on market $158,000 Active 140 DOM
-
2026-06-09days on market $158,000 Active 139 DOM
-
2026-06-08days on market $158,000 Active 138 DOM
-
2026-06-08days on market $158,000 Active 137 DOM
-
2026-06-05days on market $158,000 Active 134 DOM
-
2026-06-03days on market $158,000 Active 133 DOM
-
2026-06-02days on market $158,000 Active 132 DOM
-
2026-06-01days on market $158,000 Active 131 DOM
-
2026-05-31days on market $158,000 Active 130 DOM
-
2026-01-22$158,000 Active 522-char remark
Show marketing remark (522 chars)
Newly updated home being offered furnished. Own your own land with no HOA, not in a flood zone. Updates include A/C, water heater, flooring, windows and doors. Also has County water. Nice lot and large screened lanai. Just minutes to golf, shopping, restaurants, easy access to HWY 75, the new hospital. .. .only 2.4 miles to Historic downtown Venice and 3.5 Venice beach and 3 miles to Nokomis Beach. Several parks close by with hiking trails and a short distance to the Legacy Trail. Schedule your private showing today.
-
2025-02-24status Pending
-
2025-02-24historical
-
2025-01-05price $157,000
-
2024-12-10price $165,000
-
2024-12-07$175,000 Active
-
2024-05-01historical
-
2024-02-19price $187,900
-
2024-02-06$197,500 Active
-
2021-04-15soldstatus $70,000
-
2005-01-24soldstatus $51,000
-
1981-10-01soldstatus $23,500
ⓘ Source: listings_history table (triggers on properties + properties_extension) + one-shot
backfill from property_details.listing_events for pre-trigger history.
Tax reassessment forecast FL · Resets to sale price
- Current annual tax
- $1,376 · $115/mo
- Projected year-2 tax
- $1,376 · $115/mo
- Expected delta
- $0/yr ($0/mo · -0.0%)
ⓘ Screening estimate from a state-policy table — verify with the county assessor before closing.
Climate risk First Street
- Flood 5/10 Major FEMA zone X (shaded) · 23% chance over 30 yrs
- Wildfire 1/10 Low
- Heat 10/10 Extreme 7 d/yr ≥108°F today · 28 d/yr by 30 yrs out
- Wind 10/10 Extreme 99% chance of damaging wind over 30 yrs
- Air quality 2/10 Low 1 unhealthy d/yr today · 1 by 30 yrs out
Nearby sold comps map
Loading sold comps map…
Walkable amenities ~0.75 mi
Loading nearby amenities…
Taxation est. · year 1
- Rental income
- $18,921
- − Mortgage interest
- −$8,850
- − Property taxes
- −$1,376
- − Insurance
- −$790
- − Repairs & maintenance
- −$1,514
- − Management
- −$1,514
- − Depreciation
- −$4,596
- Taxable income
- $281
- Est. tax owed @ 24.0%
- −$67
- After-tax cash flow
- $2,771/yr
For passive investors: Depreciation is non-cash, so a rental often shows a tax loss while cash-flowing — sheltering income. Rental losses are passive: they offset passive income freely, and up to $25,000/yr can offset ordinary (W-2) income if you actively participate and your MAGI is under $100k (phasing out to $0 by $150k); unused losses carry forward. On sale, claimed depreciation is recaptured at up to 25%, and gains may owe capital-gains tax (a 1031 exchange can defer both). Figures are a year-1 estimate at your 24.0% rate — not tax advice; consult a CPA.
Schools (NCES district)
- District
- Sarasota
- NCES district ID
- 1201680
- Math proficiency
- 63% ▼ -8.00%
- Reading proficiency
- 63% ▼ -3.00%
- Median HH income
- $51,167
- Composite
- 53.68/100
- National rank
- #1428
- State rank
- #7 of 73 in FL
Livability — Nokomis
- Score
- 72/100
- State rank
- #347
- US rank
- #6005
Category grades
Schools grade is shown separately in the Schools card above.
Census & demographics
- Census place
- Nokomis, FL
- County
- Sarasota County · 448,376 people
- City population
- 22,436
- Metro
- North Port-Sarasota-Bradenton, FL
- Population (ZIP)
- 22,436
- Household income
- $89,369
- Rent vs Own
- Severe rent burden
- 338.0
Population outlook (Sarasota County) Hauer SSP2
- Today (2025)
- 452,380 people
- By 2030
- 474,175 · +4.8%
- By 2040
- 511,577 · +13.1%
- By 2050
- 541,467 · +19.7%
- By 2075
- 604,947 · +33.7%
- By 2100
- 621,965 · +37.5%
Race, ethnicity, and origin ACS 2023
- Neighborhood character
- Predominantly White (85%)
- Race & ethnicity
- White 85% Two or more races 7% Hispanic / Latino 4% Asian 3% Black 1%
- Common ancestry
- Lithuanian 6% Romanian 4% Iranian 2%
- Foreign-born
- 12% · Canada, Vietnam, China
- Languages at home
- 89% English-only · Spanish 3% Russian/Polish/Slavic 2% French/Haitian/Cajun 2%
Political lean MEDSL · Sarasota
- 2024 margin
- R (+18.2) · D 40.5% · R 58.7%
- 2008→2024 swing
- -18.1pp toward R · 2008: -0.1pp · 2024: -18.2pp
- All cycles
- 2024: R+18.2 2020: R+10.4 2016: R+11.6 2012: R+7.4 2008: R+0.1
Not yet ingested
- Civics
- —
Market trends
- HPI YoY
- ▼ -329.70%
- Current HPI
- 268.9918
- Rent YoY
- ▼ -3.97%
- Metro
- North Port-Sarasota-Bradenton, FL
- State GDP YoY
- ▲ 3.28%
- F500 in state
- 36
Industry mix (Fortune 500 HQ in FL)
| Industry | F500 HQs | Revenue |
|---|---|---|
| Industrial Technology | 2 | $29B |
|
||
| Insurance | 2 | $17B |
|
||
| Retail | 1 | $60B |
|
||
| Technology Distribution | 1 | $58B |
|
||
| Homebuilding | 1 | $35B |
|
||
| Technology Manufacturing | 1 | $35B |
|
||
Price history
+572.3% since first listed12 events — show timeline
- 2026-01-22 Listed $158,000 Stellar MLS as Distributed by MLS Grid
- 2025-02-24 Pending — Stellar MLS as Distributed by MLS Grid
- 2025-02-24 Listing Removed — Stellar MLS as Distributed by MLS Grid
- 2025-01-05 Price Changed $157,000 Stellar MLS as Distributed by MLS Grid
- 2024-12-10 Price Changed $165,000 Stellar MLS as Distributed by MLS Grid
- 2024-12-07 Listed $175,000 Stellar MLS as Distributed by MLS Grid
- 2024-05-01 Listing Removed — Stellar MLS as Distributed by MLS Grid
- 2024-02-19 Price Changed $187,900 Stellar MLS as Distributed by MLS Grid
- 2024-02-06 Listed $197,500 Stellar MLS as Distributed by MLS Grid
- 2021-04-15 Sold (Public Records) $70,000 Public Records
- 2005-01-24 Sold (Public Records) $51,000 Public Records
- 1981-10-01 Sold (Public Records) $23,500 Public Records
Property tax history
+2.2%/yrLatest (2025): $1,376 · +2.9% YoY. Source: county tax records.
Cash-flow waterfall
monthlySold comps — $/sqft
last 12 mo · ≤1 miLoading sold comps…