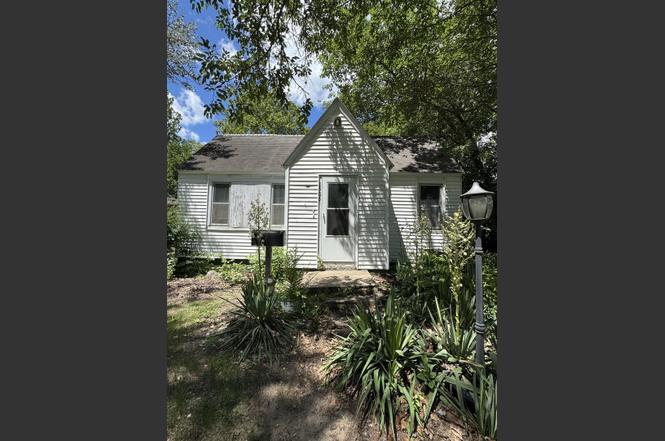
1506 10th Ave · Rock Falls, IL
Flood risk 1/10 · Minimal
- FEMA flood zone
- X (unshaded)
- Chance of flooding over 30 yrs
- 0.0%
- Est. flood insurance / yr
- $473 – $860
Fire risk 1/10 · Minimal
- Est. fire insurance / yr
- $804 – $1,492
Heat risk 3/10 · Minor
- Hot days now (above 103°F)
- 7 days/yr
- Hot days in 30 yrs
- 16 days/yr
Wind risk 2/10 · Minimal
- Chance of severe wind over 30 yrs
- —
Air-quality risk 3/10 · Minor
- Unhealthy air days now
- 2 days/yr
- Unhealthy air days in 30 yrs
- 3 days/yr
Risk factors via First Street. Map © Google.
Why this score? — see what drove the B- grade
The composite is a weighted blend of 9 inputs, each scored 0–100. Each bar is that input's sub-score; the figure is the points it added to the 100-point composite (weight × sub-score).
- Cash flow +30.0/30.0
- 1% rule +10.0/10.0
- DSCR +10.0/10.0
- ARV discount +7.5/15.0
- Livability +3.2/5.0
- Rent growth +2.5/5.0
- Condition / age +2.5/5.0
- Schools +2.0/10.0
- Appreciation +0.0/10.0
$48,000
🖨 Deal sheet (PDF) 📄 Offer letter ✓ Due diligence
Listing remarks
Calling all Investors, the 4 bedroom 1 bath house in Rock Falls is your next project. One single owner, a family home. Furnace is 5 years old. Roof is was done in 2009, no active leaks or issues with the roof. Bathroom updated with first floor laundry hook up. Property being sold AS-IS. Must have proof of funds or proof of construction loan.
Key facts
- Furnace 5 years old
- Roof done in 2009
- Bathroom updated
Tags
Property features AI
Finance
- Other: Lot less than 0.25 acre; Lot dimensions recorded as 10,454; Directions: West on 30, turn left onto 10th Ave; house on the right
- HOA & community: No master association fee required
Exterior
- Parking: One parking space
- Utilities: Public water; Public sewer; Natural gas available
- Home design: Detached single-family home; 1.5-story layout; Fee simple ownership
- Construction: Vinyl siding; Built approximately 81–90 years ago; Built before 1978
- Exterior features: School bus service
Interior
- Kitchen: Kitchen on main level (13 x 12)
- Bedrooms: Four bedrooms total; Master bedroom on main level (12 x 11); Bedroom on main level (11 x 10); Two bedrooms on second level (each 13 x 11)
- Bathrooms: One full bathroom
- Heating & cooling: Natural gas heating
- Interior features: Seven total rooms; Unfinished partial basement
- Laundry & utility: Dedicated laundry room
Neighborhood map
What this means for you Summary
Snapshot
- This is a 4-bed/1.0-bath other listed at $48k.
Deal economics
- At list price, monthly cash flow is $717 ($9k/yr) — positive.
- The deal already cash-flows at list — no discount required.
- Meets the 1% rule at list price ($1k rent vs $48k).
- Cap rate 24.2% vs local median 4.9% in Rock Falls — top-decile yield for the area; either an underpriced asset or a hidden risk that comps aren't pricing in. Stress-test before assuming the spread holds.
Location & tenants
- Location reads 65/100 on livability (#607 in IL) — a middle-class / working-renter tenant base. Strengths: cost of living A+, housing A, health & safety B; Watch: schools F, crime F, amenities F.
- Rock Falls Twp Hsd 301 (town): math 10% / reading 30% proficiency, ranked #726 of 919 in IL (top 79%) — low school quality limits family demand, transient renter base, plan for 1-2y turnover.
- Market conditions: 43 active listings in the ZIP; 19 units permitted in Whiteside County in 2024 (0 in 5+ unit buildings).
Forward outlook
- Local home prices are declining (-3.0%/yr); year-one equity from $332 of loan paydown is wiped out by about $1k of value loss. Plan a longer hold.
- Whiteside County population projected at -21% by 2050 — secular population decline; favor cash flow + early exit over multi-decade hold.
- At projected returns (-3.0% appreciation + 3.0% rent growth), your $13k cash investment doubles in ~2 years — after that, you're playing with house money.
Negotiation context
- Only 4 days on market — expect competitive offers; lowballing is unlikely to land.
Risks & watch-outs
- Watch-outs: built in 1940 — expect roof / HVAC / electrical / plumbing capex.
Questions for the listing agent
- Built in 1940 — when were the roof, HVAC, electrical panel, plumbing, and water heater last replaced?
- Is there a deadline driving the sale (1031 exchange, divorce, estate, relocation)? That informs how much negotiation room exists.
- Schools are F-rated, which usually means shorter tenancies and higher turnover. Who's the typical renter profile here, and what's been the actual vacancy rate?
- Crime grade is F in this area — have there been break-ins, vandalism, or insurance claims at this property in the last 3 years? What carrier currently insures it and at what premium?
- What's the average days-on-market for RENTAL listings here right now (not sales)? A rising rental-DOM trend means longer vacancies and softer asking-rent achievability than the comps imply.
- What's the recent tenant-quality profile in this submarket — average credit score on applications, eviction rate, late-payment / NSF rate, and stable-employment percentage? A property-management company in the area should have these aggregated.
- How much new for-sale + rental construction is in the pipeline within 1–3 miles? Heavy new supply typically softens prices + rents 12–24 months out; constrained supply supports both.
Investment metrics
- 1% rule
- 2.77% ✓
- Cap rate
- 24.23%
- Cash-on-cash
- 64.06%
- DSCR
- 3.85
- GRM
- 3.0
CMA / ARV
No comps found within radius.
Projected returns pro-forma
-3.0% appreciation · 3.0% rent growth · sell at horizon
- IRR
- 63.1%
- Equity multiple
- 3.82×
- Total profit
- $37,935
- Equity at exit
- $7,157
- IRR
- 67.6%
- Equity multiple
- 7.84×
- Total profit
- $91,951
- Equity at exit
- $4,150
Cash invested: $13,440 (down + closing). Projections, not guarantees.
Landlord ↔ Tenant lean methodology
- Overall (STATE)
- 43 Moderately Tenant-Leaning
- State Illinois
- 43 Moderately Tenant-Leaning · D+7
- County
- — inherits STATE
- City
- — inherits STATE
ZIP-level market 61071
- Home prices YoY
- -33.5%
- Active inventory
- 43
- Price-to-rent
- 3.0×
Monthly cashflow live
- Estimated rent
- $1,328 medium interval (Pro) →
- Mortgage (P&I)
- −$252
- Tax est. 1.5%
- −$60 /mo · $720/yr
- Insurance
- −$20
- HOA
- −$0
- Vacancy / Maint / Mgmt
- −$279
- Net cashflow
- $717
Break-even live
Sensitivity live
| Price | -10% $751 | -5% $734 | +0% $717 | +5% $701 | +10% $684 |
|---|---|---|---|---|---|
| Rent | -10% $613 | -5% $665 | +0% $717 | +5% $770 | +10% $822 |
| Rate | -1.0pp $742 | -0.5pp $730 | base $717 | +0.5pp $705 | +1.0pp $692 |
UW: 25.0% down · 7.5% · 30yr · 1.5% tax · 5.0% vac · 8.0% maint · 8.0% mgmt
Financing live
Cash to close
- Down payment
- $12,000
- Closing costs
- $1,440
- Reserves months
- —
- Total cash needed
- —
Loan-product check · same deal, 3 products live
Conventional
25% down · 7.5% · 30yr
- Down + closing
- —
- Monthly P&I
- —
- Monthly cashflow
- —
- DSCR
- —
- Eligible?
- —
Personal DTI + credit; lowest rate.
DSCR
20% down · 8.5% · 30yr
- Down + closing
- —
- Monthly P&I
- —
- Monthly cashflow
- —
- DSCR
- —
- Eligible?
- —
No personal income docs; deal must DSCR.
Hard money
10% down · 12.0% · 12mo
- Down + closing
- —
- Monthly P&I
- —
- Monthly cashflow
- —
- DSCR
- —
- Eligible?
- —
Short-term bridge; refi at stabilization.
Listing history 4 events
-
2026-06-21days on market $48,000 Active 4 DOM
-
2026-06-18days on market $48,000 Active 2 DOM
-
2026-06-17remarks 343-char remark
-
2026-06-17$48,000 Active 1 DOM
ⓘ Source: listings_history table (triggers on properties + properties_extension) + one-shot
backfill from property_details.listing_events for pre-trigger history.
Climate risk First Street
- Flood 1/10 Low FEMA zone X (unshaded) · 0% chance over 30 yrs
- Wildfire 1/10 Low
- Heat 3/10 Moderate 7 d/yr ≥103°F today · 16 d/yr by 30 yrs out
- Wind 2/10 Low
- Air quality 3/10 Moderate 2 unhealthy d/yr today · 3 by 30 yrs out
Nearby sold comps map
Loading sold comps map…
Walkable amenities ~0.75 mi
Loading nearby amenities…
Taxation est. · year 1
- Rental income
- $15,936
- − Mortgage interest
- −$2,689
- − Property taxes
- −$720
- − Insurance
- −$240
- − Repairs & maintenance
- −$1,275
- − Management
- −$1,275
- − Depreciation
- −$1,396
- Taxable income
- $8,341
- Est. tax owed @ 24.0%
- −$2,002
- After-tax cash flow
- $6,607/yr
For passive investors: Depreciation is non-cash, so a rental often shows a tax loss while cash-flowing — sheltering income. Rental losses are passive: they offset passive income freely, and up to $25,000/yr can offset ordinary (W-2) income if you actively participate and your MAGI is under $100k (phasing out to $0 by $150k); unused losses carry forward. On sale, claimed depreciation is recaptured at up to 25%, and gains may owe capital-gains tax (a 1031 exchange can defer both). Figures are a year-1 estimate at your 24.0% rate — not tax advice; consult a CPA.
Schools (NCES district)
- District
- Rock Falls Twp Hsd 301
- NCES district ID
- 1734380
- Math proficiency
- 10% ▼ -5.00%
- Reading proficiency
- 30% ▬ 0.00%
- Median HH income
- $36,851
- Composite
- 19.86/100
- National rank
- #13891
- State rank
- #726 of 919 in IL
Livability — Rock Falls
- Score
- 65/100
- State rank
- #607
- US rank
- #12541
Category grades
Schools grade is shown separately in the Schools card above.
Census & demographics
- Census place
- Rock Falls, IL
- Population (ZIP)
- 13,482
Population outlook (Whiteside County) Hauer SSP2
- Today (2025)
- 53,736 people
- By 2030
- 51,657 · -3.9%
- By 2040
- 47,169 · -12.2%
- By 2050
- 42,613 · -20.7%
- By 2075
- 32,691 · -39.2%
- By 2100
- 22,638 · -57.9%
Race, ethnicity, and origin ACS 2023
- Neighborhood character
- Predominantly White (81%)
- Race & ethnicity
- White 81% Hispanic / Latino 16% Two or more races 9%
- Hispanic origin (detail)
- Mexican 12% Puerto Rican 3%
- Common ancestry
- Iranian 3% Romanian 3% Lithuanian 2%
- Foreign-born
- 3% · Canada
- Languages at home
- 90% English-only · Spanish 9%
Political lean MEDSL · Whiteside
- 2024 margin
- R (+14.7) · D 41.7% · R 56.4% · Other 2.0%
- 2008→2024 swing
- -32.3pp toward R · 2008: 17.6pp · 2024: -14.7pp
- All cycles
- 2024: R+14.7 2020: R+8.3 2016: R+6.3 2012: D+17.3 2008: D+17.6
Not yet ingested
- Civics
- —
Market trends
- HPI YoY
- ▼ -71.37%
- Current HPI
- 142.0179
- Rent YoY
- —
- Metro
- —
- State GDP YoY
- ▲ 1.59%
- F500 in state
- 60
Industry mix (Fortune 500 HQ in IL)
| Industry | F500 HQs | Revenue |
|---|---|---|
| Insurance | 4 | $201B |
|
||
| Consumer Goods | 4 | $87B |
|
||
| Industrial Machinery | 3 | $64B |
|
||
| Healthcare | 2 | $55B |
|
||
| Retail / Pharmacy | 1 | $148B |
|
||
| Agriculture / Food | 1 | $86B |
|
||
Price history
1 event — show timeline
- 2026-06-16 Listed $48,000 MRED as Distributed by MLS Grid
Property tax history
+2.7%/yrLatest (2024): $2,934 · +6.0% YoY. Source: county tax records.
Cash-flow waterfall
monthlySold comps — $/sqft
last 12 mo · ≤1 miLoading sold comps…