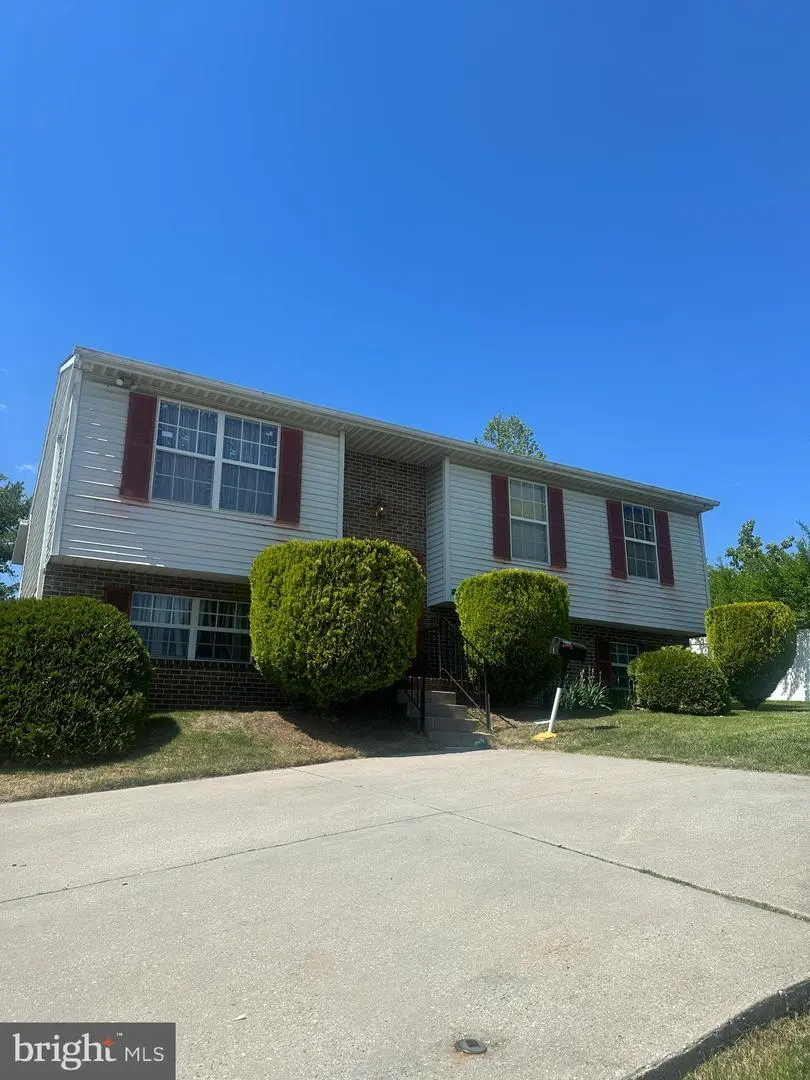
1918 Summit Ave · Woodlawn, MD
Flood risk 1/10 · Minimal
- FEMA flood zone
- X (unshaded)
- Chance of flooding over 30 yrs
- 0.0%
- Est. flood insurance / yr
- $473 – $860
Fire risk 1/10 · Minimal
- Est. fire insurance / yr
- $755 – $1,403
Heat risk 7/10 · Major
- Hot days now (above 104°F)
- 7 days/yr
- Hot days in 30 yrs
- 15 days/yr
Wind risk 4/10 · Minor
- Chance of severe wind over 30 yrs
- 20.0%
Air-quality risk 3/10 · Minor
- Unhealthy air days now
- 3 days/yr
- Unhealthy air days in 30 yrs
- 4 days/yr
Risk factors via First Street. Map © Google.
Why this score? — see what drove the C+ grade
The composite is a weighted blend of 9 inputs, each scored 0–100. Each bar is that input's sub-score; the figure is the points it added to the 100-point composite (weight × sub-score).
- Cash flow +17.3/30.0
- ARV discount +15.0/15.0
- Appreciation +9.8/10.0
- DSCR +5.4/10.0
- 1% rule +4.7/10.0
- Livability +3.9/5.0
- Rent growth +3.8/5.0
- Condition / age +2.5/5.0
- Schools +2.3/10.0
$200,000
🖨 Deal sheet 📄 Offer letter ✓ Due diligence
Listing remarks
coming soon
Key facts
- 5,706 sq ft lot
- 3 parking spots
- Built 1983
Property features AI
Finance
- Other:
- Financial info:
- HOA & community:
Exterior
- Parking: Three driveway parking spaces (total of 3 garage and parking spaces)
- Security:
- Utilities: Public water; Public sewer; Electric service
- Home design: Detached property; Fee simple ownership
- Construction: Brick construction; Permanent foundation; Above-grade structure
- Exterior features: Concrete driveway
Interior
- Kitchen:
- Bedrooms: Three bedrooms on the main level
- Flooring:
- Bathrooms: One full bathroom; One half bathroom on the lower level
- Heating & cooling: Heat pump heating; Central air conditioning; Electric hot water
- Interior features: Daylight, partially finished basement with connecting stairway
- Laundry & utility:
Neighborhood map
What this means for you Summary
Snapshot
- This is a 3-bed/1.5-bath single-family listed at $200k.
Deal economics
- At list price, monthly cash flow is $146 ($2k/yr) — positive.
- The deal already cash-flows at list — no discount required.
- To meet the 1% rule (rent ≥ 1% of price), the offer needs to be $195k (2.6% below list).
- Recommended offer: $195k (2.6% below list) — sets the bar for 1% rule.
- Cap rate 7.2% vs local median 4.3% in Woodlawn — top-decile yield for the area; either an underpriced asset or a hidden risk that comps aren't pricing in. Stress-test before assuming the spread holds.
Location & tenants
- Location reads 77/100 on livability (#78 in MD, #2,926 nationally) — a middle-class / working-renter tenant base. Strengths: commute A+, housing A+, employment A-; Watch: amenities D+, crime F.
- Baltimore County Public Schools (suburban): math 15% / reading 34% proficiency, ranked #11 of 24 in MD (top 46%) — low school quality limits family demand, transient renter base, plan for 1-2y turnover.
- Market conditions: Rents rising fast (+5.2%/yr); 126 active listings in the ZIP; 7 comparable units currently listed for rent nearby; rentals at typical pace (median 18d on market — plan ~3-4 weeks tenant-placement turnaround); 43% of comp listings sitting > 30 days — soft ceiling on asking rent; 1,511 units permitted in Baltimore County in 2024 (643 in 5+ unit buildings).
- This rent runs 35% of the median local income ($67k/yr) — at the standard rent-burdened threshold; future hikes will face affordability resistance.
Forward outlook
- In year one you build about $20k of equity ($1k loan paydown + $19k appreciation (9.5% local appreciation)).
- Baltimore County population projected at +12% by 2050 — modest demand growth; plan on rents tracking national, not racing it.
- At projected returns (9.5% appreciation + 5.2% rent growth), your $56k cash investment doubles in ~3 years — after that, you're playing with house money.
- By year 2, paydown + projected appreciation supports a ~$33k cash-out refi (75% LTV) — recoverable capital for the next deal without selling this one.
Negotiation context
- Only 1 days on market — expect competitive offers; lowballing is unlikely to land.
- Current owner paid $85k; list at $200k implies a 135% gain — meaningful room to come down on a strong offer.
Risks & watch-outs
- Climate carrying-cost: extreme-heat days projected 7→15/yr by 2055 (HVAC capex compounding) — expect insurance premiums to compound above CPI over the hold.
Questions for the listing agent
- Is there a deadline driving the sale (1031 exchange, divorce, estate, relocation)? That informs how much negotiation room exists.
- Schools are B-rated — typically a magnet for longer-tenancy family renters. What's the average tenant stay here, and is there a school-zone premium baked into asking?
- Crime grade is F in this area — have there been break-ins, vandalism, or insurance claims at this property in the last 3 years? What carrier currently insures it and at what premium?
- What's the average days-on-market for RENTAL listings here right now (not sales)? A rising rental-DOM trend means longer vacancies and softer asking-rent achievability than the comps imply.
- What's the recent tenant-quality profile in this submarket — average credit score on applications, eviction rate, late-payment / NSF rate, and stable-employment percentage? A property-management company in the area should have these aggregated.
- How much new for-sale + rental construction is in the pipeline within 1–3 miles? Heavy new supply typically softens prices + rents 12–24 months out; constrained supply supports both.
Investment metrics
- 1% rule
- 0.97% ✗
- Cap rate
- 7.17%
- Cash-on-cash
- 3.12%
- DSCR
- 1.14
- GRM
- 8.6
CMA / ARV
- ARV (on-the-fly)
- $360,790
- Comps found
- 12
Show comp detail 12 sales within ~0.75 mi
| Address | Dist | Beds/Ba | Sqft | Sold | Price | $/sf | Match |
|---|---|---|---|---|---|---|---|
| 2003 Englewood Ave | 0.34mi | 3/2.0 | 1,658 (+0%) | 0mo | $350,000 | $211 | 82 |
| 1929 Englewood Ave | 0.30mi | 3/1.5 | 1,767 (+7%) | 6mo | $239,000 | $135 | 70 |
| 6408 Gilmore St | 0.34mi | 2/1.5 (-1) | 1,486 (-10%) | 2mo | $170,000 | $114 | 60 |
| 1836 Colmar Rd | 0.33mi | 3/3.0 | 1,727 (+4%) | 14mo | $405,000 | $235 | 60 |
| 2031 Englewood Ave | 0.45mi | 4/2.5 (+1) | 1,650 (-0%) | 14mo | $360,000 | $218 | 58 |
| 6621 Dogwood | 0.18mi | 3/1.0 | 1,416 (-14%) | 11mo | $330,000 | $233 | 56 |
| 6721 Valley Creek Dr | 0.52mi | 4/2.5 (+1) | 1,560 (-6%) | 13mo | $360,000 | $231 | 46 |
| 6725 Brookmont Dr | 0.60mi | 3/1.5 | 1,536 (-7%) | 17mo | $320,000 | $208 | 46 |
| 2203 Lukewood Dr | 0.68mi | 4/2.0 (+1) | 1,560 (-6%) | 10mo | $358,000 | $229 | 43 |
| 2129 Lawnwood Cir | 0.75mi | 4/3.0 (+1) | 1,600 (-3%) | 13mo | $405,000 | $253 | 38 |
| 11 Summerfield Rd | 0.65mi | 3/2.0 | 1,460 (-12%) | 14mo | $270,000 | $185 | 36 |
| 2817 Rona Rd | 0.69mi | 3/2.0 | 1,489 (-10%) | 15mo | $280,000 | $188 | 36 |
Match score weights: distance 35% · size 25% · config 20% · recency 20%. Top-matched comps best support the ARV.
Projected returns pro-forma
9.5% appreciation · 5.23% rent growth · sell at horizon
- IRR
- 26.4%
- Equity multiple
- 3.07×
- Total profit
- $115,886
- Equity at exit
- $172,922
- IRR
- 23.9%
- Equity multiple
- 7.11×
- Total profit
- $342,326
- Equity at exit
- $365,453
Cash invested: $56,000 (down + closing). Projections, not guarantees.
Landlord ↔ Tenant lean methodology
- Overall (STATE)
- 27 Tenant-Leaning
- State Maryland
- 27 Tenant-Leaning · D+14
- County
- — inherits STATE
- City
- — inherits STATE
ZIP-level market 21207
- Home prices YoY
- 1.1%
- Rents YoY
- 5.2%
- Active inventory
- 126
- Price-to-rent
- 8.6×
Monthly cashflow live
- Estimated rent
- $1,948 high interval (Pro) →
- Mortgage (P&I)
- −$1,049
- Tax from tax record
- −$261 /mo · $3,129/yr
- Insurance
- −$83
- HOA
- −$0
- Vacancy / Maint / Mgmt
- −$409
- Net cashflow
- $146
Break-even live
UW: 25.0% down · 7.5% · 30yr · 1.5% tax · 5.0% vac · 8.0% maint · 8.0% mgmt
Financing live
Cash to close
- Down payment
- $50,000
- Closing costs
- $6,000
- Reserves months
- —
- Total cash needed
- —
Loan-product check · same deal, 3 products live
Conventional
25% down · 7.5% · 30yr
- Down + closing
- —
- Monthly P&I
- —
- Monthly cashflow
- —
- DSCR
- —
- Eligible?
- —
Personal DTI + credit; lowest rate.
DSCR
20% down · 8.5% · 30yr
- Down + closing
- —
- Monthly P&I
- —
- Monthly cashflow
- —
- DSCR
- —
- Eligible?
- —
No personal income docs; deal must DSCR.
Hard money
10% down · 12.0% · 12mo
- Down + closing
- —
- Monthly P&I
- —
- Monthly cashflow
- —
- DSCR
- —
- Eligible?
- —
Short-term bridge; refi at stabilization.
Rent comps 7 comps
| Address | Beds | Baths | Sqft | Rent | $/sqft | DOM | Units | Dist |
|---|---|---|---|---|---|---|---|---|
| 6330 Windsor Mill Rd Woodlawn, MD | 3.0 | 1.0 | 1200 | $1,600 | $1.33 | 43d | 1 | 0.49mi |
| 6463 Woodgreen Cir Gwynn Oak, MD | 3.0 | 2.5 | 1230 | $1,900 | $1.54 | 18d | 1 | 0.86mi |
| 3101 Windsor Blvd Gwynn Oak, MD | 1.0–2.0 | 1.0–2.0 | 843 | $1,755 | $2.08 | 2d | 55 | 1.09mi |
| 2 Walden Birch Ct Woodlawn, MD | 3.0 | 1.5 | 1022 | $1,792 | $1.75 | 5d | 1 | 1.17mi |
| 6301 Linus Dr Gwynn Oak, MD | 4.0 | 3.0 | 1976 | $3,495 | $1.77 | 43d | 1 | 1.26mi |
| 2420 Bibury Ln Windsor Mill, MD | 1.0–3.0 | 1.0–2.0 | 979 | $2,060 | $2.10 | 2d | 76 | 1.39mi |
| 5533 Gwynn Oak Ave Fl 1 Gwynn Oak, MD | 2.0 | 1.0 | 1080 | $1,600 | $1.48 | 43d | 1 | 1.41mi |
Tax reassessment forecast MD · Partial reset (capped growth)
- Current annual tax
- $3,129 · $261/mo
- Projected year-2 tax
- $3,129 · $261/mo
- Expected delta
- $0/yr ($0/mo · 0.0%)
ⓘ Screening estimate from a state-policy table — verify with the county assessor before closing.
Climate risk First Street
- Flood 1/10 Low FEMA zone X (unshaded) · 0% chance over 30 yrs
- Wildfire 1/10 Low
- Heat 7/10 Severe 7 d/yr ≥104°F today · 15 d/yr by 30 yrs out
- Wind 4/10 Moderate 20% chance of damaging wind over 30 yrs
- Air quality 3/10 Moderate 3 unhealthy d/yr today · 4 by 30 yrs out
Nearby sold comps map
Loading sold comps map…
Walkable amenities ~0.75 mi
Loading nearby amenities…
Taxation est. · year 1
- Rental income
- $23,370
- − Mortgage interest
- −$11,203
- − Property taxes
- −$3,129
- − Insurance
- −$1,000
- − Repairs & maintenance
- −$1,870
- − Management
- −$1,870
- − Depreciation
- −$5,818
- Taxable loss
- −$1,519
- Est. tax savings @ 24.0%
- +$365
- After-tax cash flow
- $2,112/yr
For passive investors: Depreciation is non-cash, so a rental often shows a tax loss while cash-flowing — sheltering income. Rental losses are passive: they offset passive income freely, and up to $25,000/yr can offset ordinary (W-2) income if you actively participate and your MAGI is under $100k (phasing out to $0 by $150k); unused losses carry forward. On sale, claimed depreciation is recaptured at up to 25%, and gains may owe capital-gains tax (a 1031 exchange can defer both). Figures are a year-1 estimate at your 24.0% rate — not tax advice; consult a CPA.
Schools (NCES district)
- District
- Baltimore County Public Schools
- NCES district ID
- 2400120
- Math proficiency
- 15% ▼ -16.00%
- Reading proficiency
- 34% ▼ -5.00%
- Median HH income
- $66,746
- Composite
- 23.17/100
- National rank
- #7948
- State rank
- #11 of 24 in MD
Livability — Woodlawn
- Score
- 77/100
- State rank
- #78
- US rank
- #2926
Category grades
Schools grade is shown separately in the Schools card above.
Census & demographics
- Census place
- Woodlawn, MD
- County
- Baltimore County · 769,527 people
- City population
- 49,599
- Metro
- Baltimore-Columbia-Towson, MD
- Population (ZIP)
- 47,099
- Household income
- $67,060
- Rent vs Own
- Severe rent burden
- 2139.0
Population outlook (Baltimore County) Hauer SSP2
- Today (2025)
- 885,518 people
- By 2030
- 909,272 · +2.7%
- By 2040
- 951,547 · +7.5%
- By 2050
- 990,955 · +11.9%
- By 2075
- 1,086,411 · +22.7%
- By 2100
- 1,135,078 · +28.2%
Race, ethnicity, and origin ACS 2023
- Neighborhood character
- Predominantly Black (78%)
- Race & ethnicity
- Black 78% White 8% Hispanic / Latino 7% Two or more races 5% Asian 3%
- Hispanic origin (detail)
- Puerto Rican 1%
- Common ancestry
- Swedish 1%
- Foreign-born
- 13% · Canada, Philippines, South Korea
- Languages at home
- 86% English-only · Spanish 4% French/Haitian/Cajun 1% Other Asian/Pacific 1%
Political lean MEDSL · Baltimore
- 2024 margin
- Strong D (+24.5) · D 61.0% · R 36.5% · Other 2.5%
- 2008→2024 swing
- +9.9pp toward D · 2008: 14.6pp · 2024: 24.5pp
- All cycles
- 2024: D+24.5 2020: D+27.0 2016: D+17.4 2012: D+16.4 2008: D+14.6
Not yet ingested
- Civics
- —
Market trends
- HPI YoY
- ▲ 9.50%
- Current HPI
- 843.63
- Rent YoY
- ▲ 5.23%
- Metro
- Baltimore-Columbia-Towson, MD
- State GDP YoY
- ▲ 2.97%
- F500 in state
- 12
Industry mix (Fortune 500 HQ in MD)
| Industry | F500 HQs | Revenue |
|---|---|---|
| Aerospace / Defense | 1 | $71B |
|
||
| Utilities | 1 | $25B |
|
||
| Hotels | 1 | $24B |
|
||
| Consumer Goods | 1 | $7B |
|
||
| Real Estate | 1 | $6B |
|
||
| Chemicals | 1 | $2B |
|
||
Price history
+174.3% since first listed4 events — show timeline
- 2026-05-30 Pending — BRIGHT MLS
- 2026-05-29 Coming Soon $200,000 BRIGHT MLS
- 1987-12-15 Sold (Public Records) $85,000 Public Records
- 1985-07-26 Sold (Public Records) $72,900 Public Records
Property tax history
+1.2%/yrLatest (2025): $3,129 · +5.9% YoY. Source: county tax records.
Cash-flow waterfall
monthlySold comps — $/sqft
last 12 mo · ≤1 miLoading sold comps…