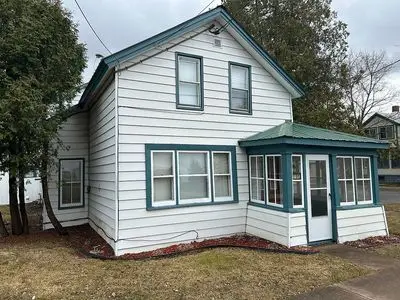
1701 Ford St · Ogdensburg, NY
Flood risk 1/10 · Minimal
- FEMA flood zone
- X
- Chance of flooding over 30 yrs
- 0.0%
- Est. flood insurance / yr
- $507 – $1,088
Fire risk 1/10 · Minimal
- Est. fire insurance / yr
- $691 – $1,283
Heat risk 2/10 · Minimal
- Hot days now (above 94°F)
- 7 days/yr
- Hot days in 30 yrs
- 15 days/yr
Wind risk 1/10 · Minimal
- Chance of severe wind over 30 yrs
- —
Air-quality risk 2/10 · Minimal
- Unhealthy air days now
- 1 days/yr
- Unhealthy air days in 30 yrs
- 1 days/yr
Risk factors via First Street. Map © Google.
Why this score? — see what drove the B- grade
The composite is a weighted blend of 9 inputs, each scored 0–100. Each bar is that input's sub-score; the figure is the points it added to the 100-point composite (weight × sub-score).
- Cash flow +30.0/30.0
- 1% rule +10.0/10.0
- DSCR +10.0/10.0
- Appreciation +5.5/10.0
- Schools +3.3/10.0
- Livability +3.3/5.0
- Rent growth +2.5/5.0
- Condition / age +2.5/5.0
- ARV discount +0.0/15.0
$67,500
🖨 Deal sheet 📄 Offer letter ✓ Due diligence
Listing remarks MLS
Classic corner-lot home offering space, character, and potential. This 3-bedroom, 2-bath property features an enclosed front porch, attached garage, paved driveway, and a separate workshop ideal for hobbies or storage. The home has an older interior, providing an excellent opportunity for updates and personalization while maintaining its traditional charm. Convenient corner-lot setting with mature surroundings and easy access. A solid option for buyers looking for value, function, and the chance to build equity.
Key facts
- Built 1900
Neighborhood map
What this means for you Summary
Snapshot
- This is a 3-bed/2.0-bath single-family listed at $68k.
Deal economics
- At list price, monthly cash flow is $345 ($4k/yr) — positive.
- The deal already cash-flows at list — no discount required.
- Meets the 1% rule at list price ($1k rent vs $68k).
- Cap rate 12.4% vs local median 5.3% in Ogdensburg — top-decile yield for the area; either an underpriced asset or a hidden risk that comps aren't pricing in. Stress-test before assuming the spread holds.
Location & tenants
- Location reads 66/100 on livability (#624 in NY) — a middle-class / working-renter tenant base. Strengths: cost of living A+, housing A+, health & safety A+; Watch: employment D+, schools D-, crime F.
- Ogdensburg City School District (town): math 34% / reading 46% proficiency, ranked #531 of 590 in NY (top 90%) — families likely to look elsewhere, expect single-tenant / working-renter base with shorter leases.
- Market conditions: 127 active listings in the ZIP; 215 units permitted in St. Lawrence County in 2024 (0 in 5+ unit buildings).
Forward outlook
- In year one you build about $1k of equity ($467 loan paydown + $720 appreciation (1.1% local appreciation)).
- St. Lawrence County population projected at -14% by 2050 — secular population decline; favor cash flow + early exit over multi-decade hold.
- At projected returns (1.1% appreciation + 3.0% rent growth), your $19k cash investment doubles in ~4 years — after that, you're playing with house money.
Negotiation context
- Only 0 days on market — expect competitive offers; lowballing is unlikely to land.
- 2 sale attempts with the ask held roughly flat each time — persistent listings suggest the price (not the market) is what's stuck; bring a comps-based counter.
- Current owner paid $45k; list at $68k implies a 50% gain — meaningful room to come down on a strong offer.
Risks & watch-outs
- Watch-outs: property tax is 4.1% of price; built in 1900 — expect roof / HVAC / electrical / plumbing capex.
Questions for the listing agent
- Built in 1900 — when were the roof, HVAC, electrical panel, plumbing, and water heater last replaced?
- Property tax is high relative to price — has the assessment been appealed recently, and will the sale trigger a re-assessment?
- Is there a deadline driving the sale (1031 exchange, divorce, estate, relocation)? That informs how much negotiation room exists.
- Schools are D-rated, which usually means shorter tenancies and higher turnover. Who's the typical renter profile here, and what's been the actual vacancy rate?
- Crime grade is F in this area — have there been break-ins, vandalism, or insurance claims at this property in the last 3 years? What carrier currently insures it and at what premium?
- What's the average days-on-market for RENTAL listings here right now (not sales)? A rising rental-DOM trend means longer vacancies and softer asking-rent achievability than the comps imply.
- What's the recent tenant-quality profile in this submarket — average credit score on applications, eviction rate, late-payment / NSF rate, and stable-employment percentage? A property-management company in the area should have these aggregated.
- How much new for-sale + rental construction is in the pipeline within 1–3 miles? Heavy new supply typically softens prices + rents 12–24 months out; constrained supply supports both.
Investment metrics
- 1% rule
- 1.80% ✓
- Cap rate
- 12.44%
- Cash-on-cash
- 21.94%
- DSCR
- 1.98
- GRM
- 4.6
CMA / ARV
- ARV (on-the-fly)
- $57,912
- Comps found
- 12
Show comp detail 12 sales within ~0.75 mi
| Address | Dist | Beds/Ba | Sqft | Sold | Price | $/sf | Match |
|---|---|---|---|---|---|---|---|
| 1701 Ford St | 0.00mi | 3/2.0 | 1,524 (0%) | 4mo | $45,000 | $30 | 96 |
| 410 Park St | 0.29mi | 4/2.0 (+1) | 1,571 (+3%) | 10mo | $158,000 | $101 | 68 |
| 218 Denny St | 0.42mi | 3/1.5 | 1,529 (+0%) | 14mo | $70,000 | $46 | 67 |
| 2114 Greene St | 0.32mi | 3/1.0 | 1,391 (-9%) | 0mo | $50,000 | $36 | 66 |
| 310 Seymour St | 0.17mi | 3/1.5 | 1,320 (-13%) | 2mo | $22,000 | $17 | 66 |
| 1853 Jay St | 0.30mi | 3/1.5 | 1,644 (+8%) | 12mo | $55,500 | $34 | 61 |
| 937 Jay St | 0.50mi | 3/1.0 | 1,451 (-5%) | 13mo | $155,000 | $107 | 54 |
| 410 Hasbrouck St | 0.41mi | 3/1.5 | 1,365 (-10%) | 10mo | $69,900 | $51 | 53 |
| 330 Park St | 0.28mi | 2/1.5 (-1) | 1,306 (-14%) | 8mo | $50,000 | $38 | 50 |
| 929 Ford St | 0.46mi | 3/1.0 | 1,750 (+15%) | 3mo | $65,000 | $37 | 48 |
| 813 Montgomery St | 0.65mi | 4/1.0 (+1) | 1,622 (+6%) | 9mo | $85,475 | $53 | 42 |
| 624 Morris St | 0.73mi | 3/1.5 | 1,300 (-15%) | 6mo | $42,000 | $32 | 34 |
Match score weights: distance 35% · size 25% · config 20% · recency 20%. Top-matched comps best support the ARV.
Projected returns pro-forma
1.07% appreciation · 3.0% rent growth · sell at horizon
- IRR
- 24.3%
- Equity multiple
- 2.25×
- Total profit
- $23,598
- Equity at exit
- $23,280
- IRR
- 27.1%
- Equity multiple
- 4.30×
- Total profit
- $62,276
- Equity at exit
- $31,120
Cash invested: $18,900 (down + closing). Projections, not guarantees.
Landlord ↔ Tenant lean methodology
- Overall (STATE)
- 15 Strongly Tenant-Friendly
- State New York
- 15 Strongly Tenant-Friendly · D+10
- County
- — inherits STATE
- City
- — inherits STATE
ZIP-level market 13669
- Home prices YoY
- 0.4%
- Active inventory
- 127
- Price-to-rent
- 4.6×
Monthly cashflow live
- Estimated rent
- $1,215 medium interval (Pro) →
- Mortgage (P&I)
- −$354
- Tax from tax record
- −$232 /mo · $2,782/yr
- Insurance
- −$28
- HOA
- −$0
- Vacancy / Maint / Mgmt
- −$255
- Net cashflow
- $345
Break-even live
UW: 25.0% down · 7.5% · 30yr · 1.5% tax · 5.0% vac · 8.0% maint · 8.0% mgmt
Financing live
Cash to close
- Down payment
- $16,875
- Closing costs
- $2,025
- Reserves months
- —
- Total cash needed
- —
Loan-product check · same deal, 3 products live
Conventional
25% down · 7.5% · 30yr
- Down + closing
- —
- Monthly P&I
- —
- Monthly cashflow
- —
- DSCR
- —
- Eligible?
- —
Personal DTI + credit; lowest rate.
DSCR
20% down · 8.5% · 30yr
- Down + closing
- —
- Monthly P&I
- —
- Monthly cashflow
- —
- DSCR
- —
- Eligible?
- —
No personal income docs; deal must DSCR.
Hard money
10% down · 12.0% · 12mo
- Down + closing
- —
- Monthly P&I
- —
- Monthly cashflow
- —
- DSCR
- —
- Eligible?
- —
Short-term bridge; refi at stabilization.
Listing history 5 events
-
2026-05-26$67,500
-
2026-02-13soldstatus $45,000 Closed 517-char remark
Show marketing remark (517 chars)
Classic corner-lot home offering space, character, and potential. This 3-bedroom, 2-bath property features an enclosed front porch, attached garage, paved driveway, and a separate workshop ideal for hobbies or storage. The home has an older interior, providing an excellent opportunity for updates and personalization while maintaining its traditional charm. Convenient corner-lot setting with mature surroundings and easy access. A solid option for buyers looking for value, function, and the chance to build equity.
-
2026-02-13soldstatus $45,000
Show marketing remark (517 chars)
Classic corner-lot home offering space, character, and potential. This 3-bedroom, 2-bath property features an enclosed front porch, attached garage, paved driveway, and a separate workshop ideal for hobbies or storage. The home has an older interior, providing an excellent opportunity for updates and personalization while maintaining its traditional charm. Convenient corner-lot setting with mature surroundings and easy access. A solid option for buyers looking for value, function, and the chance to build equity.
-
2026-01-21status Pending 517-char remark
Show marketing remark (517 chars)
Classic corner-lot home offering space, character, and potential. This 3-bedroom, 2-bath property features an enclosed front porch, attached garage, paved driveway, and a separate workshop ideal for hobbies or storage. The home has an older interior, providing an excellent opportunity for updates and personalization while maintaining its traditional charm. Convenient corner-lot setting with mature surroundings and easy access. A solid option for buyers looking for value, function, and the chance to build equity.
-
2026-01-20$59,900 Active 517-char remark
Show marketing remark (517 chars)
Classic corner-lot home offering space, character, and potential. This 3-bedroom, 2-bath property features an enclosed front porch, attached garage, paved driveway, and a separate workshop ideal for hobbies or storage. The home has an older interior, providing an excellent opportunity for updates and personalization while maintaining its traditional charm. Convenient corner-lot setting with mature surroundings and easy access. A solid option for buyers looking for value, function, and the chance to build equity.
ⓘ Source: listings_history table (triggers on properties + properties_extension) + one-shot
backfill from property_details.listing_events for pre-trigger history.
Tax reassessment forecast NY · Partial reset (capped growth)
- Current annual tax
- $2,782 · $232/mo
- Projected year-2 tax
- $2,782 · $232/mo
- Expected delta
- $0/yr ($0/mo · 0.0%)
ⓘ Screening estimate from a state-policy table — verify with the county assessor before closing.
Climate risk First Street
- Flood 1/10 Low FEMA zone X · 0% chance over 30 yrs
- Wildfire 1/10 Low
- Heat 2/10 Low 7 d/yr ≥94°F today · 15 d/yr by 30 yrs out
- Wind 1/10 Low
- Air quality 2/10 Low 1 unhealthy d/yr today · 1 by 30 yrs out
Nearby sold comps map
Loading sold comps map…
Walkable amenities ~0.75 mi
Loading nearby amenities…
Taxation est. · year 1
- Rental income
- $14,574
- − Mortgage interest
- −$3,781
- − Property taxes
- −$2,782
- − Insurance
- −$338
- − Repairs & maintenance
- −$1,166
- − Management
- −$1,166
- − Depreciation
- −$1,964
- Taxable income
- $3,378
- Est. tax owed @ 24.0%
- −$811
- After-tax cash flow
- $3,335/yr
For passive investors: Depreciation is non-cash, so a rental often shows a tax loss while cash-flowing — sheltering income. Rental losses are passive: they offset passive income freely, and up to $25,000/yr can offset ordinary (W-2) income if you actively participate and your MAGI is under $100k (phasing out to $0 by $150k); unused losses carry forward. On sale, claimed depreciation is recaptured at up to 25%, and gains may owe capital-gains tax (a 1031 exchange can defer both). Figures are a year-1 estimate at your 24.0% rate — not tax advice; consult a CPA.
Schools (NCES district)
- District
- Ogdensburg City School District
- NCES district ID
- 3621660
- Math proficiency
- 34% ▼ -15.00%
- Reading proficiency
- 46% ▲ 6.00%
- Median HH income
- $38,253
- Composite
- 33.33/100
- National rank
- #5497
- State rank
- #531 of 590 in NY
Livability — Ogdensburg
- Score
- 66/100
- State rank
- #624
- US rank
- #11365
Category grades
Schools grade is shown separately in the Schools card above.
Census & demographics
- Census place
- Ogdensburg, NY
- Population (ZIP)
- 15,615
Population outlook (St. Lawrence County) Hauer SSP2
- Today (2025)
- 110,027 people
- By 2030
- 107,455 · -2.3%
- By 2040
- 100,492 · -8.7%
- By 2050
- 94,254 · -14.3%
- By 2075
- 80,175 · -27.1%
- By 2100
- 63,140 · -42.6%
Race, ethnicity, and origin ACS 2023
- Neighborhood character
- Predominantly White (91%)
- Race & ethnicity
- White 91% Black 4% Two or more races 3% Hispanic / Latino 2%
- Common ancestry
- Lithuanian 10% Polish 6% Slovak 3%
- Foreign-born
- 3% · Canada, China, Jamaica
- Languages at home
- 89% English-only · German/W. Germanic 9% Spanish 1%
Political lean MEDSL · St. Lawrence
- 2024 margin
- R (+18.0) · D 41.0% · R 59.0%
- 2008→2024 swing
- -34.3pp toward R · 2008: 16.3pp · 2024: -18.0pp
- All cycles
- 2024: R+18.0 2020: R+11.7 2016: R+10.8 2012: D+16.6 2008: D+16.3
Not yet ingested
- Civics
- —
Market trends
- HPI YoY
- ▲ 1.07%
- Current HPI
- 264.0261
- Rent YoY
- —
- Metro
- —
- State GDP YoY
- ▲ 2.60%
- F500 in state
- 92
Industry mix (Fortune 500 HQ in NY)
| Industry | F500 HQs | Revenue |
|---|---|---|
| Financial Services | 10 | $950B |
|
||
| Consumer Goods | 9 | $162B |
|
||
| Insurance | 4 | $225B |
|
||
| Telecommunications | 2 | $144B |
|
||
| Pharmaceuticals | 2 | $112B |
|
||
| Media / Entertainment | 2 | $69B |
|
||
Price history
+12.7% since first listed5 events — show timeline
- 2026-05-26 Listed $67,500 FSBO.com
- 2026-02-13 Sold (Public Records) $45,000 Public Records
- 2026-02-13 Sold (MLS) $45,000 SLCMLS
- 2026-01-21 Pending — SLCMLS
- 2026-01-20 Listed $59,900 SLCMLS
Property tax history
+23.0%/yrLatest (2025): $2,782 · +0.7% YoY. Source: county tax records.
Cash-flow waterfall
monthlySold comps — $/sqft
last 12 mo · ≤1 miLoading sold comps…