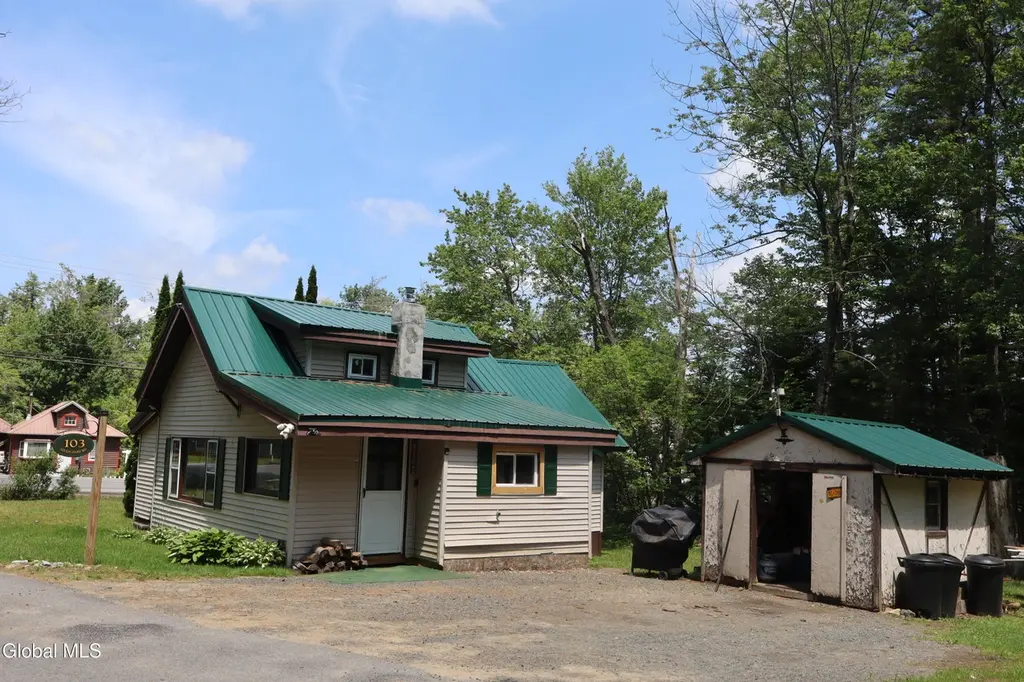
103 Seven Oaks Rd Rd · Caroga Lake, NY
Flood risk 1/10 · Minimal
- FEMA flood zone
- X
- Chance of flooding over 30 yrs
- 0.0%
- Est. flood insurance / yr
- $507 – $1,088
Fire risk 3/10 · Minor
- Est. fire insurance / yr
- $691 – $1,283
Heat risk 1/10 · Minimal
- Hot days now (above 90°F)
- 7 days/yr
- Hot days in 30 yrs
- 16 days/yr
Wind risk 2/10 · Minimal
- Chance of severe wind over 30 yrs
- 2.0%
Air-quality risk 1/10 · Minimal
- Unhealthy air days now
- 0 days/yr
- Unhealthy air days in 30 yrs
- 0 days/yr
Risk factors via First Street. Map © Google.
Why this score? — see what drove the D+ grade
The composite is a weighted blend of 9 inputs, each scored 0–100. Each bar is that input's sub-score; the figure is the points it added to the 100-point composite (weight × sub-score).
- ARV discount +15.0/15.0
- Appreciation +10.0/10.0
- Cash flow +8.1/30.0
- Schools +3.1/10.0
- Livability +3.1/5.0
- 1% rule +2.5/10.0
- Rent growth +2.5/5.0
- Condition / age +2.5/5.0
- DSCR +2.1/10.0
$149,900
🖨 Deal sheet (PDF) 📄 Offer letter ✓ Due diligence
Listing remarks
Welcome to 103 Seven Oaks Road! Nestled on a private corner lot, this updated home offers comfort in a peaceful setting. Enjoy a new metal roof, new wood stove, and classic fireplace for cozy living. The kitchen features newer appliances, updated electrical, and lighting throughout. Additional upgrades include a new pressure water pump and enhanced exterior charm. Deeded Lake Rights, Move-in ready with all the essentials-- Steps away from the Caroga Lake Marina! Home being sold as-is.
Key facts
- New metal roof
- Updated electrical
- Classic fireplace
Tags
Property features AI
Exterior
- Parking: Off-street parking; Driveway; Space for 6 vehicles
- Utilities: 100 amp electric service; Septic tank
- Home design: Single family residence; Raised foundation with pillar/post/pier
- Construction: Aluminum and vinyl siding
- Exterior features: Metal roof; Shed(s); Corner lot
Interior
- Kitchen: Range; Microwave
- Bedrooms: Bedroom on first floor; Bedroom on second floor; Second-floor office (can be used as bedroom)
- Flooring: Carpet; Laminate
- Bathrooms: One full bathroom on the first floor
- Heating & cooling: Forced air heating; Propane fuel
- Interior features: 8 total rooms; Living room fireplace
- Laundry & utility: Washer and dryer; Laundry in common area
Neighborhood map
What this means for you Summary
Snapshot
- This is a 2-bed/1.0-bath single-family listed at $150k.
Deal economics
- At list price, monthly cash flow is $-150 ($-2k/yr) — negative.
- To cash-flow at today's rent, offer at most $128k (14.4% below list).
- To meet the 1% rule (rent ≥ 1% of price), the offer needs to be $112k (25.1% below list).
- Recommended offer: $112k (25.1% below list) — sets the bar for 1% rule.
- Cap rate 5.1% vs local median 1.4% in Caroga Lake — top-decile yield for the area; either an underpriced asset or a hidden risk that comps aren't pricing in. Stress-test before assuming the spread holds.
Location & tenants
- Location reads 62/100 on livability (#870 in NY) — a middle-class / working-renter tenant base. Strengths: cost of living A+; Watch: housing C-, health & safety C-, schools D+.
- Wheelerville Union Free School District (rural): math 35% / reading 30% proficiency, ranked #707 of 755 in NY (top 94%) — families likely to look elsewhere, expect single-tenant / working-renter base with shorter leases.
- Market conditions: 20 active listings in the ZIP; 112 units permitted in Fulton County in 2024 (50 in 5+ unit buildings).
Forward outlook
- In year one you build about $16k of equity ($1k loan paydown + $15k appreciation (10.0% local appreciation)).
- Fulton County population projected at -23% by 2050 — secular population decline; favor cash flow + early exit over multi-decade hold.
- By year 3, paydown + projected appreciation supports a ~$41k cash-out refi (75% LTV) — recoverable capital for the next deal without selling this one.
Negotiation context
- It's been on market 78 days — a 6% lower offer ($141k) is reasonable based on typical stale-listing flexibility.
Risks & watch-outs
- Watch-outs: built in 1931 — expect roof / HVAC / electrical / plumbing capex.
Questions for the listing agent
- What do current leases actually rent for vs. the listed asking? Can we see a recent rent roll and the last 12 months of T-12 income?
- It's been on market 78 days. Have you received any prior offers? Is the seller open to a 25% concession, seller financing, or rate buy-down credit?
- Built in 1931 — when were the roof, HVAC, electrical panel, plumbing, and water heater last replaced?
- Why hasn't it sold? Are there any deal-killer items the seller is aware of (foundation, flood, title, zoning, code violations)?
- Is there a deadline driving the sale (1031 exchange, divorce, estate, relocation)? That informs how much negotiation room exists.
- Schools are D-rated, which usually means shorter tenancies and higher turnover. Who's the typical renter profile here, and what's been the actual vacancy rate?
- Crime grade is F in this area — have there been break-ins, vandalism, or insurance claims at this property in the last 3 years? What carrier currently insures it and at what premium?
- The area grade is low — what's the realistic commute time and amenity access for the typical tenant pool here? Any planned neighborhood developments (good or bad) we should know about?
- What's the average days-on-market for RENTAL listings here right now (not sales)? A rising rental-DOM trend means longer vacancies and softer asking-rent achievability than the comps imply.
- What's the recent tenant-quality profile in this submarket — average credit score on applications, eviction rate, late-payment / NSF rate, and stable-employment percentage? A property-management company in the area should have these aggregated.
- How much new for-sale + rental construction is in the pipeline within 1–3 miles? Heavy new supply typically softens prices + rents 12–24 months out; constrained supply supports both.
Investment metrics
- 1% rule
- 0.75% ✗
- Cap rate
- 5.10%
- Cash-on-cash
- -4.27%
- DSCR
- 0.81
- GRM
- 11.1
CMA / ARV
- ARV (on-the-fly)
- $231,525
- Comps found
- 5
Show comp detail 5 sales within ~0.75 mi
| Address | Dist | Beds/Ba | Sqft | Sold | Price | $/sf | Match |
|---|---|---|---|---|---|---|---|
| 112 S Shore Rd | 0.08mi | 2/1.5 | 1,304 (-1%) | 15mo | $270,000 | $207 | 79 |
| 114 Outlet Rd | 0.21mi | 2/1.0 | 1,180 (-11%) | 4mo | $160,000 | $136 | 69 |
| 718 S Shore Rd E Caroga | 0.29mi | 3/1.0 (+1) | 1,400 (+6%) | 11mo | $333,000 | $238 | 63 |
| 758 S Shore Rd E Caroga Lk | 0.32mi | 3/2.0 (+1) | 1,248 (-6%) | 9mo | $218,000 | $175 | 60 |
| 129 3rd | 0.56mi | 2/1.0 | 1,200 (-9%) | 10mo | $199,000 | $166 | 50 |
Match score weights: distance 35% · size 25% · config 20% · recency 20%. Top-matched comps best support the ARV.
Projected returns pro-forma
10.0% appreciation · 3.0% rent growth · sell at horizon
- IRR
- 21.2%
- Equity multiple
- 2.72×
- Total profit
- $72,134
- Equity at exit
- $135,042
- IRR
- 19.2%
- Equity multiple
- 6.24×
- Total profit
- $219,946
- Equity at exit
- $291,223
Cash invested: $41,972 (down + closing). Projections, not guarantees.
Landlord ↔ Tenant lean methodology
- Overall (STATE)
- 15 Strongly Tenant-Friendly
- State New York
- 15 Strongly Tenant-Friendly · D+10
- County
- — inherits STATE
- City
- — inherits STATE
ZIP-level market 12032
- Home prices YoY
- 3.0%
- Active inventory
- 20
- Price-to-rent
- 11.1×
Monthly cashflow live
- Estimated rent
- $1,122 medium interval (Pro) →
- Mortgage (P&I)
- −$786
- Tax est. 1.5%
- −$187 /mo · $2,248/yr
- Insurance
- −$62
- HOA
- −$0
- Vacancy / Maint / Mgmt
- −$236
- Net cashflow
- $-150
Break-even live
Sensitivity live
| Price | -10% $-46 | -5% $-98 | +0% $-150 | +5% $-201 | +10% $-253 |
|---|---|---|---|---|---|
| Rent | -10% $-238 | -5% $-194 | +0% $-150 | +5% $-105 | +10% $-61 |
| Rate | -1.0pp $-74 | -0.5pp $-111 | base $-150 | +0.5pp $-188 | +1.0pp $-228 |
UW: 25.0% down · 7.5% · 30yr · 1.5% tax · 5.0% vac · 8.0% maint · 8.0% mgmt
Financing live
Cash to close
- Down payment
- $37,475
- Closing costs
- $4,497
- Reserves months
- —
- Total cash needed
- —
Loan-product check · same deal, 3 products live
Conventional
25% down · 7.5% · 30yr
- Down + closing
- —
- Monthly P&I
- —
- Monthly cashflow
- —
- DSCR
- —
- Eligible?
- —
Personal DTI + credit; lowest rate.
DSCR
20% down · 8.5% · 30yr
- Down + closing
- —
- Monthly P&I
- —
- Monthly cashflow
- —
- DSCR
- —
- Eligible?
- —
No personal income docs; deal must DSCR.
Hard money
10% down · 12.0% · 12mo
- Down + closing
- —
- Monthly P&I
- —
- Monthly cashflow
- —
- DSCR
- —
- Eligible?
- —
Short-term bridge; refi at stabilization.
Listing history 16 events
-
2026-06-21days on market $149,900 Active 78 DOM
-
2026-06-18days on market $149,900 Active 76 DOM
-
2026-06-17days on market $149,900 Active 75 DOM
-
2026-06-16days on market $149,900 Active 74 DOM
-
2026-06-15days on market $149,900 Active 73 DOM
-
2026-06-13days on market $149,900 Active 71 DOM
-
2026-06-12days on market $149,900 Active 70 DOM
-
2026-06-09days on market $149,900 Active 67 DOM
-
2026-06-08days on market $149,900 Active 66 DOM
-
2026-06-07days on market $149,900 Active 65 DOM
-
2026-06-05days on market $149,900 Active 63 DOM
-
2026-06-04days on market $149,900 Active 61 DOM
-
2026-06-02days on market $149,900 Active 60 DOM
-
2026-06-01days on market $149,900 Active 59 DOM
-
2026-05-31days on market $149,900 Active 58 DOM
-
2026-04-03$149,900 Active
ⓘ Source: listings_history table (triggers on properties + properties_extension) + one-shot
backfill from property_details.listing_events for pre-trigger history.
Climate risk First Street
- Flood 1/10 Low FEMA zone X · 0% chance over 30 yrs
- Wildfire 3/10 Moderate
- Heat 1/10 Low 7 d/yr ≥90°F today · 16 d/yr by 30 yrs out
- Wind 2/10 Low 2% chance of damaging wind over 30 yrs
- Air quality 1/10 Low 0 unhealthy d/yr today · 0 by 30 yrs out
Nearby sold comps map
Loading sold comps map…
Walkable amenities ~0.75 mi
Loading nearby amenities…
Taxation est. · year 1
- Rental income
- $13,465
- − Mortgage interest
- −$8,397
- − Property taxes
- −$2,248
- − Insurance
- −$750
- − Repairs & maintenance
- −$1,077
- − Management
- −$1,077
- − Depreciation
- −$4,361
- Taxable loss
- −$4,445
- Est. tax savings @ 24.0%
- +$1,067
- After-tax cash flow
- $-727/yr
For passive investors: Depreciation is non-cash, so a rental often shows a tax loss while cash-flowing — sheltering income. Rental losses are passive: they offset passive income freely, and up to $25,000/yr can offset ordinary (W-2) income if you actively participate and your MAGI is under $100k (phasing out to $0 by $150k); unused losses carry forward. On sale, claimed depreciation is recaptured at up to 25%, and gains may owe capital-gains tax (a 1031 exchange can defer both). Figures are a year-1 estimate at your 24.0% rate — not tax advice; consult a CPA.
Schools (NCES district)
- District
- Wheelerville Union Free School District
- NCES district ID
- 3631200
- Math proficiency
- 35% ▲ 5.00%
- Reading proficiency
- 30% ▼ -5.00%
- Median HH income
- $47,872
- Composite
- 30.81/100
- National rank
- #11381
- State rank
- #707 of 755 in NY
Livability — Caroga Lake
- Score
- 62/100
- State rank
- #870
- US rank
- #16797
Category grades
Schools grade is shown separately in the Schools card above.
Census & demographics
- Census place
- Caroga Lake, NY
- Population (ZIP)
- 710
Population outlook (Fulton County) Hauer SSP2
- Today (2025)
- 51,132 people
- By 2030
- 49,114 · -3.9%
- By 2040
- 44,373 · -13.2%
- By 2050
- 39,321 · -23.1%
- By 2075
- 28,503 · -44.3%
- By 2100
- 19,268 · -62.3%
Race, ethnicity, and origin ACS 2023
- Neighborhood character
- Predominantly White (98%)
- Race & ethnicity
- White 98% Two or more races 2%
- Common ancestry
- Iranian 5% Lithuanian 3% Slovak 2%
- Foreign-born
- 0%
- Languages at home
- 99% English-only · French/Haitian/Cajun 1%
Political lean MEDSL · Fulton
- 2024 margin
- Solid R (+35.9) · D 32.1% · R 67.9%
- 2008→2024 swing
- -26.6pp toward R · 2008: -9.2pp · 2024: -35.9pp
- All cycles
- 2024: R+35.9 2020: R+31.4 2016: R+35.5 2012: R+10.5 2008: R+9.2
Not yet ingested
- Civics
- —
Market trends
- HPI YoY
- ▲ 14.26%
- Current HPI
- 496.3613
- Rent YoY
- —
- Metro
- —
- State GDP YoY
- ▲ 2.60%
- F500 in state
- 92
Industry mix (Fortune 500 HQ in NY)
| Industry | F500 HQs | Revenue |
|---|---|---|
| Financial Services | 10 | $950B |
|
||
| Consumer Goods | 9 | $162B |
|
||
| Insurance | 4 | $225B |
|
||
| Telecommunications | 2 | $144B |
|
||
| Pharmaceuticals | 2 | $112B |
|
||
| Media / Entertainment | 2 | $69B |
|
||
Price history
1 event — show timeline
- 2026-04-03 Listed $149,900 Global MLS
Cash-flow waterfall
monthlySold comps — $/sqft
last 12 mo · ≤1 miLoading sold comps…