13 Pheasant Rd · Copake Lake, NY
Flood risk 1/10 · Minimal
- FEMA flood zone
- X
- Chance of flooding over 30 yrs
- 0.0%
- Est. flood insurance / yr
- $507 – $1,088
Fire risk 3/10 · Minor
- Est. fire insurance / yr
- $691 – $1,283
Heat risk 3/10 · Minor
- Hot days now (above 95°F)
- 7 days/yr
- Hot days in 30 yrs
- 16 days/yr
Wind risk 4/10 · Minor
- Chance of severe wind over 30 yrs
- 11.0%
Air-quality risk 2/10 · Minimal
- Unhealthy air days now
- 1 days/yr
- Unhealthy air days in 30 yrs
- 2 days/yr
Risk factors via First Street. Map © Google.
Why this score? — see what drove the B+ grade
The composite is a weighted blend of 9 inputs, each scored 0–100. Each bar is that input's sub-score; the figure is the points it added to the 100-point composite (weight × sub-score).
- Cash flow +29.3/30.0
- DSCR +10.0/10.0
- Appreciation +10.0/10.0
- ARV discount +7.5/15.0
- 1% rule +7.4/10.0
- Schools +4.5/10.0
- Livability +3.1/5.0
- Rent growth +2.5/5.0
- Condition / age +2.5/5.0
$365,000
🖨 Deal sheet (PDF) 📄 Offer letter ✓ Due diligence
Listing remarks
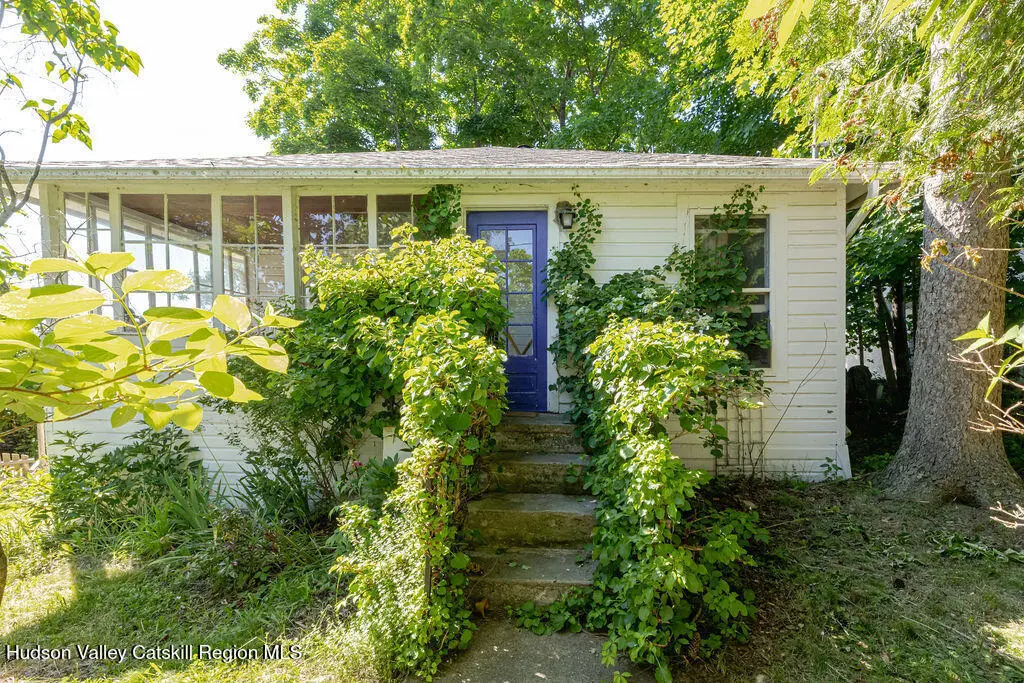
Warm, inviting, and oozing with charm, this 1940s cottage is the perfect getaway, boasting beautiful views of Copake Lake. Leading to the front door is a beautiful handmade archway with mature climbing hydrangeas that flower throughout the spring and summer. Some features include; a sunny enclosed porch entrance leading into a cozy living room with a wood stove, a bright & sunny dining room overlooking the lake, kitchen with a brand-new stove and breakfast nook, and a newly renovated full bathroom with a soaking tub, washer/dryer. Plus, a new roof, installed in 2025 and a remodeled garage that now serves as a guest house or art studio, complete with vaulted ceilings. The outdoor space
Key facts
- Handmade archway
- Private dock
- Remodeled garage
Tags
Property features AI
Finance
- Other: Additional structures: second residence and workshop
- HOA & community: Community amenities include clubhouse, golf, lake, playground, and restaurant
Exterior
- Utilities: Private well water; Septic tank; 200+ amp electrical service
- Home design: Cabin / House; Single-story (one level); Residential single family residence; Entry level: One
- Construction: Frame construction; Pillar/post/pier foundation; Asphalt shingle roof; Built as a single-story cabin/house
- Exterior features: Garden; Dock; Private yard; Beach access and lakefront on Copake Lake; Private-maintained road; Few trees; Views; Close to clubhouse
Interior
- Kitchen: Range; Refrigerator
- Flooring: Hardwood; Vinyl
- Bathrooms: 1 full bathroom
- Heating & cooling: Electric heating; Wood stove
- Interior features: Built-in features; Cathedral ceilings; Eat-in kitchen; Soaking tub; Walk-in closet(s); Seven total rooms
Neighborhood map
What this means for you Summary
Snapshot
- This is a 2-bed/1.0-bath single-family listed at $365k.
Deal economics
- At list price, monthly cash flow is $1k ($15k/yr) — positive.
- The deal already cash-flows at list — no discount required.
- Meets the 1% rule at list price ($5k rent vs $365k).
- Cap rate 10.5% vs local median 2.4% in Copake Lake — top-decile yield for the area; either an underpriced asset or a hidden risk that comps aren't pricing in. Stress-test before assuming the spread holds.
Location & tenants
- Location reads 62/100 on livability (#841 in NY) — a middle-class / working-renter tenant base. Strengths: employment A+, housing A+; Watch: amenities F, commute F, cost of living F.
- Taconic Hills Central School District (rural): math 53% / reading 51% proficiency, ranked #335 of 590 in NY (top 57%) — acceptable for families but not a draw, mixed tenant base, ~2y average lease.
- Zoned schools: Taconic Hills Elementary School (math 53% / reading 50%, grade C-, #1,041 of 2,108 statewide, top 50%, 562 students, 57% FRL); Taconic Hillsjunior/Senior High School (math 52% / reading 52%, grade D+, #946 of 1,100 statewide, top 88%, 502 students, 45% FRL).
- Market conditions: 42 active listings in the ZIP; 136 units permitted in Columbia County in 2024 (0 in 5+ unit buildings).
Forward outlook
- In year one you build about $39k of equity ($3k loan paydown + $36k appreciation (10.0% local appreciation)).
- Columbia County population projected at -22% by 2050 — secular population decline; favor cash flow + early exit over multi-decade hold.
- At projected returns (10.0% appreciation + 3.0% rent growth), your $102k cash investment doubles in ~2 years — after that, you're playing with house money.
- By year 2, paydown + projected appreciation supports a ~$63k cash-out refi (75% LTV) — recoverable capital for the next deal without selling this one.
Negotiation context
- Only 8 days on market — expect competitive offers; lowballing is unlikely to land.
- Current owner paid $132k; list at $365k implies a 175% gain — meaningful room to come down on a strong offer.
Risks & watch-outs
- Watch-outs: built in 1940 — expect roof / HVAC / electrical / plumbing capex.
Questions for the listing agent
- Built in 1940 — when were the roof, HVAC, electrical panel, plumbing, and water heater last replaced?
- Is there a deadline driving the sale (1031 exchange, divorce, estate, relocation)? That informs how much negotiation room exists.
- Schools are D-rated, which usually means shorter tenancies and higher turnover. Who's the typical renter profile here, and what's been the actual vacancy rate?
- What's the average days-on-market for RENTAL listings here right now (not sales)? A rising rental-DOM trend means longer vacancies and softer asking-rent achievability than the comps imply.
- What's the recent tenant-quality profile in this submarket — average credit score on applications, eviction rate, late-payment / NSF rate, and stable-employment percentage? A property-management company in the area should have these aggregated.
- How much new for-sale + rental construction is in the pipeline within 1–3 miles? Heavy new supply typically softens prices + rents 12–24 months out; constrained supply supports both.
Investment metrics
- 1% rule
- 1.24% ✓
- Cap rate
- 10.52%
- Cash-on-cash
- 15.08%
- DSCR
- 1.67
- GRM
- 6.7
CMA / ARV
No comps found within radius.
Projected returns pro-forma
10.0% appreciation · 3.0% rent growth · sell at horizon
- IRR
- 35.4%
- Equity multiple
- 3.74×
- Total profit
- $280,525
- Equity at exit
- $328,821
- IRR
- 30.5%
- Equity multiple
- 8.45×
- Total profit
- $761,618
- Equity at exit
- $709,115
Cash invested: $102,200 (down + closing). Projections, not guarantees.
Landlord ↔ Tenant lean methodology
- Overall (STATE)
- 15 Strongly Tenant-Friendly
- State New York
- 15 Strongly Tenant-Friendly · D+10
- County
- — inherits STATE
- City
- — inherits STATE
ZIP-level market 12521
- Home prices YoY
- 23.4%
- Active inventory
- 42
- Price-to-rent
- 6.7×
Monthly cashflow live
- Estimated rent
- $4,526 medium interval (Pro) →
- Mortgage (P&I)
- −$1,914
- Tax from tax record
- −$225 /mo · $2,703/yr
- Insurance
- −$152
- HOA
- −$0
- Vacancy / Maint / Mgmt
- −$951
- Net cashflow
- $1,284
Break-even live
Sensitivity live
| Price | -10% $1,491 | -5% $1,388 | +0% $1,284 | +5% $1,181 | +10% $1,078 |
|---|---|---|---|---|---|
| Rent | -10% $927 | -5% $1,106 | +0% $1,284 | +5% $1,463 | +10% $1,642 |
| Rate | -1.0pp $1,468 | -0.5pp $1,377 | base $1,284 | +0.5pp $1,190 | +1.0pp $1,094 |
UW: 25.0% down · 7.5% · 30yr · 1.5% tax · 5.0% vac · 8.0% maint · 8.0% mgmt
Financing live
Cash to close
- Down payment
- $91,250
- Closing costs
- $10,950
- Reserves months
- —
- Total cash needed
- —
Loan-product check · same deal, 3 products live
Conventional
25% down · 7.5% · 30yr
- Down + closing
- —
- Monthly P&I
- —
- Monthly cashflow
- —
- DSCR
- —
- Eligible?
- —
Personal DTI + credit; lowest rate.
DSCR
20% down · 8.5% · 30yr
- Down + closing
- —
- Monthly P&I
- —
- Monthly cashflow
- —
- DSCR
- —
- Eligible?
- —
No personal income docs; deal must DSCR.
Hard money
10% down · 12.0% · 12mo
- Down + closing
- —
- Monthly P&I
- —
- Monthly cashflow
- —
- DSCR
- —
- Eligible?
- —
Short-term bridge; refi at stabilization.
Listing history 8 events
-
2026-06-19days on market $365,000 Active 8 DOM
-
2026-06-18days on market $365,000 Active 7 DOM
-
2026-06-17days on market $365,000 Active 6 DOM
-
2026-06-16days on market $365,000 Active 5 DOM
-
2026-06-15days on market $365,000 Active 4 DOM
-
2026-06-14days on market $365,000 Active 2 DOM
-
2026-06-12remarks 695-char remark
-
2026-06-12$365,000 Active 1 DOM
ⓘ Source: listings_history table (triggers on properties + properties_extension) + one-shot
backfill from property_details.listing_events for pre-trigger history.
Tax reassessment forecast NY · Partial reset (capped growth)
- Current annual tax
- $2,703 · $225/mo
- Projected year-2 tax
- $4,436 · $370/mo
- Expected delta
- +$1,733/yr (+$144/mo · 64.1%)
ⓘ Screening estimate from a state-policy table — verify with the county assessor before closing.
Climate risk First Street
- Flood 1/10 Low FEMA zone X · 0% chance over 30 yrs
- Wildfire 3/10 Moderate
- Heat 3/10 Moderate 7 d/yr ≥95°F today · 16 d/yr by 30 yrs out
- Wind 4/10 Moderate 11% chance of damaging wind over 30 yrs
- Air quality 2/10 Low 1 unhealthy d/yr today · 2 by 30 yrs out
Nearby sold comps map
Loading sold comps map…
Walkable amenities ~0.75 mi
Loading nearby amenities…
Taxation est. · year 1
- Rental income
- $54,318
- − Mortgage interest
- −$20,446
- − Property taxes
- −$2,703
- − Insurance
- −$1,825
- − Repairs & maintenance
- −$4,345
- − Management
- −$4,345
- − Depreciation
- −$10,618
- Taxable income
- $10,035
- Est. tax owed @ 24.0%
- −$2,408
- After-tax cash flow
- $13,005/yr
For passive investors: Depreciation is non-cash, so a rental often shows a tax loss while cash-flowing — sheltering income. Rental losses are passive: they offset passive income freely, and up to $25,000/yr can offset ordinary (W-2) income if you actively participate and your MAGI is under $100k (phasing out to $0 by $150k); unused losses carry forward. On sale, claimed depreciation is recaptured at up to 25%, and gains may owe capital-gains tax (a 1031 exchange can defer both). Figures are a year-1 estimate at your 24.0% rate — not tax advice; consult a CPA.
Schools (NCES district)
- District
- Taconic Hills Central School District
- NCES district ID
- 3628620
- Math proficiency
- 53% ▲ 10.00%
- Reading proficiency
- 51% ▲ 11.00%
- Median HH income
- $57,329
- Composite
- 45.16/100
- National rank
- #2676
- State rank
- #335 of 590 in NY
Livability — Copake Lake
- Score
- 62/100
- State rank
- #841
- US rank
- #16329
Category grades
Schools grade is shown separately in the Schools card above.
Census & demographics
- Census place
- Copake Lake, NY
- Population (ZIP)
- 1,874
Population outlook (Columbia County) Hauer SSP2
- Today (2025)
- 58,662 people
- By 2030
- 56,557 · -3.6%
- By 2040
- 51,324 · -12.5%
- By 2050
- 45,790 · -21.9%
- By 2075
- 35,232 · -39.9%
- By 2100
- 25,846 · -55.9%
Race, ethnicity, and origin ACS 2023
- Neighborhood character
- Predominantly White (81%)
- Race & ethnicity
- White 81% Two or more races 11% Hispanic / Latino 7% Black 1%
- Hispanic origin (detail)
- Mexican 1% Cuban 2%
- Common ancestry
- Romanian 3% Scotch-Irish 3% Slovak 2%
- Foreign-born
- 4% · Canada, Jamaica
- Languages at home
- 90% English-only · Spanish 8% Russian/Polish/Slavic 1% Other Indo-European 1%
Political lean MEDSL · Columbia
- 2024 margin
- D (+14.7) · D 57.4% · R 42.6%
- 2008→2024 swing
- +1.3pp toward D · 2008: 13.4pp · 2024: 14.7pp
- All cycles
- 2024: D+14.7 2020: D+16.7 2016: D+1.4 2012: D+11.7 2008: D+13.4
Not yet ingested
- Civics
- —
Market trends
- HPI YoY
- ▲ 83.58%
- Current HPI
- 441.0272
- Rent YoY
- —
- Metro
- —
- State GDP YoY
- ▲ 2.60%
- F500 in state
- 92
Industry mix (Fortune 500 HQ in NY)
| Industry | F500 HQs | Revenue |
|---|---|---|
| Financial Services | 10 | $950B |
|
||
| Consumer Goods | 9 | $162B |
|
||
| Insurance | 4 | $225B |
|
||
| Telecommunications | 2 | $144B |
|
||
| Pharmaceuticals | 2 | $112B |
|
||
| Media / Entertainment | 2 | $69B |
|
||
Price history
+46.0% since first listed3 events — show timeline
- 2026-06-11 Listed $365,000 HVCRMLS
- 2009-04-17 Sold (Public Records) $132,500 Public Records
- 2004-11-10 Sold (Public Records) $250,000 Public Records
Property tax history
+2.2%/yrLatest (2025): $2,703 · +2.8% YoY. Source: county tax records.
Cash-flow waterfall
monthlySold comps — $/sqft
last 12 mo · ≤1 miLoading sold comps…