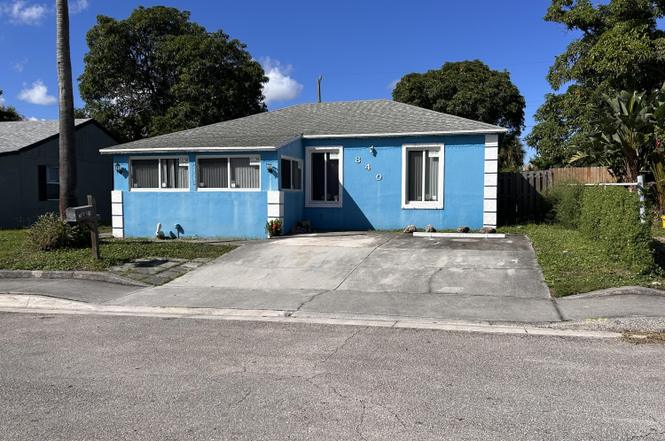
840 W 2nd St · Riviera Beach, FL
Flood risk 1/10 · Minimal
- FEMA flood zone
- X (unshaded)
- Chance of flooding over 30 yrs
- 0.0%
- Est. flood insurance / yr
- $507 – $1,088
Fire risk 1/10 · Minimal
- Est. fire insurance / yr
- $947 – $1,759
Heat risk 10/10 · Severe
- Hot days now (above 105°F)
- 7 days/yr
- Hot days in 30 yrs
- 25 days/yr
Wind risk 10/10 · Severe
- Chance of severe wind over 30 yrs
- 99.0%
Air-quality risk 2/10 · Minimal
- Unhealthy air days now
- 0 days/yr
- Unhealthy air days in 30 yrs
- 1 days/yr
Risk factors via First Street. Map © Google.
Why this score? — see what drove the B- grade
The composite is a weighted blend of 9 inputs, each scored 0–100. Each bar is that input's sub-score; the figure is the points it added to the 100-point composite (weight × sub-score).
- Cash flow +30.0/30.0
- 1% rule +10.0/10.0
- DSCR +10.0/10.0
- ARV discount +7.5/15.0
- Schools +4.3/10.0
- Livability +3.4/5.0
- Condition / age +2.5/5.0
- Rent growth +2.3/5.0
- Appreciation +0.0/10.0
$183,500
🖨 Deal sheet 📄 Offer letter ✓ Due diligence
Listing remarks
Seller has multiple offers and has requested HIGHEST AND BEST with a current due date of 4/29/2026 11:59:00 PM Mountain Time. The kitchen appears to have experienced a stovetop fire, resulting in discoloration to the walls, ceiling and cabinetry. The bathroom is in poor condition and requires remodeling. Located in a designated Opportunity Zone, this property offers valuable tax advantages for the savvy investor. Spacious backyard, Perfect for out door enjoyment. Conveniently located near schools, shopping, and the beach.
Key facts
- Spacious backyard
- 4,959 sq ft lot
- 2 parking spots
Tags
Property features AI
Exterior
- Parking: Two open parking spaces
- Utilities: Public water; Public sewer; Three-phase electric; Sewer available; Water available
- Home design: Single-family residence; One story; Faces south; Resale condition
- Construction: Concrete/CBS construction; Other construction materials
- Exterior features: Not waterfront; No waterfront features
Interior
- Bedrooms: Two bedrooms on the main level
- Flooring: Other flooring
- Bathrooms: One full bathroom
- Heating & cooling: Central heating; Other heating; Central air conditioning; Other cooling
- Interior features: Unfurnished; No notable interior features listed
Neighborhood map
What this means for you Summary
Snapshot
- This is a 2-bed/1.0-bath single-family listed at $184k.
Deal economics
- At list price, monthly cash flow is $1k ($16k/yr) — positive.
- The deal already cash-flows at list — no discount required.
- Meets the 1% rule at list price ($3k rent vs $184k).
- Recommended offer: $161k (12.0% below list) — sets the bar for market timing.
Location & tenants
- Location reads 67/100 on livability (#581 in FL) — a middle-class / working-renter tenant base. Strengths: housing A+, health & safety A+, cost of living A-; Watch: employment D, crime F, amenities F.
- Palm Beach (suburban): math 46% / reading 53% proficiency, ranked #34 of 73 in FL (top 47%) — families likely to look elsewhere, expect single-tenant / working-renter base with shorter leases.
- Zoned schools: West Riviera Elementary School (math 26% / reading 22%, grade F, #2,057 of 2,144 statewide, top 96%, 487 students, 83% FRL); Howell L. Watkins Middle School (math 18% / reading 33%, grade F, #512 of 571 statewide, top 90%, 794 students, 76% FRL); William T. Dwyer High School (math 36% / reading 58%, grade D-, #207 of 667 statewide, top 32%, 2,206 students, 37% FRL).
- Zoned-school proficiency averages 32% at this address vs 50% district-wide (-17 pts) — the specific schools serving this property underperform the Palm Beach average; the district grade overstates school quality for this exact location.
- Market conditions: Rents soft (-0.7%/yr); 506 active listings in the ZIP; 12 comparable units currently listed for rent nearby; rentals at typical pace (median 24d on market — plan ~3-4 weeks tenant-placement turnaround); 3,974 units permitted in Palm Beach County in 2024 (1,012 in 5+ unit buildings).
- At $3,465/mo this rent would consume 64% of the median local household income ($65k/yr) (locally 1838% of renters already pay >50% of income on rent) — very limited rent-growth headroom before tenants either downsize or default.
Forward outlook
- Local home prices are declining (-3.0%/yr); year-one equity from $1k of loan paydown is wiped out by about $6k of value loss. Plan a longer hold.
- Palm Beach County population projected at +30% by 2050 — long-run rental-demand tailwind backs the buy-and-hold thesis.
- At projected returns (-3.0% appreciation + 0.0% rent growth), your $51k cash investment doubles in ~5 years — after that, you're playing with house money.
Negotiation context
- It's been on market 238 days — a 12% lower offer ($161k) is reasonable based on typical stale-listing flexibility.
- 6 sale attempts since 2y ago; this cycle's ask has dropped $62k (25%) from the opening price — seller is motivated, your offer sets the floor, not the list.
Risks & watch-outs
- Watch-outs: property tax is 2.6% of price; built in 1950 — expect roof / HVAC / electrical / plumbing capex.
- Climate carrying-cost: severe wind risk, 99% chance of damaging wind over 30y; extreme-heat days projected 7→25/yr by 2055 (HVAC capex compounding) — expect insurance premiums to compound above CPI over the hold.
Questions for the listing agent
- It's been on market 238 days. Have you received any prior offers? Is the seller open to a 12% concession, seller financing, or rate buy-down credit?
- Built in 1950 — when were the roof, HVAC, electrical panel, plumbing, and water heater last replaced?
- Property tax is high relative to price — has the assessment been appealed recently, and will the sale trigger a re-assessment?
- Why hasn't it sold? Are there any deal-killer items the seller is aware of (foundation, flood, title, zoning, code violations)?
- Is there a deadline driving the sale (1031 exchange, divorce, estate, relocation)? That informs how much negotiation room exists.
- Crime grade is F in this area — have there been break-ins, vandalism, or insurance claims at this property in the last 3 years? What carrier currently insures it and at what premium?
- What's the average days-on-market for RENTAL listings here right now (not sales)? A rising rental-DOM trend means longer vacancies and softer asking-rent achievability than the comps imply.
- What's the recent tenant-quality profile in this submarket — average credit score on applications, eviction rate, late-payment / NSF rate, and stable-employment percentage? A property-management company in the area should have these aggregated.
- How much new for-sale + rental construction is in the pipeline within 1–3 miles? Heavy new supply typically softens prices + rents 12–24 months out; constrained supply supports both.
Investment metrics
- 1% rule
- 1.89% ✓
- Cap rate
- 14.84%
- Cash-on-cash
- 30.53%
- DSCR
- 2.36
- GRM
- 4.4
CMA / ARV
No comps found within radius.
Projected returns pro-forma
-3.0% appreciation · 0.0% rent growth · sell at horizon
- IRR
- 21.6%
- Equity multiple
- 1.85×
- Total profit
- $43,510
- Equity at exit
- $27,360
- IRR
- 27.5%
- Equity multiple
- 3.07×
- Total profit
- $106,458
- Equity at exit
- $15,866
Cash invested: $51,380 (down + closing). Projections, not guarantees.
Landlord ↔ Tenant lean methodology
- Overall (STATE)
- 87 Strongly Landlord-Friendly
- State Florida
- 87 Strongly Landlord-Friendly · R+3
- County
- — inherits STATE
- City
- — inherits STATE
ZIP-level market 33404
- Home prices YoY
- -31.1%
- Rents YoY
- -0.7%
- Active inventory
- 506
- Price-to-rent
- 4.4×
Monthly cashflow live
- Estimated rent
- $3,465 high interval (Pro) →
- Mortgage (P&I)
- −$962
- Tax from tax record
- −$391 /mo · $4,696/yr
- Insurance
- −$76
- HOA
- −$0
- Vacancy / Maint / Mgmt
- −$728
- Net cashflow
- $1,307
Break-even live
UW: 25.0% down · 7.5% · 30yr · 1.5% tax · 5.0% vac · 8.0% maint · 8.0% mgmt
Financing live
Cash to close
- Down payment
- $45,875
- Closing costs
- $5,505
- Reserves months
- —
- Total cash needed
- —
Loan-product check · same deal, 3 products live
Conventional
25% down · 7.5% · 30yr
- Down + closing
- —
- Monthly P&I
- —
- Monthly cashflow
- —
- DSCR
- —
- Eligible?
- —
Personal DTI + credit; lowest rate.
DSCR
20% down · 8.5% · 30yr
- Down + closing
- —
- Monthly P&I
- —
- Monthly cashflow
- —
- DSCR
- —
- Eligible?
- —
No personal income docs; deal must DSCR.
Hard money
10% down · 12.0% · 12mo
- Down + closing
- —
- Monthly P&I
- —
- Monthly cashflow
- —
- DSCR
- —
- Eligible?
- —
Short-term bridge; refi at stabilization.
Rent comps 12 comps
| Address | Beds | Baths | Sqft | Rent | $/sqft | DOM | Units | Dist |
|---|---|---|---|---|---|---|---|---|
| 522 W 2nd St Riviera Beach, FL | 3.0 | 1.0 | 900 | $2,895 | $3.22 | 24d | 1 | 0.32mi |
| 436 51st St West Palm Beach, FL | 2.0 | 1.0 | 968 | $3,750 | $3.87 | 24d | 1 | 0.93mi |
| 4444 N Flagler Dr West Palm Beach, FL | 1.0 | 1.0 | 765 | $4,613 | $6.03 | 2d | 1 | 1.25mi |
| 4444 N Flagler Dr West Palm Beach, FL | 1.0 | 1.0 | 765 | $5,263 | $6.88 | 16d | 1 | 1.25mi |
| 4444 N Flagler Dr Unit 4334-2008 West Palm Beach, FL | 1.0 | 1.0 | 885 | $4,150 | $4.69 | 24d | 1 | 1.26mi |
| 4444 N Flagler Dr Unit 4444-306 West Palm Beach, FL | 1.0 | 1.0 | 925 | $3,395 | $3.67 | 24d | 1 | 1.26mi |
| 401 42nd St West Palm Beach, FL | 3.0 | 1.0 | 1100 | $4,950 | $4.50 | 24d | 1 | 1.27mi |
| 158 E 23rd St Riviera Beach, FL | 2.0 | 2.0 | 1110 | $2,900 | $2.61 | 24d | 1 | 1.42mi |
| 158 E 23rd St Riviera Beach, FL | 2.0 | 2.0 | 1110 | $2,900 | $2.61 | 21d | 1 | 1.42mi |
| 3940 N Flagler Dr #206 West Palm Beach, FL | 1.0 | 1.0 | 1078 | $3,950 | $3.66 | 3d | 1 | 1.49mi |
| 3940 N Flagler Dr #206 West Palm Beach, FL | 1.0 | 1.0 | 1078 | $3,950 | $3.66 | 4d | 1 | 1.49mi |
| 3940 N Flagler Dr #206 West Palm Beach, FL | 1.0 | 1.0 | 1078 | $4,950 | $4.59 | 24d | 1 | 1.49mi |
Listing history 38 events
-
2026-06-18days on market $183,500 Active 238 DOM
-
2026-06-17days on market $183,500 Active 237 DOM
-
2026-06-16days on market $183,500 Active 236 DOM
-
2026-06-15days on market $183,500 Active 235 DOM
-
2026-06-13days on market $183,500 Active 233 DOM
-
2026-06-09days on market $183,500 Active 229 DOM
-
2026-06-07days on market $183,500 Active 227 DOM
-
2026-06-04days on market $183,500 Active 224 DOM
-
2026-06-03days on market $183,500 Active 223 DOM
-
2026-06-01days on market $183,500 Active 221 DOM
-
2026-05-31days on market $183,500 Active 220 DOM
-
2026-05-20status Pending
-
2026-04-22status Active
-
2026-02-26historical Active Under Contract
-
2026-02-24status Active
-
2026-02-23status Pending
-
2026-02-22price $183,500
-
2025-12-22price $199,260
-
2025-11-19price $221,400
-
2025-10-15$246,000 Active
-
2025-06-11historical
-
2025-05-12$225,000 Active
-
2025-04-19historical
-
2024-11-18price $275,000
-
2024-10-16price $265,000
-
2024-09-25price $280,000
-
2024-08-16price $230,000
-
2024-08-13price $240,000
-
2024-07-20price $260,000
-
2024-07-18price $246,000
-
2024-07-17price $260,000
-
2024-06-25price $275,000
-
2024-05-17price $265,000
-
2024-05-16price $270,000
-
2024-05-14price $275,000
-
2024-05-14status Active
-
2024-05-07historical Active Under Contract
-
2024-04-22$250,000 Active
ⓘ Source: listings_history table (triggers on properties + properties_extension) + one-shot
backfill from property_details.listing_events for pre-trigger history.
Tax reassessment forecast FL · Resets to sale price
- Current annual tax
- $4,696 · $391/mo
- Projected year-2 tax
- $4,696 · $391/mo
- Expected delta
- $0/yr ($0/mo · 0.0%)
ⓘ Screening estimate from a state-policy table — verify with the county assessor before closing.
Climate risk First Street
- Flood 1/10 Low FEMA zone X (unshaded) · 0% chance over 30 yrs
- Wildfire 1/10 Low
- Heat 10/10 Extreme 7 d/yr ≥105°F today · 25 d/yr by 30 yrs out
- Wind 10/10 Extreme 99% chance of damaging wind over 30 yrs
- Air quality 2/10 Low 0 unhealthy d/yr today · 1 by 30 yrs out
Nearby sold comps map
Loading sold comps map…
Walkable amenities ~0.75 mi
Loading nearby amenities…
Taxation est. · year 1
- Rental income
- $41,577
- − Mortgage interest
- −$10,279
- − Property taxes
- −$4,696
- − Insurance
- −$918
- − Repairs & maintenance
- −$3,326
- − Management
- −$3,326
- − Depreciation
- −$5,338
- Taxable income
- $13,694
- Est. tax owed @ 24.0%
- −$3,287
- After-tax cash flow
- $12,398/yr
For passive investors: Depreciation is non-cash, so a rental often shows a tax loss while cash-flowing — sheltering income. Rental losses are passive: they offset passive income freely, and up to $25,000/yr can offset ordinary (W-2) income if you actively participate and your MAGI is under $100k (phasing out to $0 by $150k); unused losses carry forward. On sale, claimed depreciation is recaptured at up to 25%, and gains may owe capital-gains tax (a 1031 exchange can defer both). Figures are a year-1 estimate at your 24.0% rate — not tax advice; consult a CPA.
Schools (NCES district)
- District
- Palm Beach
- NCES district ID
- 1201500
- Math proficiency
- 46% ▼ -16.00%
- Reading proficiency
- 53% ▼ -4.00%
- Median HH income
- $53,943
- Composite
- 42.72/100
- National rank
- #3160
- State rank
- #34 of 73 in FL
Livability — Riviera Beach
- Score
- 67/100
- State rank
- #581
- US rank
- #11060
Category grades
Schools grade is shown separately in the Schools card above.
Census & demographics
- Census place
- Riviera Beach, FL
- County
- Palm Beach County · 1,438,312 people
- City population
- 30,912
- Metro
- Miami-Fort Lauderdale-Pompano Beach, FL
- Population (ZIP)
- 30,912
- Household income
- $65,063
- Rent vs Own
- Severe rent burden
- 1838.0
Population outlook (Palm Beach County) Hauer SSP2
- Today (2025)
- 1,637,487 people
- By 2030
- 1,743,255 · +6.5%
- By 2040
- 1,948,712 · +19.0%
- By 2050
- 2,132,979 · +30.3%
- By 2075
- 2,530,027 · +54.5%
- By 2100
- 2,706,979 · +65.3%
Race, ethnicity, and origin ACS 2023
- Neighborhood character
- Majority Black (64%)
- Race & ethnicity
- Black 64% White 22% Hispanic / Latino 9% Two or more races 8%
- Hispanic origin (detail)
- Mexican 1% Puerto Rican 1%
- Common ancestry
- Hispanic 8% Romanian 1% Italian 1%
- Foreign-born
- 21% · Canada, Jamaica
- Languages at home
- 82% English-only · Spanish 8% French/Haitian/Cajun 7% Other Indo-European 1%
Political lean MEDSL · Palm Beach
- 2024 margin
- Toss-up / Even · D 50.0% · R 49.2%
- 2008→2024 swing
- -22.1pp toward R · 2008: 22.9pp · 2024: 0.8pp
- All cycles
- 2024: D+0.8 2020: D+12.8 2016: D+15.3 2012: D+17.0 2008: D+22.9
Not yet ingested
- Civics
- —
Market trends
- HPI YoY
- ▼ -153.74%
- Current HPI
- 341.1761
- Rent YoY
- ▼ -0.72%
- Metro
- Miami-Fort Lauderdale-Pompano Beach, FL
- State GDP YoY
- ▲ 3.28%
- F500 in state
- 36
Industry mix (Fortune 500 HQ in FL)
| Industry | F500 HQs | Revenue |
|---|---|---|
| Industrial Technology | 2 | $29B |
|
||
| Insurance | 2 | $17B |
|
||
| Retail | 1 | $60B |
|
||
| Technology Distribution | 1 | $58B |
|
||
| Homebuilding | 1 | $35B |
|
||
| Technology Manufacturing | 1 | $35B |
|
||
Price history
-26.6% since first listed27 events — show timeline
- 2026-05-20 Pending — Beaches MLS
- 2026-04-22 Relisted — Beaches MLS
- 2026-02-26 Contingent — Beaches MLS
- 2026-02-24 Relisted — Beaches MLS
- 2026-02-23 Pending — Beaches MLS
- 2026-02-22 Price Changed $183,500 Beaches MLS
- 2025-12-22 Price Changed $199,260 Beaches MLS
- 2025-11-19 Price Changed $221,400 Beaches MLS
- 2025-10-15 Listed $246,000 Beaches MLS
- 2025-06-11 Listing Removed — Beaches MLS
- 2025-05-12 Listed $225,000 Beaches MLS
- 2025-04-19 Listing Removed — Beaches MLS
- 2024-11-18 Price Changed $275,000 Beaches MLS
- 2024-10-16 Price Changed $265,000 Beaches MLS
- 2024-09-25 Price Changed $280,000 Beaches MLS
- 2024-08-16 Price Changed $230,000 Beaches MLS
- 2024-08-13 Price Changed $240,000 Beaches MLS
- 2024-07-20 Price Changed $260,000 Beaches MLS
- 2024-07-18 Price Changed $246,000 Beaches MLS
- 2024-07-17 Price Changed $260,000 Beaches MLS
- 2024-06-25 Price Changed $275,000 Beaches MLS
- 2024-05-17 Price Changed $265,000 Beaches MLS
- 2024-05-16 Price Changed $270,000 Beaches MLS
- 2024-05-14 Price Changed $275,000 Beaches MLS
- 2024-05-14 Relisted — Beaches MLS
- 2024-05-07 Contingent — Beaches MLS
- 2024-04-22 Listed $250,000 Beaches MLS
Property tax history
+23.1%/yrLatest (2025): $4,696 · +6.7% YoY. Source: county tax records.
Cash-flow waterfall
monthlySold comps — $/sqft
last 12 mo · ≤1 miLoading sold comps…