7353 April Dr · Fayetteville, NC
Flood risk 3/10 · Minor
- FEMA flood zone
- X (unshaded)
- Chance of flooding over 30 yrs
- 0.2%
- Est. flood insurance / yr
- $507 – $1,088
Fire risk 5/10 · Moderate
- Est. fire insurance / yr
- $906 – $1,684
Heat risk 7/10 · Major
- Hot days now (above 106°F)
- 7 days/yr
- Hot days in 30 yrs
- 16 days/yr
Wind risk 6/10 · Moderate
- Chance of severe wind over 30 yrs
- 74.0%
Air-quality risk 2/10 · Minimal
- Unhealthy air days now
- 0 days/yr
- Unhealthy air days in 30 yrs
- 1 days/yr
Risk factors via First Street. Map © Google.
Why this score? — see what drove the C- grade
The composite is a weighted blend of 9 inputs, each scored 0–100. Each bar is that input's sub-score; the figure is the points it added to the 100-point composite (weight × sub-score).
- Cash flow +21.2/30.0
- ARV discount +7.6/15.0
- DSCR +6.8/10.0
- 1% rule +5.4/10.0
- Livability +3.8/5.0
- Rent growth +3.3/5.0
- Schools +3.1/10.0
- Condition / age +2.5/5.0
- Appreciation +0.0/10.0
$165,000
🖨 Deal sheet 📄 Offer letter ✓ Due diligence
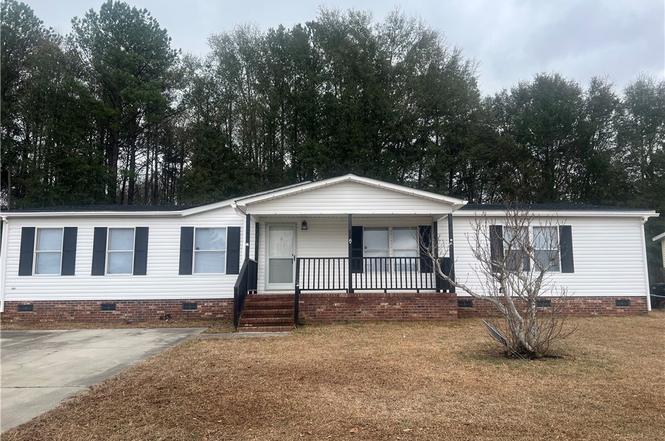
Listing remarks
Beautifully refreshed 3BR/2BA manufactured home in established Colony Village offering over 1,600 SF of comfortable living space. Spacious living area features a cozy fireplace and flows seamlessly into the kitchen and dining area, creating an inviting space for everyday living and entertaining. Primary suite includes a private bath and ample closet space. Two additional bedrooms provide flexibility for guests, home office, or additional living needs. Major updates include a NEW roof, NEW HVAC system, fresh interior paint, and brand-new carpet, providing peace of mind and true move-in ready appeal. Exterior features include a fenced backyard and deck for outdoor enjoyment Conveniently locat
Key facts
- Private bath
- Cozy fireplace
- Brand new carpet
Tags
Neighborhood map
What this means for you Summary
Snapshot
- This is a 3-bed/3.0-bath manufactured listed at $165k.
Deal economics
- At list price, monthly cash flow is $240 ($3k/yr) — positive.
- The deal already cash-flows at list — no discount required.
- Meets the 1% rule at list price ($2k rent vs $165k).
- Recommended offer: $160k (3.0% below list) — sets the bar for market timing.
- Cap rate 8.0% vs local median 4.9% in Fayetteville — top-decile yield for the area; either an underpriced asset or a hidden risk that comps aren't pricing in. Stress-test before assuming the spread holds.
Location & tenants
- Location reads 75/100 on livability (#45 in NC, #4,031 nationally) — a middle-class / working-renter tenant base. Strengths: commute A+, cost of living A+, housing A+; Watch: crime F, employment D-.
- Cumberland County Schools (urban): math 32% / reading 41% proficiency, ranked #126 of 178 in NC (top 71%) — families likely to look elsewhere, expect single-tenant / working-renter base with shorter leases.
- Zoned schools: E E Miller Elementary (math 28% / reading 43%, grade F, #817 of 1,410 statewide, top 58%, 625 students, 100% FRL); Lewis Chapel Middle (math 15% / reading 27%, grade F, #424 of 475 statewide, top 90%, 578 students, 100% FRL); Seventy-First High (math 45% / reading 44%, grade F, #352 of 535 statewide, top 68%, 1,366 students, 70% FRL) — zoned schools average 90% FRL vs 55% district-wide (35 pts higher); higher-poverty schools than district average — tighter screening recommended.
- Market conditions: Rents rising (+3.1%/yr); 429 active listings in the ZIP; 40 comparable units currently listed for rent nearby; rentals at typical pace (median 23d on market — plan ~3-4 weeks tenant-placement turnaround); 1,125 units permitted in Cumberland County in 2024 (104 in 5+ unit buildings).
- This rent runs 33% of the median local income ($62k/yr) — at the standard rent-burdened threshold; future hikes will face affordability resistance.
Forward outlook
- Local home prices are declining (-3.0%/yr); year-one equity from $1k of loan paydown is wiped out by about $5k of value loss. Plan a longer hold.
Negotiation context
- It's been on market 55 days — a 3% lower offer ($160k) is reasonable based on typical stale-listing flexibility.
- Current owner paid $74k; list at $165k implies a 123% gain — meaningful room to come down on a strong offer.
Risks & watch-outs
- Climate carrying-cost: major wind risk, 74% chance of damaging wind over 30y; moderate wildfire risk; extreme-heat days projected 7→16/yr by 2055 (HVAC capex compounding) — expect insurance premiums to compound above CPI over the hold.
Questions for the listing agent
- It's been on market 55 days. Have you received any prior offers? Is the seller open to a 3% concession, seller financing, or rate buy-down credit?
- Is there a deadline driving the sale (1031 exchange, divorce, estate, relocation)? That informs how much negotiation room exists.
- Crime grade is F in this area — have there been break-ins, vandalism, or insurance claims at this property in the last 3 years? What carrier currently insures it and at what premium?
- What's the average days-on-market for RENTAL listings here right now (not sales)? A rising rental-DOM trend means longer vacancies and softer asking-rent achievability than the comps imply.
- What's the recent tenant-quality profile in this submarket — average credit score on applications, eviction rate, late-payment / NSF rate, and stable-employment percentage? A property-management company in the area should have these aggregated.
- How much new for-sale + rental construction is in the pipeline within 1–3 miles? Heavy new supply typically softens prices + rents 12–24 months out; constrained supply supports both.
Investment metrics
- 1% rule
- 1.04% ✓
- Cap rate
- 8.04%
- Cash-on-cash
- 6.23%
- DSCR
- 1.28
- GRM
- 8.0
CMA / ARV
- ARV (on-the-fly)
- $165,240
- Comps found
- 3
Show comp detail 3 sales within ~0.75 mi
| Address | Dist | Beds/Ba | Sqft | Sold | Price | $/sf | Match |
|---|---|---|---|---|---|---|---|
| 7353 April Dr | 0.00mi | 3/2.0 | 1,619 (-0%) | 1mo | $165,000 | $102 | 95 |
| 7350 April Dr | 0.03mi | 3/2.0 | 1,620 (0%) | 8mo | $170,000 | $105 | 88 |
| 7325 April Dr | 0.11mi | 3/2.0 | 1,512 (-7%) | 22mo | $146,000 | $97 | 62 |
Match score weights: distance 35% · size 25% · config 20% · recency 20%. Top-matched comps best support the ARV.
Projected returns pro-forma
-3.0% appreciation · 3.11% rent growth · sell at horizon
- IRR
- -6.6%
- Equity multiple
- 0.76×
- Total profit
- $-11,269
- Equity at exit
- $24,602
- IRR
- 3.2%
- Equity multiple
- 1.23×
- Total profit
- $10,661
- Equity at exit
- $14,266
Cash invested: $46,200 (down + closing). Projections, not guarantees.
Landlord ↔ Tenant lean methodology
- Overall (STATE)
- 85 Strongly Landlord-Friendly
- State North Carolina
- 85 Strongly Landlord-Friendly · R+3
- County
- — inherits STATE
- City
- — inherits STATE
ZIP-level market 28314
- Home prices YoY
- -15.7%
- Rents YoY
- 3.1%
- Active inventory
- 429
- Price-to-rent
- 8.0×
Monthly cashflow live
- Estimated rent
- $1,709 high interval (Pro) →
- Mortgage (P&I)
- −$865
- Tax from tax record
- −$176 /mo · $2,118/yr
- Insurance
- −$69
- HOA
- −$0
- Vacancy / Maint / Mgmt
- −$359
- Net cashflow
- $240
Break-even live
UW: 25.0% down · 7.5% · 30yr · 1.5% tax · 5.0% vac · 8.0% maint · 8.0% mgmt
Financing live
Cash to close
- Down payment
- $41,250
- Closing costs
- $4,950
- Reserves months
- —
- Total cash needed
- —
Loan-product check · same deal, 3 products live
Conventional
25% down · 7.5% · 30yr
- Down + closing
- —
- Monthly P&I
- —
- Monthly cashflow
- —
- DSCR
- —
- Eligible?
- —
Personal DTI + credit; lowest rate.
DSCR
20% down · 8.5% · 30yr
- Down + closing
- —
- Monthly P&I
- —
- Monthly cashflow
- —
- DSCR
- —
- Eligible?
- —
No personal income docs; deal must DSCR.
Hard money
10% down · 12.0% · 12mo
- Down + closing
- —
- Monthly P&I
- —
- Monthly cashflow
- —
- DSCR
- —
- Eligible?
- —
Short-term bridge; refi at stabilization.
Rent comps 40 comps
| Address | Beds | Baths | Sqft | Rent | $/sqft | DOM | Units | Dist |
|---|---|---|---|---|---|---|---|---|
| 581 Abbotts Landing Dr Fayetteville, NC | 1.0–3.0 | 1.0–2.0 | 918 | $1,525 | $1.66 | 13d | 6 | 0.20mi |
| 5101 ParcStone Ln Fayetteville, NC | 1.0–3.0 | 1.0–2.0 | 1029 | $1,755 | $1.71 | 13d | 12 | 0.34mi |
| 8250 Cliffdale Rd Fayetteville, NC | 3.0–4.0 | 2.0–2.5 | 1405 | $1,875 | $1.33 | 23d | 4 | 0.38mi |
| 7023 Salinas Ct Fayetteville, NC | 3.0 | 2.0 | 1308 | $1,495 | $1.14 | 13d | 1 | 0.43mi |
| 1308 Braybrooke Pl Fayetteville, NC | 3.0 | 2.5 | 1810 | $1,900 | $1.05 | 23d | 1 | 0.46mi |
| 7903 Cliffdale Rd Fayetteville, NC | 1.0–2.0 | 1.0–2.0 | 900 | $1,350 | $1.50 | 13d | 2 | 0.46mi |
| 8245 Frenchorn Ln Fayetteville, NC | 4.0 | 3.0 | 2100 | $2,200 | $1.05 | 13d | 1 | 0.58mi |
| 1120 Braybrooke Pl Fayetteville, NC | 3.0 | 2.5 | 1806 | $1,800 | $1.00 | 23d | 1 | 0.60mi |
| 7212 Reedy Creek Dr Fayetteville, NC | 3.0 | 2.0 | 1401 | $1,600 | $1.14 | 23d | 1 | 0.68mi |
| 735 Prestige Blvd Fayetteville, NC | 3.0 | 2.0 | 1462 | $1,500 | $1.03 | 23d | 1 | 0.77mi |
| 7311 Bass Dr Fayetteville, NC | 3.0 | 2.0 | 1220 | $1,495 | $1.23 | 23d | 1 | 0.77mi |
| 7281 Pebblebrook Dr Fayetteville, NC | 3.0 | 2.0 | 1405 | $1,700 | $1.21 | 23d | 1 | 0.83mi |
| 6764 Saint Julian Way Fayetteville, NC | 3.0 | 2.0 | 1216 | $1,775 | $1.46 | 23d | 1 | 0.91mi |
| 1274 Arailia Dr Fayetteville, NC | 3.0 | 2.0 | 1230 | $1,575 | $1.28 | 23d | 1 | 0.94mi |
| 1267 Exeter Ln Fayetteville, NC | 3.0 | 2.0 | 1228 | $1,545 | $1.26 | 13d | 1 | 0.95mi |
| 6794 Saint Julian Way Fayetteville, NC | 3.0 | 2.0 | 1345 | $1,800 | $1.34 | 23d | 1 | 1.02mi |
| 9330 Castle Falls Cir Fayetteville, NC | 3.0 | 2.0 | 1120 | $1,600 | $1.43 | 21d | 1 | 1.05mi |
| 6824 Saint Julian Way Fayetteville, NC | 3.0 | 2.5 | 1591 | $1,850 | $1.16 | 23d | 1 | 1.08mi |
| 892 Kingscote Dr Fayetteville, NC | 3.0 | 2.5 | 1566 | $1,795 | $1.15 | 23d | 1 | 1.16mi |
| 905 Kingscote Dr Fayetteville, NC | 3.0 | 2.5 | 1566 | $1,795 | $1.15 | 23d | 1 | 1.17mi |
| 4811 Cellner Dr Fayetteville, NC | 2.0–3.0 | 2.0 | 1100 | $1,375 | $1.25 | 13d | 5 | 1.19mi |
| 910 Kingscote Dr Fayetteville, NC | 3.0 | 2.5 | 1566 | $1,795 | $1.15 | 23d | 1 | 1.19mi |
| 6811 Mangrove Dr Fayetteville, NC | 4.0 | 2.5 | 1859 | $1,895 | $1.02 | 23d | 1 | 1.19mi |
| 7312 Navarro St Fayetteville, NC | 3.0 | 2.0 | 1448 | $1,650 | $1.14 | 23d | 1 | 1.21mi |
| 6837 Woodmark Dr Fayetteville, NC | 3.0 | 2.0 | 1450 | $1,700 | $1.17 | 13d | 1 | 1.22mi |
| 6413 Brookshire St Fayetteville, NC | 3.0 | 2.0 | 1780 | $1,800 | $1.01 | 23d | 1 | 1.24mi |
| 6605 Omni Ct Fayetteville, NC | 3.0 | 2.0 | 1542 | $1,550 | $1.01 | 23d | 1 | 1.25mi |
| 1011 Kingscote Dr Fayetteville, NC | 4.0 | 2.5 | 1566 | $1,945 | $1.24 | 23d | 1 | 1.28mi |
| 6440 Brookshire St Fayetteville, NC | 3.0 | 2.0 | 1289 | $1,525 | $1.18 | 23d | 1 | 1.29mi |
| 5346 Greystoke Pl Fayetteville, NC | 3.0 | 2.5 | 1566 | $1,795 | $1.15 | 23d | 1 | 1.31mi |
| 6864 Big Wood Rd Fayetteville, NC | 3.0 | 2.0 | 1634 | $1,650 | $1.01 | 23d | 1 | 1.36mi |
| 1328 Butterwood Cir Fayetteville, NC | 3.0 | 2.0 | 1302 | $1,395 | $1.07 | 23d | 1 | 1.36mi |
| 6901 Woodmark Dr Fayetteville, NC | 3.0 | 2.0 | 1300 | $1,550 | $1.19 | 13d | 1 | 1.36mi |
| 7126 Kearny Ave Fayetteville, NC | 3.0 | 2.0 | 1337 | $1,600 | $1.20 | 23d | 1 | 1.36mi |
| 1108 Patrick Dr Fayetteville, NC | 3.0 | 2.0 | 1132 | $1,800 | $1.59 | 23d | 1 | 1.42mi |
| 604 Bangor Ct Fayetteville, NC | 3.0 | 2.0 | 1464 | $1,600 | $1.09 | 23d | 1 | 1.46mi |
| 6916 Kizer Dr Fayetteville, NC | 3.0 | 2.0 | 1088 | $1,375 | $1.26 | 23d | 1 | 1.46mi |
| 1215 Patrick Dr Fayetteville, NC | 3.0 | 2.5 | 1760 | $1,795 | $1.02 | 23d | 1 | 1.48mi |
| 1113 Oakstone Dr Fayetteville, NC | 4.0 | 2.5 | 1760 | $1,750 | $0.99 | 23d | 1 | 1.49mi |
| 6758 Seaford Dr Fayetteville, NC | 3.0 | 2.0 | 1284 | $1,450 | $1.13 | 23d | 1 | 1.49mi |
Listing history 4 events
-
2026-04-19status Pending
-
2026-04-17price $165,000
-
2026-02-23$160,000 Active
-
2007-02-05soldstatus $74,000
ⓘ Source: listings_history table (triggers on properties + properties_extension) + one-shot
backfill from property_details.listing_events for pre-trigger history.
Tax reassessment forecast NC · Resets to sale price
- Current annual tax
- $2,118 · $176/mo
- Projected year-2 tax
- $2,118 · $176/mo
- Expected delta
- $0/yr ($0/mo · 0.0%)
ⓘ Screening estimate from a state-policy table — verify with the county assessor before closing.
Climate risk First Street
- Flood 3/10 Moderate FEMA zone X (unshaded) · 20% chance over 30 yrs
- Wildfire 5/10 Major
- Heat 7/10 Severe 7 d/yr ≥106°F today · 16 d/yr by 30 yrs out
- Wind 6/10 Major 74% chance of damaging wind over 30 yrs
- Air quality 2/10 Low 0 unhealthy d/yr today · 1 by 30 yrs out
Nearby sold comps map
Loading sold comps map…
Walkable amenities ~0.75 mi
Loading nearby amenities…
Taxation est. · year 1
- Rental income
- $20,510
- − Mortgage interest
- −$9,243
- − Property taxes
- −$2,118
- − Insurance
- −$825
- − Repairs & maintenance
- −$1,641
- − Management
- −$1,641
- − Depreciation
- −$4,800
- Taxable income
- $244
- Est. tax owed @ 24.0%
- −$58
- After-tax cash flow
- $2,819/yr
For passive investors: Depreciation is non-cash, so a rental often shows a tax loss while cash-flowing — sheltering income. Rental losses are passive: they offset passive income freely, and up to $25,000/yr can offset ordinary (W-2) income if you actively participate and your MAGI is under $100k (phasing out to $0 by $150k); unused losses carry forward. On sale, claimed depreciation is recaptured at up to 25%, and gains may owe capital-gains tax (a 1031 exchange can defer both). Figures are a year-1 estimate at your 24.0% rate — not tax advice; consult a CPA.
Schools (NCES district)
- District
- Cumberland County Schools
- NCES district ID
- 3700011
- Math proficiency
- 32% ▼ -2.00%
- Reading proficiency
- 41% ▼ -1.00%
- Median HH income
- $44,168
- Composite
- 31.0/100
- National rank
- #6096
- State rank
- #126 of 178 in NC
Livability — Fayetteville
- Score
- 75/100
- State rank
- #45
- US rank
- #4031
Category grades
Schools grade is shown separately in the Schools card above.
Census & demographics
- Census place
- Fayetteville, NC
- County
- Cumberland County · 265,314 people
- City population
- 226,118
- Metro
- Fayetteville, NC
- Population (ZIP)
- 55,834
- Household income
- $62,249
- Rent vs Own
- Severe rent burden
- 2511.0
Population outlook (Cumberland County) Hauer SSP2
- Today (2025)
- 330,855 people
- By 2030
- 333,523 · +0.8%
- By 2040
- 335,583 · +1.4%
- By 2050
- 335,325 · +1.4%
- By 2075
- 342,853 · +3.6%
- By 2100
- 340,698 · +3.0%
Race, ethnicity, and origin ACS 2023
- Neighborhood character
- Diverse neighborhood (Simpson 0.67)
- Race & ethnicity
- Black 49% White 25% Hispanic / Latino 16% Two or more races 11% Asian 3%
- Hispanic origin (detail)
- Mexican 5% Puerto Rican 6% Dominican 1%
- Common ancestry
- Slovak 1% Romanian 1% Lithuanian 1%
- Foreign-born
- 9% · Canada, South Korea
- Languages at home
- 84% English-only · Spanish 10% Korean 1% Other Asian/Pacific 1%
Political lean MEDSL · Cumberland
- 2024 margin
- D (+13.4) · D 56.1% · R 42.7% · Other 1.2%
- 2008→2024 swing
- -4.3pp toward R · 2008: 17.7pp · 2024: 13.4pp
- All cycles
- 2024: D+13.4 2020: D+16.6 2016: D+16.0 2012: D+19.7 2008: D+17.7
Not yet ingested
- Civics
- —
Market trends
- HPI YoY
- ▼ -43.20%
- Current HPI
- 231.873
- Rent YoY
- ▲ 3.11%
- Metro
- Fayetteville, NC
- State GDP YoY
- ▲ 3.28%
- F500 in state
- 26
Industry mix (Fortune 500 HQ in NC)
| Industry | F500 HQs | Revenue |
|---|---|---|
| Financial Services | 2 | $213B |
|
||
| Retail | 2 | $95B |
|
||
| Industrial Conglomerate | 1 | $38B |
|
||
| Metals / Steel | 1 | $35B |
|
||
| Utilities | 1 | $30B |
|
||
| Industrial Machinery | 1 | $19B |
|
||
Price history
+123.0% since first listed4 events — show timeline
- 2026-04-19 Pending — LPRMLS
- 2026-04-17 Price Changed $165,000 LPRMLS
- 2026-02-23 Listed $160,000 LPRMLS
- 2007-02-05 Sold (Public Records) $74,000 Public Records
Property tax history
+6.8%/yrLatest (2025): $2,118 · +55.1% YoY. Source: county tax records.
Cash-flow waterfall
monthlySold comps — $/sqft
last 12 mo · ≤1 miLoading sold comps…