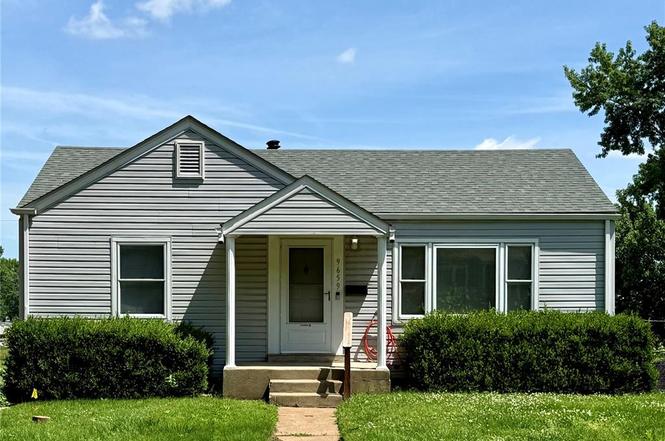
9659 Margo Ann Ln · Woodson Terrace, MO
Flood risk 1/10 · Minimal
- FEMA flood zone
- X (unshaded)
- Chance of flooding over 30 yrs
- 0.0%
- Est. flood insurance / yr
- $473 – $860
Fire risk 1/10 · Minimal
- Est. fire insurance / yr
- $1,054 – $1,958
Heat risk 4/10 · Minor
- Hot days now (above 106°F)
- 7 days/yr
- Hot days in 30 yrs
- 21 days/yr
Wind risk 2/10 · Minimal
- Chance of severe wind over 30 yrs
- 1.0%
Air-quality risk 2/10 · Minimal
- Unhealthy air days now
- 1 days/yr
- Unhealthy air days in 30 yrs
- 3 days/yr
Risk factors via First Street. Map © Google.
Why this score? — see what drove the D+ grade
The composite is a weighted blend of 9 inputs, each scored 0–100. Each bar is that input's sub-score; the figure is the points it added to the 100-point composite (weight × sub-score).
- Cash flow +23.4/30.0
- DSCR +7.5/10.0
- 1% rule +5.8/10.0
- Livability +3.2/5.0
- Rent growth +2.9/5.0
- Condition / age +2.5/5.0
- Schools +1.7/10.0
- ARV discount +0.2/15.0
- Appreciation +0.0/10.0
$160,000
🖨 Deal sheet 📄 Offer letter ✓ Due diligence
Listing remarks MLS
Look at this perfect little starter home, great for someone looking to downsize or an investor! 3 bedroom, 2 full bathroom. Interior has hardwood floors in living room and bedrooms. One bedroom has carpet. Kitchen is bright and spacious. Full basement with finish. Large yard. Just needs your buyer's finishing touches to make this house, a home!
Key facts
- Attached carport
- Massive outbuilding
- Wood burning stove
Tags
Property features AI
Exterior
- Parking: Has a 1-space carport
- Utilities: Public water; Public sewer; Electricity connected (Ameren); Natural gas connected
- Home design: Single-family residence; One level
- Construction: Vinyl siding
- Exterior features: Back yard
Interior
- Bedrooms: Three bedrooms, all on the main level
- Bathrooms: Two full bathrooms, both on the main level
- Heating & cooling: Forced air heating; Central air conditioning
- Interior features: Partially finished walk-out basement; Wood burning stove fireplace (1)
Neighborhood map
What this means for you Summary
Snapshot
- This is a 4-bed/2.0-bath single-family listed at $160k.
Deal economics
- At list price, monthly cash flow is $296 ($4k/yr) — positive.
- The deal already cash-flows at list — no discount required.
- Meets the 1% rule at list price ($2k rent vs $160k).
Location & tenants
- Location reads 65/100 on livability (#269 in MO) — a middle-class / working-renter tenant base. Strengths: cost of living A+, housing A+, commute A; Watch: amenities F, health & safety F.
- Ritenour (suburban): math 13% / reading 27% proficiency, ranked #304 of 324 in MO (top 94%) — low school quality limits family demand, transient renter base, plan for 1-2y turnover; 66% free/reduced lunch — lower-income household profile, screen leases tightly.
- Zoned schools: Kratz Elem. (math 9% / reading 25%, grade F, #967 of 1,115 statewide, top 88%, 538 students, 99% FRL); Ritenour Sr. High (math 9% / reading 36%, grade F, #455 of 521 statewide, top 88%, 1,873 students, 100% FRL) — zoned schools average 100% FRL vs 66% district-wide (34 pts higher); higher-poverty schools than district average — tighter screening recommended.
- Market conditions: Rents rising (+1.6%/yr); 70 active listings in the ZIP; 9 comparable units currently listed for rent nearby; rentals at typical pace (median 24d on market — plan ~3-4 weeks tenant-placement turnaround); 44% of comp listings sitting > 30 days — soft ceiling on asking rent; lower-income renter base — watch delinquency; 920 units permitted in St. Louis County in 2024 (250 in 5+ unit buildings).
- At $1,735/mo this rent would consume 47% of the median local household income ($45k/yr) (locally 655% of renters already pay >50% of income on rent) — very limited rent-growth headroom before tenants either downsize or default.
Forward outlook
- Local home prices are declining (-3.0%/yr); year-one equity from $1k of loan paydown is wiped out by about $5k of value loss. Plan a longer hold.
Negotiation context
- Only 1 days on market — expect competitive offers; lowballing is unlikely to land.
- Current owner paid $65k; list at $160k implies a 146% gain — meaningful room to come down on a strong offer.
Risks & watch-outs
- Watch-outs: built in 1950 — expect roof / HVAC / electrical / plumbing capex.
Questions for the listing agent
- Built in 1950 — when were the roof, HVAC, electrical panel, plumbing, and water heater last replaced?
- Is there a deadline driving the sale (1031 exchange, divorce, estate, relocation)? That informs how much negotiation room exists.
- Schools are D-rated, which usually means shorter tenancies and higher turnover. Who's the typical renter profile here, and what's been the actual vacancy rate?
- The area grade is low — what's the realistic commute time and amenity access for the typical tenant pool here? Any planned neighborhood developments (good or bad) we should know about?
- What's the average days-on-market for RENTAL listings here right now (not sales)? A rising rental-DOM trend means longer vacancies and softer asking-rent achievability than the comps imply.
- What's the recent tenant-quality profile in this submarket — average credit score on applications, eviction rate, late-payment / NSF rate, and stable-employment percentage? A property-management company in the area should have these aggregated.
- How much new for-sale + rental construction is in the pipeline within 1–3 miles? Heavy new supply typically softens prices + rents 12–24 months out; constrained supply supports both.
Investment metrics
- 1% rule
- 1.08% ✓
- Cap rate
- 8.51%
- Cash-on-cash
- 7.92%
- DSCR
- 1.35
- GRM
- 7.7
CMA / ARV
- ARV (on-the-fly)
- $137,588
- Comps found
- 12
Show comp detail 12 sales within ~0.75 mi
| Address | Dist | Beds/Ba | Sqft | Sold | Price | $/sf | Match |
|---|---|---|---|---|---|---|---|
| 9716 Margo Ann Ln | 0.09mi | 3/1.5 (-1) | 1,111 (-5%) | 1mo | $135,000 | $122 | 80 |
| 4423 Dabney Dr | 0.23mi | 3/1.0 (-1) | 1,152 (-1%) | 4mo | $109,900 | $95 | 75 |
| 4411 Edmundson Rd | 0.20mi | 3/1.0 (-1) | 1,104 (-5%) | 1mo | $130,000 | $118 | 72 |
| 3678 Elsa Ave | 0.50mi | 3/1.0 (-1) | 1,170 (+0%) | 1mo | $110,000 | $94 | 66 |
| 4204 Beauty Ln | 0.21mi | 4/1.5 | 1,299 (+11%) | 3mo | $140,000 | $108 | 66 |
| 4053 Jane Ave | 0.45mi | 3/1.0 (-1) | 1,224 (+5%) | 2mo | $114,900 | $94 | 60 |
| 9509 Harold Dr | 0.38mi | 3/1.5 (-1) | 1,257 (+8%) | 5mo | $69,900 | $56 | 58 |
| 4426 Treadway Ln | 0.27mi | 3/1.0 (-1) | 1,008 (-14%) | 1mo | $114,900 | $114 | 55 |
| 3931 Fairway Ct | 0.61mi | 4/1.5 | 1,264 (+8%) | 3mo | $249,900 | $198 | 53 |
| 9513 Margo Ann Ln | 0.27mi | 3/1.0 (-1) | 1,008 (-14%) | 7mo | $165,000 | $164 | 50 |
| 3937 Wright Ave | 0.53mi | 3/1.0 (-1) | 1,082 (-7%) | 6mo | $195,000 | $180 | 49 |
| 9406 Bataan Dr | 0.49mi | 3/1.0 (-1) | 1,037 (-11%) | 3mo | $175,000 | $169 | 48 |
Match score weights: distance 35% · size 25% · config 20% · recency 20%. Top-matched comps best support the ARV.
Projected returns pro-forma
-3.0% appreciation · 1.61% rent growth · sell at horizon
- IRR
- -5.8%
- Equity multiple
- 0.79×
- Total profit
- $-9,485
- Equity at exit
- $23,857
- IRR
- 2.2%
- Equity multiple
- 1.14×
- Total profit
- $6,464
- Equity at exit
- $13,834
Cash invested: $44,800 (down + closing). Projections, not guarantees.
Landlord ↔ Tenant lean methodology
- Overall (STATE)
- 81 Strongly Landlord-Friendly
- State Missouri
- 81 Strongly Landlord-Friendly · R+10
- County
- — inherits STATE
- City
- — inherits STATE
ZIP-level market 63134
- Rents YoY
- 1.6%
- Active inventory
- 70
- Price-to-rent
- 7.7×
Monthly cashflow live
- Estimated rent
- $1,735 high interval (Pro) →
- Mortgage (P&I)
- −$839
- Tax from tax record
- −$169 /mo · $2,028/yr
- Insurance
- −$67
- HOA
- −$0
- Vacancy / Maint / Mgmt
- −$364
- Net cashflow
- $296
Break-even live
UW: 25.0% down · 7.5% · 30yr · 1.5% tax · 5.0% vac · 8.0% maint · 8.0% mgmt
Financing live
Cash to close
- Down payment
- $40,000
- Closing costs
- $4,800
- Reserves months
- —
- Total cash needed
- —
Loan-product check · same deal, 3 products live
Conventional
25% down · 7.5% · 30yr
- Down + closing
- —
- Monthly P&I
- —
- Monthly cashflow
- —
- DSCR
- —
- Eligible?
- —
Personal DTI + credit; lowest rate.
DSCR
20% down · 8.5% · 30yr
- Down + closing
- —
- Monthly P&I
- —
- Monthly cashflow
- —
- DSCR
- —
- Eligible?
- —
No personal income docs; deal must DSCR.
Hard money
10% down · 12.0% · 12mo
- Down + closing
- —
- Monthly P&I
- —
- Monthly cashflow
- —
- DSCR
- —
- Eligible?
- —
Short-term bridge; refi at stabilization.
Rent comps 9 comps
| Address | Beds | Baths | Sqft | Rent | $/sqft | DOM | Units | Dist |
|---|---|---|---|---|---|---|---|---|
| 9807 Guthrie Ave Saint Louis, MO | 3.0 | 2.0 | 1068 | $1,700 | $1.59 | 23d | 1 | 0.20mi |
| 4204 Beauty Ln Saint Louis, MO | 4.0 | 1.5 | 1299 | $1,690 | $1.30 | 44d | 1 | 0.23mi |
| 9457 Harold Dr Saint Louis, MO | 3.0 | 1.0 | 1472 | $1,530 | $1.04 | 22d | 1 | 0.44mi |
| 4400 Gordon Ave Saint Louis, MO | 3.0 | 2.0 | 1500 | $1,800 | $1.20 | 4d | 1 | 0.60mi |
| 9183 Harold Dr Saint Louis, MO | 3.0 | 1.0 | 912 | $1,200 | $1.32 | 44d | 1 | 0.81mi |
| 3434 Sims Ave Saint Ann, MO | 3.0 | 1.5 | 988 | $1,545 | $1.56 | 44d | 1 | 0.91mi |
| 10116 Saint Katherine Ln Saint Ann, MO | 3.0 | 1.0 | 984 | $1,865 | $1.90 | 17d | 1 | 1.07mi |
| 3213 Airway Ave Saint Louis, MO | 3.0 | 1.0 | 1215 | $1,550 | $1.28 | 44d | 1 | 1.16mi |
| 3209 Dix Ave Saint Louis, MO | 3.0 | 1.0 | 1122 | $1,550 | $1.38 | 23d | 1 | 1.22mi |
Listing history 6 events
-
2026-06-18statusdays on market $160,000 Active 1 DOM
-
2026-06-17days on market $160,000 Coming Soon 7 DOM
-
2026-06-16days on market $160,000 Coming Soon 6 DOM
-
2026-06-15days on market $160,000 Coming Soon 5 DOM
-
2026-06-13remarks 693-char remark
-
2026-06-13$160,000 Coming Soon 3 DOM
ⓘ Source: listings_history table (triggers on properties + properties_extension) + one-shot
backfill from property_details.listing_events for pre-trigger history.
Tax reassessment forecast MO · Resets to sale price
- Current annual tax
- $2,028 · $169/mo
- Projected year-2 tax
- $2,028 · $169/mo
- Expected delta
- $0/yr ($0/mo · 0.0%)
ⓘ Screening estimate from a state-policy table — verify with the county assessor before closing.
Climate risk First Street
- Flood 1/10 Low FEMA zone X (unshaded) · 0% chance over 30 yrs
- Wildfire 1/10 Low
- Heat 4/10 Moderate 7 d/yr ≥106°F today · 21 d/yr by 30 yrs out
- Wind 2/10 Low 100% chance of damaging wind over 30 yrs
- Air quality 2/10 Low 1 unhealthy d/yr today · 3 by 30 yrs out
Nearby sold comps map
Loading sold comps map…
Walkable amenities ~0.75 mi
Loading nearby amenities…
Taxation est. · year 1
- Rental income
- $20,815
- − Mortgage interest
- −$8,962
- − Property taxes
- −$2,028
- − Insurance
- −$800
- − Repairs & maintenance
- −$1,665
- − Management
- −$1,665
- − Depreciation
- −$4,655
- Taxable income
- $1,040
- Est. tax owed @ 24.0%
- −$250
- After-tax cash flow
- $3,298/yr
For passive investors: Depreciation is non-cash, so a rental often shows a tax loss while cash-flowing — sheltering income. Rental losses are passive: they offset passive income freely, and up to $25,000/yr can offset ordinary (W-2) income if you actively participate and your MAGI is under $100k (phasing out to $0 by $150k); unused losses carry forward. On sale, claimed depreciation is recaptured at up to 25%, and gains may owe capital-gains tax (a 1031 exchange can defer both). Figures are a year-1 estimate at your 24.0% rate — not tax advice; consult a CPA.
Schools (NCES district)
- District
- Ritenour
- NCES district ID
- 2926640
- Math proficiency
- 13% ▼ -14.00%
- Reading proficiency
- 27% ▼ -7.00%
- Median HH income
- $41,410
- Composite
- 17.04/100
- National rank
- #9125
- State rank
- #304 of 324 in MO
Livability — Woodson Terrace
- Score
- 65/100
- State rank
- #269
- US rank
- #12635
Category grades
Schools grade is shown separately in the Schools card above.
Census & demographics
- Census place
- Woodson Terrace, MO
- County
- Saint Louis County · 888,823 people
- Metro
- St. Louis, MO-IL
- Population (ZIP)
- 13,059
- Household income
- $44,680
- Rent vs Own
- Severe rent burden
- 655.0
Population outlook (St. Louis County) Hauer SSP2
- Today (2025)
- 1,025,227 people
- By 2030
- 1,028,023 · +0.3%
- By 2040
- 1,020,940 · -0.4%
- By 2050
- 1,007,280 · -1.8%
- By 2075
- 987,277 · -3.7%
- By 2100
- 921,984 · -10.1%
Race, ethnicity, and origin ACS 2023
- Neighborhood character
- Predominantly Black (66%)
- Race & ethnicity
- Black 66% White 17% Hispanic / Latino 13% Two or more races 7%
- Hispanic origin (detail)
- Mexican 8%
- Common ancestry
- Lithuanian 1%
- Foreign-born
- 6% · Canada
- Languages at home
- 86% English-only · Spanish 11%
Political lean MEDSL · St. Louis
- 2024 margin
- Strong D (+23.4) · D 60.8% · R 37.4% · Other 1.7%
- 2008→2024 swing
- +3.5pp toward D · 2008: 19.9pp · 2024: 23.4pp
- All cycles
- 2024: D+23.4 2020: D+24.0 2016: D+16.2 2012: D+13.7 2008: D+19.9
Not yet ingested
- Civics
- —
Market trends
- HPI YoY
- ▼ -164.02%
- Current HPI
- 226.9524
- Rent YoY
- ▲ 1.61%
- Metro
- St. Louis, MO-IL
- State GDP YoY
- ▲ 1.84%
- F500 in state
- 20
Industry mix (Fortune 500 HQ in MO)
| Industry | F500 HQs | Revenue |
|---|---|---|
| Healthcare | 1 | $163B |
|
||
| Insurance | 1 | $21B |
|
||
| Industrial Technology | 1 | $17B |
|
||
| Retail | 1 | $16B |
|
||
| Industrial Distribution | 1 | $10B |
|
||
| Utilities | 1 | $9B |
|
||
Price history
+146.2% since first listed6 events — show timeline
- 2026-06-10 Coming Soon $160,000 MARIS as Distributed by MLS Grid
- 2013-12-10 Sold (MLS) — MARIS as Distributed by MLS Grid
- 2013-11-06 Listed $45,999 MARIS as Distributed by MLS Grid
- 2000-09-01 Sold (Public Records) $65,000 Public Records
- 1987-10-01 Sold (Public Records) — Public Records
- 1987-08-01 Sold (Public Records) — Public Records
Property tax history
+2.5%/yrLatest (2022): $2,028 · +0.1% YoY. Source: county tax records.
Cash-flow waterfall
monthlySold comps — $/sqft
last 12 mo · ≤1 miLoading sold comps…