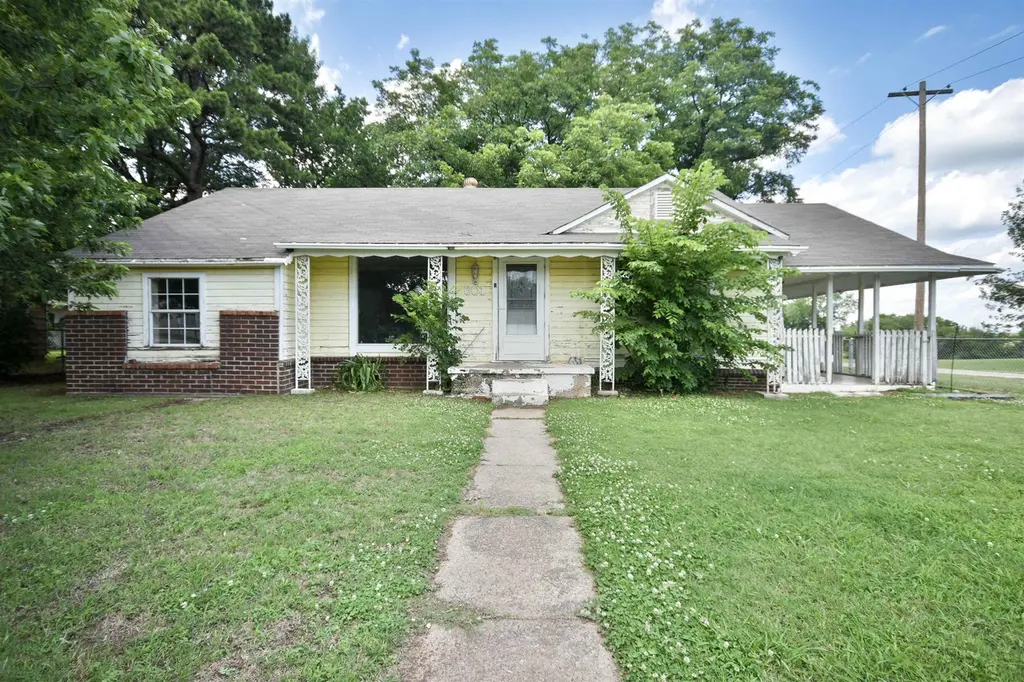
601 North Ave · Comanche, OK
Flood risk 1/10 · Minimal
- FEMA flood zone
- X (unshaded)
- Chance of flooding over 30 yrs
- 0.0%
- Est. flood insurance / yr
- $507 – $1,088
Fire risk 6/10 · Moderate
- Est. fire insurance / yr
- $2,463 – $4,575
Heat risk 7/10 · Major
- Hot days now (above 109°F)
- 7 days/yr
- Hot days in 30 yrs
- 19 days/yr
Wind risk 3/10 · Minor
- Chance of severe wind over 30 yrs
- 8.0%
Air-quality risk 1/10 · Minimal
- Unhealthy air days now
- 0 days/yr
- Unhealthy air days in 30 yrs
- 0 days/yr
Risk factors via First Street. Map © Google.
Why this score? — see what drove the A- grade
The composite is a weighted blend of 9 inputs, each scored 0–100. Each bar is that input's sub-score; the figure is the points it added to the 100-point composite (weight × sub-score).
- Cash flow +30.0/30.0
- ARV discount +15.0/15.0
- 1% rule +10.0/10.0
- DSCR +10.0/10.0
- Appreciation +6.1/10.0
- Livability +3.1/5.0
- Rent growth +2.5/5.0
- Condition / age +2.5/5.0
- Schools +1.6/10.0
$62,500
🖨 Deal sheet 📄 Offer letter ✓ Due diligence
Listing remarks
Investor Special with BIG Potential! Real estate investors, redevelopers, and fix-and-flip specialists — this one is calling your name! This 2 bedroom, 1 bathroom, 1192 sq ft (MOL) home sits on a large corner lot and is packed with possibilities. Features include hardwood flooring, an awesome porch made for porch sitting, and plenty of room to bring your vision to life. Whether you’re looking for your next flip project, a rental property, or a home to make your own — this one gives you options! Priced to sell AS IS so you can add your personal touch and maximize the potential. Flip it. Rent it. Live in it. You decide! Put this house into AI to see what potential it had&hel
Key facts
- Hardwood flooring
- Large corner lot
- Awesome porch
Tags
Property features AI
Exterior
- Utilities: Public water; Public sewer
- Home design: Single-family residence; One story
- Construction: Frame and brick construction; Composition roof
- Exterior features: Patio; Chain-link and fenced yard; Shed(s)
Interior
- Flooring: Hardwood
- Bathrooms: 1 full bathroom
- Interior features: Refrigerator; Hardwood flooring
Neighborhood map
What this means for you Summary
Snapshot
- This is a 2-bed/1.0-bath single-family listed at $62k.
Deal economics
- At list price, monthly cash flow is $434 ($5k/yr) — positive.
- The deal already cash-flows at list — no discount required.
- Meets the 1% rule at list price ($1k rent vs $62k).
- Recommended offer: $62k (1.5% below list) — sets the bar for market timing.
Location & tenants
- Location reads 62/100 on livability (#242 in OK) — a middle-class / working-renter tenant base. Strengths: cost of living A+, housing A+, crime A; Watch: amenities F, commute F, employment F.
- Comanche (rural): math 18% / reading 20% proficiency, ranked #180 of 270 in OK (top 67%) — low school quality limits family demand, transient renter base, plan for 1-2y turnover.
- Zoned schools: Comanche Es (math 22% / reading 22%, grade F, #413 of 845 statewide, top 54%, 427 students, 0% FRL) — zoned schools average 0% FRL vs 49% district-wide (49 pts lower); this property's tenant base skews higher-income than the district average.
- Market conditions: 24 active listings in the ZIP; 17 units permitted in Stephens County in 2024 (0 in 5+ unit buildings).
Forward outlook
- In year one you build about $2k of equity ($432 loan paydown + $1k appreciation (2.3% local appreciation)).
- At projected returns (2.3% appreciation + 3.0% rent growth), your $18k cash investment doubles in ~3 years — after that, you're playing with house money.
Negotiation context
- It's been on market 21 days — a 2% lower offer ($62k) is reasonable based on typical stale-listing flexibility.
- Current owner paid $32k; list at $62k implies a 95% gain — meaningful room to come down on a strong offer.
Risks & watch-outs
- Watch-outs: built in 1955 — expect roof / HVAC / electrical / plumbing capex.
- Climate carrying-cost: major wildfire risk; extreme-heat days projected 7→19/yr by 2055 (HVAC capex compounding) — expect insurance premiums to compound above CPI over the hold.
Questions for the listing agent
- Built in 1955 — when were the roof, HVAC, electrical panel, plumbing, and water heater last replaced?
- Is there a deadline driving the sale (1031 exchange, divorce, estate, relocation)? That informs how much negotiation room exists.
- Schools are F-rated, which usually means shorter tenancies and higher turnover. Who's the typical renter profile here, and what's been the actual vacancy rate?
- What's the average days-on-market for RENTAL listings here right now (not sales)? A rising rental-DOM trend means longer vacancies and softer asking-rent achievability than the comps imply.
- What's the recent tenant-quality profile in this submarket — average credit score on applications, eviction rate, late-payment / NSF rate, and stable-employment percentage? A property-management company in the area should have these aggregated.
- How much new for-sale + rental construction is in the pipeline within 1–3 miles? Heavy new supply typically softens prices + rents 12–24 months out; constrained supply supports both.
Investment metrics
- 1% rule
- 1.64% ✓
- Cap rate
- 14.62%
- Cash-on-cash
- 29.73%
- DSCR
- 2.32
- GRM
- 5.1
CMA / ARV
- ARV (on-the-fly)
- $85,824
- Comps found
- 8
Show comp detail 8 sales within ~0.75 mi
| Address | Dist | Beds/Ba | Sqft | Sold | Price | $/sf | Match |
|---|---|---|---|---|---|---|---|
| 620 Clark Ave | 0.10mi | 2/1.0 | 1,062 (-11%) | 2mo | $109,000 | $103 | 76 |
| 504 Wilson Ave | 0.11mi | 3/1.0 (+1) | 1,120 (-6%) | 8mo | $65,000 | $58 | 73 |
| 506 Wilson Ave | 0.10mi | 2/2.0 | 1,200 (+1%) | 23mo | $39,900 | $33 | 71 |
| 607 N 7th | 0.13mi | 2/1.0 | 1,032 (-13%) | 6mo | $84,700 | $82 | 66 |
| 621 Grimes Ave | 0.08mi | 2/1.0 | 1,071 (-10%) | 18mo | $45,000 | $42 | 64 |
| 613 Grimes Ave | 0.07mi | 3/2.0 (+1) | 1,115 (-6%) | 24mo | $110,000 | $99 | 57 |
| 303 Walnut Ave | 0.51mi | 3/1.0 (+1) | 1,144 (-4%) | 9mo | $72,500 | $63 | 57 |
| 202 Walnut Ave | 0.56mi | 2/1.0 | 1,234 (+4%) | 17mo | $89,000 | $72 | 53 |
Match score weights: distance 35% · size 25% · config 20% · recency 20%. Top-matched comps best support the ARV.
Projected returns pro-forma
2.27% appreciation · 3.0% rent growth · sell at horizon
- IRR
- 34.3%
- Equity multiple
- 2.87×
- Total profit
- $32,750
- Equity at exit
- $25,577
- IRR
- 35.2%
- Equity multiple
- 5.62×
- Total profit
- $80,913
- Equity at exit
- $37,556
Cash invested: $17,500 (down + closing). Projections, not guarantees.
Landlord ↔ Tenant lean methodology
- Overall (STATE)
- 83 Strongly Landlord-Friendly
- State Oklahoma
- 83 Strongly Landlord-Friendly · R+20
- County
- — inherits STATE
- City
- — inherits STATE
ZIP-level market 73529
- Home prices YoY
- 0.9%
- Active inventory
- 24
- Price-to-rent
- 5.1×
Monthly cashflow live
- Estimated rent
- $1,024 medium interval (Pro) →
- Mortgage (P&I)
- −$328
- Tax from tax record
- −$22 /mo · $259/yr
- Insurance
- −$26
- HOA
- −$0
- Vacancy / Maint / Mgmt
- −$215
- Net cashflow
- $434
Break-even live
UW: 25.0% down · 7.5% · 30yr · 1.5% tax · 5.0% vac · 8.0% maint · 8.0% mgmt
Financing live
Cash to close
- Down payment
- $15,625
- Closing costs
- $1,875
- Reserves months
- —
- Total cash needed
- —
Loan-product check · same deal, 3 products live
Conventional
25% down · 7.5% · 30yr
- Down + closing
- —
- Monthly P&I
- —
- Monthly cashflow
- —
- DSCR
- —
- Eligible?
- —
Personal DTI + credit; lowest rate.
DSCR
20% down · 8.5% · 30yr
- Down + closing
- —
- Monthly P&I
- —
- Monthly cashflow
- —
- DSCR
- —
- Eligible?
- —
No personal income docs; deal must DSCR.
Hard money
10% down · 12.0% · 12mo
- Down + closing
- —
- Monthly P&I
- —
- Monthly cashflow
- —
- DSCR
- —
- Eligible?
- —
Short-term bridge; refi at stabilization.
Listing history 20 events
-
2026-06-19days on market $62,500 Active 21 DOM
-
2026-06-18days on market $62,500 Active 20 DOM
-
2026-06-17days on market $62,500 Active 19 DOM
-
2026-06-16days on market $62,500 Active 18 DOM
-
2026-06-15days on market $62,500 Active 17 DOM
-
2026-06-14days on market $62,500 Active 15 DOM
-
2026-06-12days on market $62,500 Active 14 DOM
-
2026-06-09days on market $62,500 Active 11 DOM
-
2026-06-08days on market $62,500 Active 10 DOM
-
2026-06-07days on market $62,500 Active 9 DOM
-
2026-06-05days on market $62,500 Active 7 DOM
-
2026-06-03days on market $62,500 Active 5 DOM
-
2026-06-02days on market $62,500 Active 4 DOM
-
2026-06-01days on market $62,500 Active 3 DOM
-
2026-05-31days on market $62,500 Active 2 DOM
-
2026-05-29$62,500 Active
-
2026-05-05price $65,000
-
2010-07-28soldstatus $32,000
-
2006-09-05soldstatus $17,500
-
1994-09-19soldstatus $11,000
ⓘ Source: listings_history table (triggers on properties + properties_extension) + one-shot
backfill from property_details.listing_events for pre-trigger history.
Tax reassessment forecast OK · Resets to sale price
- Current annual tax
- $259 · $22/mo
- Projected year-2 tax
- $562 · $47/mo
- Expected delta
- +$304/yr (+$25/mo · 117.2%)
ⓘ Screening estimate from a state-policy table — verify with the county assessor before closing.
Climate risk First Street
- Flood 1/10 Low FEMA zone X (unshaded) · 0% chance over 30 yrs
- Wildfire 6/10 Major
- Heat 7/10 Severe 7 d/yr ≥109°F today · 19 d/yr by 30 yrs out
- Wind 3/10 Moderate 8% chance of damaging wind over 30 yrs
- Air quality 1/10 Low 0 unhealthy d/yr today · 0 by 30 yrs out
Nearby sold comps map
Loading sold comps map…
Walkable amenities ~0.75 mi
Loading nearby amenities…
Taxation est. · year 1
- Rental income
- $12,288
- − Mortgage interest
- −$3,501
- − Property taxes
- −$259
- − Insurance
- −$312
- − Repairs & maintenance
- −$983
- − Management
- −$983
- − Depreciation
- −$1,818
- Taxable income
- $4,431
- Est. tax owed @ 24.0%
- −$1,063
- After-tax cash flow
- $4,139/yr
For passive investors: Depreciation is non-cash, so a rental often shows a tax loss while cash-flowing — sheltering income. Rental losses are passive: they offset passive income freely, and up to $25,000/yr can offset ordinary (W-2) income if you actively participate and your MAGI is under $100k (phasing out to $0 by $150k); unused losses carry forward. On sale, claimed depreciation is recaptured at up to 25%, and gains may owe capital-gains tax (a 1031 exchange can defer both). Figures are a year-1 estimate at your 24.0% rate — not tax advice; consult a CPA.
Schools (NCES district)
- District
- Comanche
- NCES district ID
- 4008460
- Math proficiency
- 18% ▼ -11.00%
- Reading proficiency
- 20% ▼ -9.00%
- Median HH income
- $42,087
- Composite
- 16.32/100
- National rank
- #9210
- State rank
- #180 of 270 in OK
Livability — Comanche
- Score
- 62/100
- State rank
- #242
- US rank
- #16265
Category grades
Schools grade is shown separately in the Schools card above.
Census & demographics
- Census place
- Comanche, OK
- Population (ZIP)
- 4,757
Population outlook (Stephens County) Hauer SSP2
- Today (2025)
- 44,528 people
- By 2030
- 44,300 · -0.5%
- By 2040
- 43,971 · -1.3%
- By 2050
- 43,954 · -1.3%
- By 2075
- 44,982 · +1.0%
- By 2100
- 45,259 · +1.6%
Race, ethnicity, and origin ACS 2023
- Neighborhood character
- Predominantly White (82%)
- Race & ethnicity
- White 82% Two or more races 11% Hispanic / Latino 5% Native American 4%
- Common ancestry
- Slovak 3% Lithuanian 2% Iranian 1%
- Foreign-born
- 0%
- Languages at home
- 99% English-only · Spanish 1%
Political lean MEDSL · Stephens
- 2024 margin
- Solid R (+63.7) · D 17.4% · R 81.0% · Other 1.6%
- 2008→2024 swing
- -11.6pp toward R · 2008: -52.1pp · 2024: -63.7pp
- All cycles
- 2024: R+63.7 2020: R+65.1 2016: R+62.0 2012: R+53.2 2008: R+52.1
Not yet ingested
- Civics
- —
Market trends
- HPI YoY
- ▲ 2.27%
- Current HPI
- 253.0419
- Rent YoY
- —
- Metro
- —
- State GDP YoY
- ▲ 1.55%
- F500 in state
- 6
Industry mix (Fortune 500 HQ in OK)
| Industry | F500 HQs | Revenue |
|---|---|---|
| Energy | 3 | $48B |
|
||
Price history
+468.2% since first listed5 events — show timeline
- 2026-05-29 Listed $62,500 DAOR
- 2026-05-05 Price Changed $65,000 DAOR
- 2010-07-28 Sold (Public Records) $32,000 Public Records
- 2006-09-05 Sold (Public Records) $17,500 Public Records
- 1994-09-19 Sold (Public Records) $11,000 Public Records
Property tax history
-1.0%/yrLatest (2025): $259 · -8.8% YoY. Source: county tax records.
Cash-flow waterfall
monthlySold comps — $/sqft
last 12 mo · ≤1 miLoading sold comps…