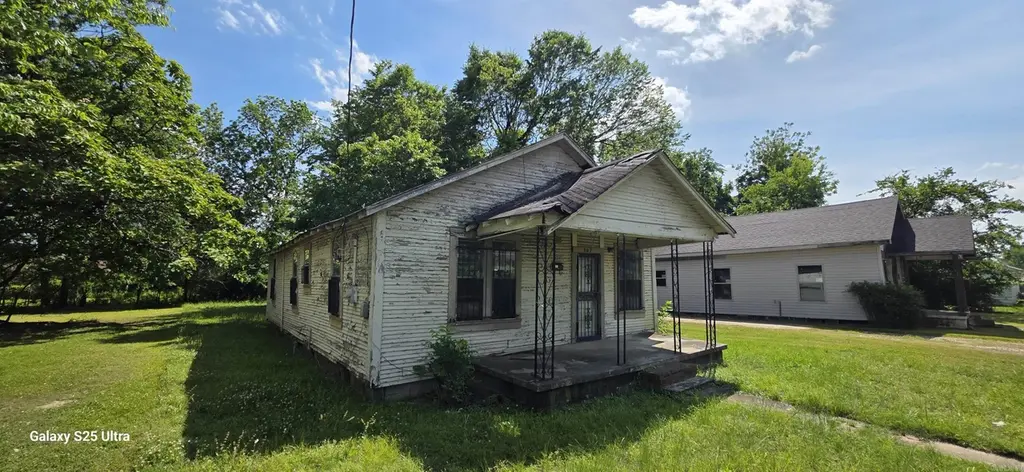
907 Mill St · Conway, AR
Flood risk 1/10 · Minimal
- FEMA flood zone
- X (unshaded)
- Chance of flooding over 30 yrs
- 0.0%
- Est. flood insurance / yr
- $507 – $1,088
Fire risk 4/10 · Minor
- Est. fire insurance / yr
- $1,499 – $2,785
Heat risk 7/10 · Major
- Hot days now (above 111°F)
- 7 days/yr
- Hot days in 30 yrs
- 20 days/yr
Wind risk 3/10 · Minor
- Chance of severe wind over 30 yrs
- 7.0%
Air-quality risk 2/10 · Minimal
- Unhealthy air days now
- 1 days/yr
- Unhealthy air days in 30 yrs
- 1 days/yr
Risk factors via First Street. Map © Google.
Why this score? — see what drove the B grade
The composite is a weighted blend of 9 inputs, each scored 0–100. Each bar is that input's sub-score; the figure is the points it added to the 100-point composite (weight × sub-score).
- Cash flow +30.0/30.0
- 1% rule +10.0/10.0
- DSCR +10.0/10.0
- ARV discount +7.5/15.0
- Schools +3.8/10.0
- Livability +3.5/5.0
- Rent growth +2.8/5.0
- Condition / age +2.5/5.0
- Appreciation +0.0/10.0
$55,000
🖨 Deal sheet 📄 Offer letter ✓ Due diligence
Listing remarks
Prime investment location in the heart of Conway.
Key facts
- Investment location
- Heart of conway
- Detached
Tags
Property features AI
Finance
- Other: Approximate lot size about 7,492 sq ft; Approximate acreage about 0.17 acres
- HOA & community: Annual HOA frequency
Exterior
- Parking: Other parking (see remarks)
- Utilities: Other utilities (see remarks)
- Home design: Inside city limits
- Construction: Wood exterior; Crawl space foundation; Other roof (see remarks)
- Exterior features: Paved road access; Level lot
Interior
- Kitchen: Other kitchen equipment (see remarks)
- Flooring: Wood flooring
- Bathrooms: 1 full bathroom
- Heating & cooling: Other heating and cooling (see remarks)
- Interior features: Wood floors; Other interior features (see remarks)
Neighborhood map
What this means for you Summary
Snapshot
- This is a 1-bed/1.0-bath single-family listed at $55k.
Deal economics
- At list price, monthly cash flow is $369 ($4k/yr) — positive.
- The deal already cash-flows at list — no discount required.
- Meets the 1% rule at list price ($905 rent vs $55k).
- Cap rate 14.3% vs local median 3.9% in Conway — top-decile yield for the area; either an underpriced asset or a hidden risk that comps aren't pricing in. Stress-test before assuming the spread holds.
Location & tenants
- Location reads 69/100 on livability (#71 in AR) — a middle-class / working-renter tenant base. Strengths: cost of living A+, housing A+, schools B; Watch: employment C-, crime F, amenities F.
- Conway School District (urban): math 43% / reading 47% proficiency, ranked #36 of 238 in AR (top 15%) — families likely to look elsewhere, expect single-tenant / working-renter base with shorter leases.
- Market conditions: Rents rising (+1.1%/yr); 187 active listings in the ZIP; 11 comparable units currently listed for rent nearby; rentals at typical pace (median 14d on market — plan ~3-4 weeks tenant-placement turnaround); 865 units permitted in Faulkner County in 2024 (451 in 5+ unit buildings).
- This rent is only 17% of the median local income ($65k/yr) — well below the 30% rent-burden line; pricing power to push rent on renewal without tenant pushback.
Forward outlook
- Local home prices are declining (-3.0%/yr); year-one equity from $380 of loan paydown is wiped out by about $2k of value loss. Plan a longer hold.
- Faulkner County population projected at +32% by 2050 — long-run rental-demand tailwind backs the buy-and-hold thesis.
- At projected returns (-3.0% appreciation + 1.1% rent growth), your $15k cash investment doubles in ~5 years — after that, you're playing with house money.
Negotiation context
- Only 3 days on market — expect competitive offers; lowballing is unlikely to land.
Risks & watch-outs
- Watch-outs: built in 1941 — expect roof / HVAC / electrical / plumbing capex.
- Climate carrying-cost: extreme-heat days projected 7→20/yr by 2055 (HVAC capex compounding) — expect insurance premiums to compound above CPI over the hold.
Questions for the listing agent
- Built in 1941 — when were the roof, HVAC, electrical panel, plumbing, and water heater last replaced?
- Is there a deadline driving the sale (1031 exchange, divorce, estate, relocation)? That informs how much negotiation room exists.
- Schools are B-rated — typically a magnet for longer-tenancy family renters. What's the average tenant stay here, and is there a school-zone premium baked into asking?
- Crime grade is F in this area — have there been break-ins, vandalism, or insurance claims at this property in the last 3 years? What carrier currently insures it and at what premium?
- What's the average days-on-market for RENTAL listings here right now (not sales)? A rising rental-DOM trend means longer vacancies and softer asking-rent achievability than the comps imply.
- What's the recent tenant-quality profile in this submarket — average credit score on applications, eviction rate, late-payment / NSF rate, and stable-employment percentage? A property-management company in the area should have these aggregated.
- How much new for-sale + rental construction is in the pipeline within 1–3 miles? Heavy new supply typically softens prices + rents 12–24 months out; constrained supply supports both.
Investment metrics
- 1% rule
- 1.65% ✓
- Cap rate
- 14.35%
- Cash-on-cash
- 28.76%
- DSCR
- 2.28
- GRM
- 5.1
CMA / ARV
- ARV (on-the-fly)
- $132,480
- Comps found
- 8
Show comp detail 8 sales within ~0.75 mi
| Address | Dist | Beds/Ba | Sqft | Sold | Price | $/sf | Match |
|---|---|---|---|---|---|---|---|
| 525 Second St | 0.56mi | 2/1.0 (+1) | 990 (+3%) | 13mo | $99,000 | $100 | 53 |
| 558 Ingram St | 0.64mi | 2/1.0 (+1) | 1,034 (+8%) | 3mo | $141,000 | $136 | 50 |
| 1612 Duncan St | 0.45mi | 2/2.0 (+1) | 994 (+4%) | 18mo | $180,000 | $181 | 49 |
| 1511 Caldwell St | 0.53mi | 2/1.0 (+1) | 1,072 (+12%) | 6mo | $138,000 | $129 | 46 |
| 1921 Weems St | 0.73mi | 2/2.0 (+1) | 952 (-1%) | 13mo | $199,000 | $209 | 45 |
| 555 Factory St | 0.55mi | 2/1.0 (+1) | 1,092 (+14%) | 2mo | $125,000 | $114 | 45 |
| 1122 Mitchell St | 0.66mi | 2/1.0 (+1) | 1,016 (+6%) | 15mo | $140,000 | $138 | 42 |
| 1351 Davis | 0.59mi | 2/1.0 (+1) | 896 (-7%) | 24mo | $145,000 | $162 | 36 |
Match score weights: distance 35% · size 25% · config 20% · recency 20%. Top-matched comps best support the ARV.
Projected returns pro-forma
-3.0% appreciation · 1.15% rent growth · sell at horizon
- IRR
- 21.0%
- Equity multiple
- 1.84×
- Total profit
- $12,933
- Equity at exit
- $8,201
- IRR
- 28.0%
- Equity multiple
- 3.27×
- Total profit
- $34,960
- Equity at exit
- $4,755
Cash invested: $15,400 (down + closing). Projections, not guarantees.
Landlord ↔ Tenant lean methodology
- Overall (STATE)
- 92 Strongly Landlord-Friendly
- State Arkansas
- 92 Strongly Landlord-Friendly · R+14
- County
- — inherits STATE
- City
- — inherits STATE
ZIP-level market 72032
- Home prices YoY
- -17.0%
- Rents YoY
- 1.1%
- Active inventory
- 187
- Price-to-rent
- 5.1×
Monthly cashflow live
- Estimated rent
- $905 high interval (Pro) →
- Mortgage (P&I)
- −$288
- Tax from tax record
- −$35 /mo · $418/yr
- Insurance
- −$23
- HOA
- −$0
- Vacancy / Maint / Mgmt
- −$190
- Net cashflow
- $369
Break-even live
UW: 25.0% down · 7.5% · 30yr · 1.5% tax · 5.0% vac · 8.0% maint · 8.0% mgmt
Financing live
Cash to close
- Down payment
- $13,750
- Closing costs
- $1,650
- Reserves months
- —
- Total cash needed
- —
Loan-product check · same deal, 3 products live
Conventional
25% down · 7.5% · 30yr
- Down + closing
- —
- Monthly P&I
- —
- Monthly cashflow
- —
- DSCR
- —
- Eligible?
- —
Personal DTI + credit; lowest rate.
DSCR
20% down · 8.5% · 30yr
- Down + closing
- —
- Monthly P&I
- —
- Monthly cashflow
- —
- DSCR
- —
- Eligible?
- —
No personal income docs; deal must DSCR.
Hard money
10% down · 12.0% · 12mo
- Down + closing
- —
- Monthly P&I
- —
- Monthly cashflow
- —
- DSCR
- —
- Eligible?
- —
Short-term bridge; refi at stabilization.
Rent comps 11 comps
| Address | Beds | Baths | Sqft | Rent | $/sqft | DOM | Units | Dist |
|---|---|---|---|---|---|---|---|---|
| 1230 Clifton St Unit 3 Conway, AR | 2.0 | 1.5 | 881 | $880 | $1.00 | 14d | 1 | 0.40mi |
| 1855 McKennon St Unit 7 Conway, AR | 1.0 | 1.0 | 645 | $890 | $1.38 | 23d | 1 | 0.60mi |
| 867 Fendley Dr Conway, AR | 1.0–3.0 | 1.0–2.0 | 957 | $820 | $0.86 | 14d | 5 | 0.82mi |
| 2017 Hairston St Conway, AR | 2.0 | 1.0 | 840 | $2,400 | $2.86 | 23d | 1 | 0.84mi |
| 100 Bill Hegeman Blvd Conway, AR | 1.0–2.0 | 1.0–2.0 | 827 | $945 | $1.14 | 14d | 5 | 1.03mi |
| 2415 Washington Ave Unit A-4 Conway, AR | 2.0 | 1.5 | 885 | $850 | $0.96 | 23d | 1 | 1.18mi |
| 2415 Washington Ave Unit C-2 Conway, AR | 2.0 | 1.5 | 885 | $825 | $0.93 | 14d | 1 | 1.18mi |
| 2400 Market Plaza Dr Conway, AR | 1.0–2.0 | 1.0–2.0 | 768 | $750 | $0.98 | 14d | 2 | 1.24mi |
| 1835 Ott Memorial Dr Conway, AR | 2.0 | 2.0 | 857 | $912 | $1.06 | 14d | 5 | 1.29mi |
| 200 S Ash St Conway, AR | 2.0 | 1.0 | 871 | $800 | $0.92 | 21d | 1 | 1.43mi |
| 114 S Mitchell St Unit A Conway, AR | 2.0 | 2.0 | 1040 | $1,100 | $1.06 | 23d | 1 | 1.44mi |
Listing history 2 events
-
2026-05-08status Under Contract
-
2026-05-04$55,000 New Listing
ⓘ Source: listings_history table (triggers on properties + properties_extension) + one-shot
backfill from property_details.listing_events for pre-trigger history.
Tax reassessment forecast AR · Resets to sale price
- Current annual tax
- $418 · $35/mo
- Projected year-2 tax
- $418 · $35/mo
- Expected delta
- $0/yr ($0/mo · 0.0%)
ⓘ Screening estimate from a state-policy table — verify with the county assessor before closing.
Climate risk First Street
- Flood 1/10 Low FEMA zone X (unshaded) · 0% chance over 30 yrs
- Wildfire 4/10 Moderate
- Heat 7/10 Severe 7 d/yr ≥111°F today · 20 d/yr by 30 yrs out
- Wind 3/10 Moderate 7% chance of damaging wind over 30 yrs
- Air quality 2/10 Low 1 unhealthy d/yr today · 1 by 30 yrs out
Nearby sold comps map
Loading sold comps map…
Walkable amenities ~0.75 mi
Loading nearby amenities…
Taxation est. · year 1
- Rental income
- $10,864
- − Mortgage interest
- −$3,081
- − Property taxes
- −$418
- − Insurance
- −$275
- − Repairs & maintenance
- −$869
- − Management
- −$869
- − Depreciation
- −$1,600
- Taxable income
- $3,753
- Est. tax owed @ 24.0%
- −$901
- After-tax cash flow
- $3,528/yr
For passive investors: Depreciation is non-cash, so a rental often shows a tax loss while cash-flowing — sheltering income. Rental losses are passive: they offset passive income freely, and up to $25,000/yr can offset ordinary (W-2) income if you actively participate and your MAGI is under $100k (phasing out to $0 by $150k); unused losses carry forward. On sale, claimed depreciation is recaptured at up to 25%, and gains may owe capital-gains tax (a 1031 exchange can defer both). Figures are a year-1 estimate at your 24.0% rate — not tax advice; consult a CPA.
Schools (NCES district)
- District
- Conway School District
- NCES district ID
- 0504590
- Math proficiency
- 43% ▼ -17.00%
- Reading proficiency
- 47% ▼ -9.00%
- Median HH income
- $46,270
- Composite
- 38.27/100
- National rank
- #4236
- State rank
- #36 of 238 in AR
Livability — Conway
- Score
- 69/100
- State rank
- #71
- US rank
- #8673
Category grades
Schools grade is shown separately in the Schools card above.
Census & demographics
- Census place
- Conway, AR
- County
- Faulkner County · 103,634 people
- City population
- 84,754
- Metro
- Little Rock-North Little Rock-Conway, AR
- Population (ZIP)
- 34,469
- Household income
- $64,695
- Rent vs Own
- Severe rent burden
- 916.0
Population outlook (Faulkner County) Hauer SSP2
- Today (2025)
- 138,985 people
- By 2030
- 148,264 · +6.7%
- By 2040
- 166,010 · +19.4%
- By 2050
- 183,362 · +31.9%
- By 2075
- 224,593 · +61.6%
- By 2100
- 250,603 · +80.3%
Race, ethnicity, and origin ACS 2023
- Neighborhood character
- Predominantly White (72%)
- Race & ethnicity
- White 72% Black 15% Hispanic / Latino 8% Two or more races 4%
- Hispanic origin (detail)
- Mexican 5%
- Common ancestry
- Slovak 1% Serbian 1% Lithuanian 1%
- Foreign-born
- 5% · Canada
- Languages at home
- 93% English-only · Spanish 6%
Political lean MEDSL · Faulkner
- 2024 margin
- Solid R (+32.3) · D 32.6% · R 64.9% · Other 2.5%
- 2008→2024 swing
- -7.1pp toward R · 2008: -25.3pp · 2024: -32.3pp
- All cycles
- 2024: R+32.3 2020: R+29.5 2016: R+31.6 2012: R+31.7 2008: R+25.3
Not yet ingested
- Civics
- —
Market trends
- HPI YoY
- ▼ -48.15%
- Current HPI
- 234.6331
- Rent YoY
- ▲ 1.15%
- Metro
- Little Rock-North Little Rock-Conway, AR
- State GDP YoY
- ▲ 3.80%
- F500 in state
- 10
Industry mix (Fortune 500 HQ in AR)
| Industry | F500 HQs | Revenue |
|---|---|---|
| Retail | 1 | $681B |
|
||
| Food / Agriculture | 1 | $53B |
|
||
| Retail / Energy | 1 | $22B |
|
||
| Transportation / Logistics | 1 | $12B |
|
||
| Energy | 1 | $4B |
|
||
Price history
2 events — show timeline
- 2026-05-08 Pending — CARMLS
- 2026-05-04 Listed $55,000 CARMLS
Property tax history
+1.9%/yrLatest (2025): $418 · +9.1% YoY. Source: county tax records.
Cash-flow waterfall
monthlySold comps — $/sqft
last 12 mo · ≤1 miLoading sold comps…