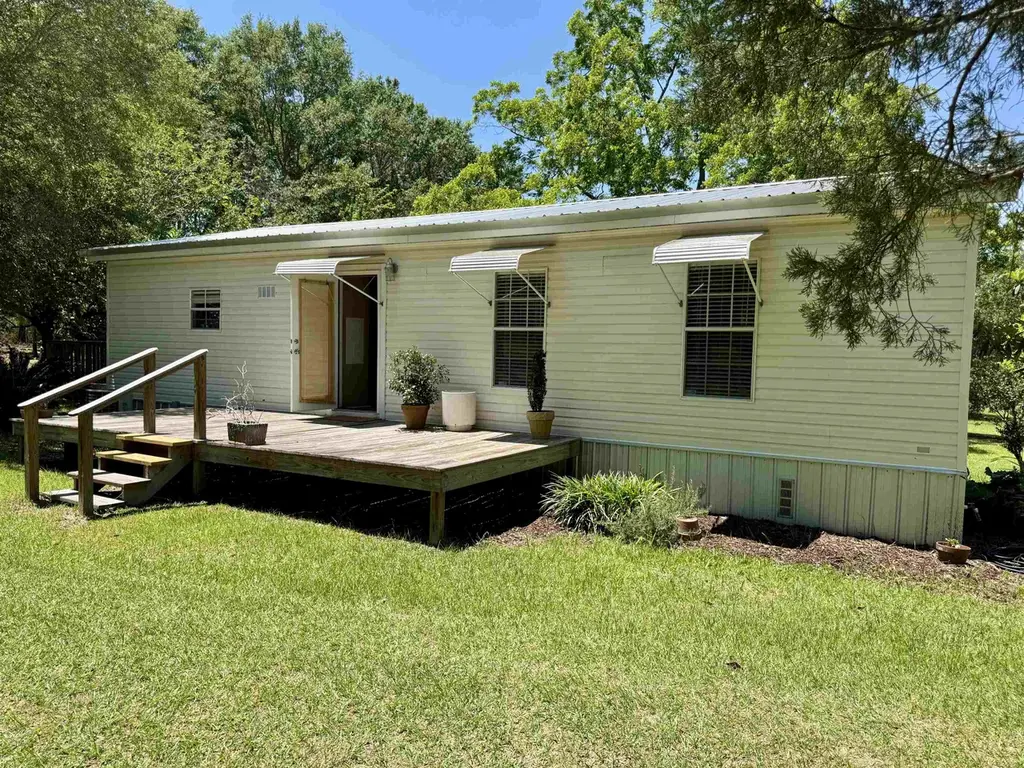
22216 South Ave · Florala, AL
Flood risk 1/10 · Minimal
- FEMA flood zone
- X (unshaded)
- Chance of flooding over 30 yrs
- 0.0%
- Est. flood insurance / yr
- $507 – $1,088
Fire risk 5/10 · Moderate
- Est. fire insurance / yr
- $916 – $1,700
Heat risk 8/10 · Major
- Hot days now (above 106°F)
- 7 days/yr
- Hot days in 30 yrs
- 19 days/yr
Wind risk 9/10 · Severe
- Chance of severe wind over 30 yrs
- 99.0%
Air-quality risk 1/10 · Minimal
- Unhealthy air days now
- 0 days/yr
- Unhealthy air days in 30 yrs
- 0 days/yr
Risk factors via First Street. Map © Google.
Why this score? — see what drove the D+ grade
The composite is a weighted blend of 9 inputs, each scored 0–100. Each bar is that input's sub-score; the figure is the points it added to the 100-point composite (weight × sub-score).
- Cash flow +15.4/30.0
- ARV discount +7.5/15.0
- Appreciation +7.0/10.0
- DSCR +4.7/10.0
- Schools +3.2/10.0
- Livability +3.2/5.0
- 1% rule +3.0/10.0
- Rent growth +2.5/5.0
- Condition / age +2.5/5.0
$119,000
🖨 Deal sheet (PDF) 📄 Offer letter ✓ Due diligence
Listing remarks MLS
Clean and move in ready, 3BR 2BA mobile home on 1/3 of an acre. Walk to lake dock and school! Blocks from boat ramp. Owner financing even with bruised credit! Application available. ,
Key facts
- Included shed
- 0.29 acre lot
- Built 2006
Tags
Property features AI
Exterior
- Utilities: Public water; Sewer available; Electricity available; Cable available
- Home design: Mobile home (single-story)
- Construction: Clayton manufactured home, model 30IVC2444; Mobile home width 44' and length 24'
- Exterior features: Metal roof; Level lot
Interior
- Kitchen: Dishwasher; Range; Refrigerator
- Bathrooms: 2 full bathrooms
- Heating & cooling: Window AC unit(s)
- Interior features: High-speed internet; 8 total rooms
Neighborhood map
What this means for you Summary
Snapshot
- This is a 2-bed/2.0-bath manufactured listed at $119k.
Deal economics
- At list price, monthly cash flow is $47 ($558/yr) — positive.
- The deal already cash-flows at list — no discount required.
- To meet the 1% rule (rent ≥ 1% of price), the offer needs to be $95k (19.9% below list).
- Recommended offer: $95k (19.9% below list) — sets the bar for 1% rule.
Location & tenants
- Location reads 65/100 on livability (#130 in AL) — a middle-class / working-renter tenant base. Strengths: cost of living A+, crime A, housing A-; Watch: health & safety C-, schools F, amenities F.
- Covington County (rural): math 27% / reading 50% proficiency, ranked #32 of 129 in AL (top 25%) — families likely to look elsewhere, expect single-tenant / working-renter base with shorter leases.
- Market conditions: 58 active listings in the ZIP; 13 units permitted in Covington County in 2024 (0 in 5+ unit buildings).
Forward outlook
- In year one you build about $6k of equity ($823 loan paydown + $5k appreciation (4.0% local appreciation)).
- Covington County population projected to shrink 10% by 2050 — rents likely to lag national; underwrite the cash flow, not the appreciation.
- At projected returns (4.0% appreciation + 3.0% rent growth), your $33k cash investment doubles in ~5 years — after that, you're playing with house money.
- By year 7, paydown + projected appreciation supports a ~$35k cash-out refi (75% LTV) — recoverable capital for the next deal without selling this one.
Negotiation context
- It's been on market 30 days — a 2% lower offer ($117k) is reasonable based on typical stale-listing flexibility.
- 3 sale attempts since 9y ago with the ask held roughly flat each time — persistent listings suggest the price (not the market) is what's stuck; bring a comps-based counter.
- Current owner paid $34k; list at $119k implies a 252% gain — meaningful room to come down on a strong offer.
Risks & watch-outs
- Climate carrying-cost: severe wind risk, 99% chance of damaging wind over 30y; moderate wildfire risk; extreme-heat days projected 7→19/yr by 2055 (HVAC capex compounding) — expect insurance premiums to compound above CPI over the hold.
Questions for the listing agent
- Is there a deadline driving the sale (1031 exchange, divorce, estate, relocation)? That informs how much negotiation room exists.
- Schools are F-rated, which usually means shorter tenancies and higher turnover. Who's the typical renter profile here, and what's been the actual vacancy rate?
- The area grade is low — what's the realistic commute time and amenity access for the typical tenant pool here? Any planned neighborhood developments (good or bad) we should know about?
- What's the average days-on-market for RENTAL listings here right now (not sales)? A rising rental-DOM trend means longer vacancies and softer asking-rent achievability than the comps imply.
- What's the recent tenant-quality profile in this submarket — average credit score on applications, eviction rate, late-payment / NSF rate, and stable-employment percentage? A property-management company in the area should have these aggregated.
- How much new for-sale + rental construction is in the pipeline within 1–3 miles? Heavy new supply typically softens prices + rents 12–24 months out; constrained supply supports both.
Investment metrics
- 1% rule
- 0.80% ✗
- Cap rate
- 6.76%
- Cash-on-cash
- 1.68%
- DSCR
- 1.07
- GRM
- 10.4
CMA / ARV
No comps found within radius.
Projected returns pro-forma
3.97% appreciation · 3.0% rent growth · sell at horizon
- IRR
- 11.7%
- Equity multiple
- 1.70×
- Total profit
- $23,477
- Equity at exit
- $60,141
- IRR
- 13.2%
- Equity multiple
- 3.16×
- Total profit
- $71,970
- Equity at exit
- $98,211
Cash invested: $33,320 (down + closing). Projections, not guarantees.
Landlord ↔ Tenant lean methodology
- Overall (STATE)
- 90 Strongly Landlord-Friendly
- State Alabama
- 90 Strongly Landlord-Friendly · R+15
- County
- — inherits STATE
- City
- — inherits STATE
ZIP-level market 36442
- Home prices YoY
- 2.2%
- Active inventory
- 58
- Price-to-rent
- 10.4×
Monthly cashflow live
- Estimated rent
- $953 medium interval (Pro) →
- Mortgage (P&I)
- −$624
- Tax from tax record
- −$32 /mo · $389/yr
- Insurance
- −$50
- HOA
- −$0
- Vacancy / Maint / Mgmt
- −$200
- Net cashflow
- $47
Break-even live
Sensitivity live
| Price | -10% $114 | -5% $80 | +0% $47 | +5% $13 | +10% $-21 |
|---|---|---|---|---|---|
| Rent | -10% $-29 | -5% $9 | +0% $47 | +5% $84 | +10% $122 |
| Rate | -1.0pp $106 | -0.5pp $77 | base $47 | +0.5pp $16 | +1.0pp $-16 |
UW: 25.0% down · 7.5% · 30yr · 1.5% tax · 5.0% vac · 8.0% maint · 8.0% mgmt
Financing live
Cash to close
- Down payment
- $29,750
- Closing costs
- $3,570
- Reserves months
- —
- Total cash needed
- —
Loan-product check · same deal, 3 products live
Conventional
25% down · 7.5% · 30yr
- Down + closing
- —
- Monthly P&I
- —
- Monthly cashflow
- —
- DSCR
- —
- Eligible?
- —
Personal DTI + credit; lowest rate.
DSCR
20% down · 8.5% · 30yr
- Down + closing
- —
- Monthly P&I
- —
- Monthly cashflow
- —
- DSCR
- —
- Eligible?
- —
No personal income docs; deal must DSCR.
Hard money
10% down · 12.0% · 12mo
- Down + closing
- —
- Monthly P&I
- —
- Monthly cashflow
- —
- DSCR
- —
- Eligible?
- —
Short-term bridge; refi at stabilization.
Listing history 21 events
-
2026-06-19days on market $119,000 Active 30 DOM
-
2026-06-18days on market $119,000 Active 29 DOM
-
2026-06-17days on market $119,000 Active 28 DOM
-
2026-06-16days on market $119,000 Active 27 DOM
-
2026-06-15days on market $119,000 Active 26 DOM
-
2026-06-14days on market $119,000 Active 24 DOM
-
2026-06-12days on market $119,000 Active 23 DOM
-
2026-06-09days on market $119,000 Active 20 DOM
-
2026-06-08days on market $119,000 Active 19 DOM
-
2026-06-07days on market $119,000 Active 18 DOM
-
2026-06-07days on market $119,000 Active 17 DOM
-
2026-06-04days on market $119,000 Active 14 DOM
-
2026-06-02days on market $119,000 Active 13 DOM
-
2026-06-01days on market $119,000 Active 12 DOM
-
2026-05-31days on market $119,000 Active 11 DOM
-
2026-05-31days on market $119,000 Active 10 DOM
-
2026-05-20$119,000 Active
-
2018-04-30soldstatus $33,785 183-char remark
Show marketing remark (183 chars)
Clean and move in ready, 3BR 2BA mobile home on 1/3 of an acre. Walk to lake dock and school! Blocks from boat ramp. Owner financing even with bruised credit! Application available. ,
-
2018-04-30soldstatus $33,785 183-char remark
Show marketing remark (183 chars)
Clean and move in ready, 3BR 2BA mobile home on 1/3 of an acre. Walk to lake dock and school! Blocks from boat ramp. Owner financing even with bruised credit! Application available. ,
-
2017-09-13$41,900 183-char remark
Show marketing remark (183 chars)
Clean and move in ready, 3BR 2BA mobile home on 1/3 of an acre. Walk to lake dock and school! Blocks from boat ramp. Owner financing even with bruised credit! Application available. ,
-
2017-09-13$41,900 183-char remark
Show marketing remark (183 chars)
Clean and move in ready, 3BR 2BA mobile home on 1/3 of an acre. Walk to lake dock and school! Blocks from boat ramp. Owner financing even with bruised credit! Application available. ,
ⓘ Source: listings_history table (triggers on properties + properties_extension) + one-shot
backfill from property_details.listing_events for pre-trigger history.
Tax reassessment forecast AL · Resets to sale price
- Current annual tax
- $389 · $32/mo
- Projected year-2 tax
- $488 · $41/mo
- Expected delta
- +$99/yr (+$8/mo · 25.3%)
ⓘ Screening estimate from a state-policy table — verify with the county assessor before closing.
Climate risk First Street
- Flood 1/10 Low FEMA zone X (unshaded) · 0% chance over 30 yrs
- Wildfire 5/10 Major
- Heat 8/10 Severe 7 d/yr ≥106°F today · 19 d/yr by 30 yrs out
- Wind 9/10 Extreme 99% chance of damaging wind over 30 yrs
- Air quality 1/10 Low 0 unhealthy d/yr today · 0 by 30 yrs out
Nearby sold comps map
Loading sold comps map…
Walkable amenities ~0.75 mi
Loading nearby amenities…
Taxation est. · year 1
- Rental income
- $11,432
- − Mortgage interest
- −$6,666
- − Property taxes
- −$389
- − Insurance
- −$595
- − Repairs & maintenance
- −$915
- − Management
- −$915
- − Depreciation
- −$3,462
- Taxable loss
- −$1,509
- Est. tax savings @ 24.0%
- +$362
- After-tax cash flow
- $921/yr
For passive investors: Depreciation is non-cash, so a rental often shows a tax loss while cash-flowing — sheltering income. Rental losses are passive: they offset passive income freely, and up to $25,000/yr can offset ordinary (W-2) income if you actively participate and your MAGI is under $100k (phasing out to $0 by $150k); unused losses carry forward. On sale, claimed depreciation is recaptured at up to 25%, and gains may owe capital-gains tax (a 1031 exchange can defer both). Figures are a year-1 estimate at your 24.0% rate — not tax advice; consult a CPA.
Schools (NCES district)
- District
- Covington County
- NCES district ID
- 0100930
- Math proficiency
- 27% ▼ -21.00%
- Reading proficiency
- 50% ▬ 0.00%
- Median HH income
- $39,213
- Composite
- 32.13/100
- National rank
- #5797
- State rank
- #32 of 129 in AL
Livability — Florala
- Score
- 65/100
- State rank
- #130
- US rank
- #13167
Category grades
Schools grade is shown separately in the Schools card above.
Census & demographics
- Census place
- Florala, AL
- Population (ZIP)
- 3,615
Population outlook (Covington County) Hauer SSP2
- Today (2025)
- 37,007 people
- By 2030
- 36,401 · -1.6%
- By 2040
- 34,983 · -5.5%
- By 2050
- 33,437 · -9.6%
- By 2075
- 29,753 · -19.6%
- By 2100
- 25,109 · -32.2%
Race, ethnicity, and origin ACS 2023
- Neighborhood character
- Predominantly White (83%)
- Race & ethnicity
- White 83% Black 11% Two or more races 4% Hispanic / Latino 2% Asian 1%
- Common ancestry
- Slovak 1% Italian 1% Lithuanian 1%
- Foreign-born
- 1% · Canada
- Languages at home
- 98% English-only · Spanish 2%
Political lean MEDSL · Covington
- 2024 margin
- Solid R (+72.4) · D 13.6% · R 86.0%
- 2008→2024 swing
- -14.1pp toward R · 2008: -58.3pp · 2024: -72.4pp
- All cycles
- 2024: R+72.4 2020: R+68.1 2016: R+68.5 2012: R+58.3 2008: R+58.3
Not yet ingested
- Civics
- —
Market trends
- HPI YoY
- ▲ 3.97%
- Current HPI
- 182.2844
- Rent YoY
- —
- Metro
- —
- State GDP YoY
- ▲ 2.94%
- F500 in state
- 4
Industry mix (Fortune 500 HQ in AL)
| Industry | F500 HQs | Revenue |
|---|---|---|
| Financial Services | 1 | $8B |
|
||
| Healthcare | 1 | $5B |
|
||
Price history
+184.0% since first listed5 events — show timeline
- 2026-05-20 Listed $119,000 CAOR
- 2018-04-30 Sold (MLS) $33,785 WBR
- 2018-04-30 Sold (MLS) $33,785 MAAR
- 2017-09-13 Listed $41,900 WBR
- 2017-09-13 Listed $41,900 MAAR
Property tax history
+5.2%/yrLatest (2025): $389 · +6.9% YoY. Source: county tax records.
Cash-flow waterfall
monthlySold comps — $/sqft
last 12 mo · ≤1 miLoading sold comps…