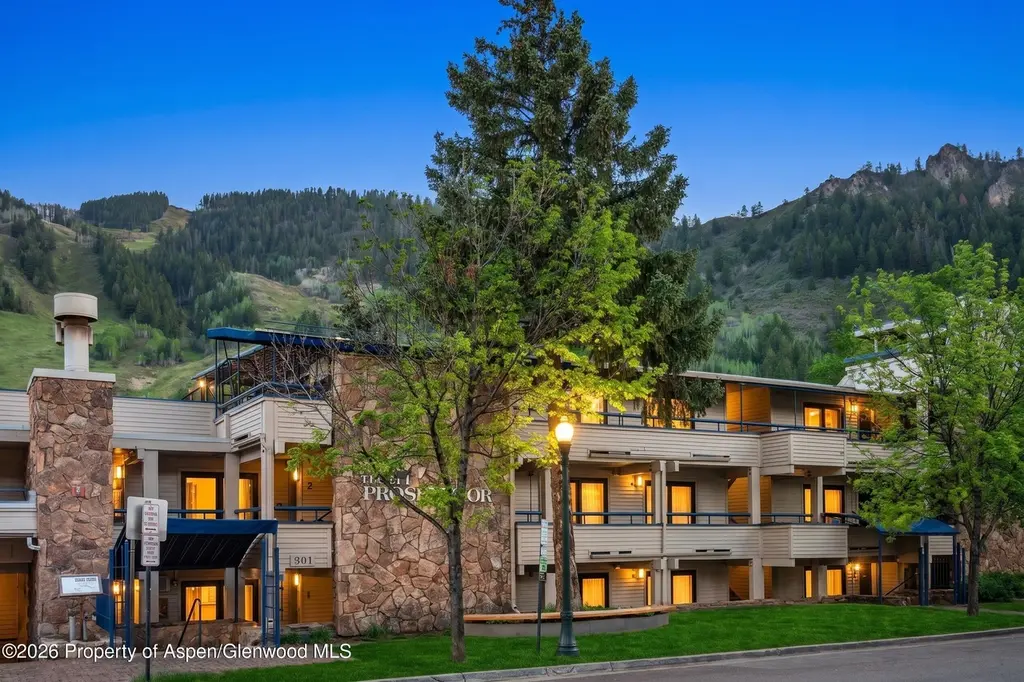
301 E Hyman Ave #202 · Aspen, CO
Flood risk 1/10 · Minimal
- FEMA flood zone
- X (unshaded)
- Chance of flooding over 30 yrs
- 0.0%
- Est. flood insurance / yr
- $473 – $860
Fire risk 3/10 · Minor
- Est. fire insurance / yr
- $939 – $1,743
Heat risk 1/10 · Minimal
- Hot days now (above 76°F)
- 9 days/yr
- Hot days in 30 yrs
- 25 days/yr
Wind risk 1/10 · Minimal
- Chance of severe wind over 30 yrs
- —
Air-quality risk 3/10 · Minor
- Unhealthy air days now
- 2 days/yr
- Unhealthy air days in 30 yrs
- 3 days/yr
Risk factors via First Street. Map © Google.
Why this score? — see what drove the C grade
The composite is a weighted blend of 9 inputs, each scored 0–100. Each bar is that input's sub-score; the figure is the points it added to the 100-point composite (weight × sub-score).
- Cash flow +15.0/30.0
- Appreciation +10.0/10.0
- ARV discount +7.5/15.0
- 1% rule +5.0/10.0
- DSCR +5.0/10.0
- Rent growth +5.0/5.0
- Schools +4.1/10.0
- Livability +3.3/5.0
- Condition / age +2.5/5.0
$85,000
🖨 Deal sheet (PDF) 📄 Offer letter ✓ Due diligence
Listing remarks MLS
DOUBLE THE WEEKS IN DOWNTOWN ASPEN. Own in the heart of Aspen - without the full-time commitment. This fixed 6-week fractional ownership opportunity in Unit 202 at the Prospector (Across from the Wheeler Opera House), places you three blocks from Aspen Mountain, world-class shopping and top-tier dining. Enjoy this 1-bedroom, 2-bath condominium with a private balcony, cozy fireplace and in unit sauna with direct views of the Ajax slopes. Fixed weeks span across all four prime seasons, giving you guaranteed time during some of Aspen's most desirable weeks. The Prospector offers daily housekeeping, concierge service, underground parking and on-site management so you can relax and enjoy. Trade unused weeks through the internal exchange system (RCI) or travel. Whether you're skiing, hiking or attending a festival, this is the easiest way to own a piece of Aspen luxury. Weeks 1-3, (January 1-19th), Aspen's ski season is in full swing across all four mountains, Aspen, Snowmass, Buttermilk and Aspen Highlands as the town is lively with apres-ski, fine dining and boutique shopping as well as Gay Ski Week for a week long celebration of skiing, parties and community events. Week 21 (May 19-25) is Memorial Day Weekend marking the unofficial start of summer in Aspen, with outdoor activities like hiking, biking and rafting and performances at the Wheeler Opera House. Week 24 (June 9-15) in early summer allows for enjoyment of outdoor concerts, art exhibitions and the beginning of the Aspen Music Festival season. Depending on the calendar year, this week may also coincide with the renowned Aspen Food & Wine Classic. Week 41 (October 6-12) is when Aspen's foliage is at its peak, for stunning views, hiking, cultural events and outdoor activities. Additionally, Weeks 1-3 (January 1-19) sometimes align with the Winter X Games, bringing added excitement and energy to town. No car needed as everything is walkable. Underground parking included for convenience. Perfect for ski trips, summer festivals and family vacations. Unused weeks can be traded providing access to luxury destinations worldwide or rented through Prospector Management. Units are stocked and ready for easy enjoyment in a quiet atmosphere, ideal for families and seasoned travelers. Create a family tradition with set weeks, a great way to introduce future generations to mountain living.
Key facts
- Relaxing sauna
- Cozy fireplace
- Daily housekeeping
Tags
Property features AI
Finance
- HOA & community: Association present; Annual association fee of $4,200; Association amenities include management, conference facility, front desk, and locker/ski storage; Association fee covers contingency fund, insurance, management, sewer, unit heat, water, trash, snow removal, and cable TV
Exterior
- Exterior features: Not new construction
Interior
- Bathrooms: 1 full bathroom; 1 half bathroom
- Heating & cooling: Has heating; No cooling
- Interior features: Property in good condition; Condominium
Neighborhood map
What this means for you Summary
Snapshot
- This is a 1-bed/2.0-bath condo listed at $85k.
Deal economics
- At list price, monthly cash flow is $3k ($41k/yr) — positive.
- The deal already cash-flows at list — no discount required.
- Meets the 1% rule at list price ($6k rent vs $85k).
- Recommended offer: $84k (1.5% below list) — sets the bar for market timing.
Location & tenants
- Location reads 66/100 on livability (#142 in CO) — a middle-class / working-renter tenant base. Strengths: commute A+, employment A+, schools B+; Watch: amenities F, cost of living F, health & safety F.
- Aspen School District No. 1 In The County Of Pitkin And Sta (rural): math 36% / reading 56% proficiency, ranked #18 of 86 in CO (top 21%) — families likely to look elsewhere, expect single-tenant / working-renter base with shorter leases; only 4% free/reduced lunch — higher-income household profile.
- Market conditions: Rents rising fast (+22.1%/yr); 324 active listings in the ZIP; solid renter incomes; 145 units permitted in Pitkin County in 2024 (89 in 5+ unit buildings).
- At $5,820/mo this rent would consume 84% of the median local household income ($83k/yr) (locally 566% of renters already pay >50% of income on rent) — very limited rent-growth headroom before tenants either downsize or default.
Forward outlook
- In year one you build about $9k of equity ($588 loan paydown + $8k appreciation (10.0% local appreciation)).
- Pitkin County population projected at +20% by 2050 — long-run rental-demand tailwind backs the buy-and-hold thesis.
- At projected returns (10.0% appreciation + 8.0% rent growth), your $24k cash investment doubles in ~1 year — after that, you're playing with house money.
- By year 4, paydown + projected appreciation supports a ~$32k cash-out refi (75% LTV) — recoverable capital for the next deal without selling this one.
Negotiation context
- It's been on market 20 days — a 2% lower offer ($84k) is reasonable based on typical stale-listing flexibility.
- 2 sale attempts with the ask held roughly flat each time — persistent listings suggest the price (not the market) is what's stuck; bring a comps-based counter.
Risks & watch-outs
- Watch-outs: property tax is 4.8% of price.
Questions for the listing agent
- Property tax is high relative to price — has the assessment been appealed recently, and will the sale trigger a re-assessment?
- What does the HOA fee cover, when was the last increase, and are there any pending special assessments or reserve-fund shortfalls?
- Any open or pending special assessments — roof, HVAC, plumbing, elevator, façade? What's the per-unit balance and payoff schedule, and is the seller paying it off at close or rolling it to the buyer?
- Is there a deadline driving the sale (1031 exchange, divorce, estate, relocation)? That informs how much negotiation room exists.
- Schools are B-rated — typically a magnet for longer-tenancy family renters. What's the average tenant stay here, and is there a school-zone premium baked into asking?
- What's the average days-on-market for RENTAL listings here right now (not sales)? A rising rental-DOM trend means longer vacancies and softer asking-rent achievability than the comps imply.
- What's the recent tenant-quality profile in this submarket — average credit score on applications, eviction rate, late-payment / NSF rate, and stable-employment percentage? A property-management company in the area should have these aggregated.
- How much new apartment / multifamily construction is in the pipeline within 1–3 miles? Heavy new supply (>2% of stock underway) typically softens rents 12–24 months out; light construction supports rent growth.
Investment metrics
- 1% rule
- 6.85% ✓
- Cap rate
- 54.68%
- Cash-on-cash
- 172.83%
- DSCR
- 8.69
- GRM
- 1.2
CMA / ARV
No comps found within radius.
Projected returns pro-forma
10.0% appreciation · 8.0% rent growth · sell at horizon
- IRR
- —
- Equity multiple
- 13.43×
- Total profit
- $295,813
- Equity at exit
- $76,575
- IRR
- —
- Equity multiple
- 33.63×
- Total profit
- $776,519
- Equity at exit
- $165,136
Cash invested: $23,800 (down + closing). Projections, not guarantees.
Landlord ↔ Tenant lean methodology
- Overall (STATE)
- 38 Tenant-Leaning
- State Colorado
- 38 Tenant-Leaning · D+4
- County
- — inherits STATE
- City
- — inherits STATE
ZIP-level market 81611
- Home prices YoY
- 3.6%
- Rents YoY
- 22.1%
- Active inventory
- 324
- Price-to-rent
- 1.2×
Monthly cashflow live
- Estimated rent
- $5,820 medium interval (Pro) →
- Mortgage (P&I)
- −$446
- Tax from tax record
- −$339 /mo · $4,066/yr
- Insurance
- −$35
- HOA
- −$350
- Vacancy / Maint / Mgmt
- −$1,222
- Net cashflow
- $3,428
Break-even live
Sensitivity live
| Price | -10% $3,719 | -5% $3,690 | +0% $3,428 | +5% $3,404 | +10% $3,380 |
|---|---|---|---|---|---|
| Rent | -10% $2,968 | -5% $3,198 | +0% $3,428 | +5% $3,658 | +10% $3,888 |
| Rate | -1.0pp $3,471 | -0.5pp $3,449 | base $3,428 | +0.5pp $3,406 | +1.0pp $3,383 |
UW: 25.0% down · 7.5% · 30yr · 1.5% tax · 5.0% vac · 8.0% maint · 8.0% mgmt
Financing live
Cash to close
- Down payment
- $21,250
- Closing costs
- $2,550
- Reserves months
- —
- Total cash needed
- —
Loan-product check · same deal, 3 products live
Conventional
25% down · 7.5% · 30yr
- Down + closing
- —
- Monthly P&I
- —
- Monthly cashflow
- —
- DSCR
- —
- Eligible?
- —
Personal DTI + credit; lowest rate.
DSCR
20% down · 8.5% · 30yr
- Down + closing
- —
- Monthly P&I
- —
- Monthly cashflow
- —
- DSCR
- —
- Eligible?
- —
No personal income docs; deal must DSCR.
Hard money
10% down · 12.0% · 12mo
- Down + closing
- —
- Monthly P&I
- —
- Monthly cashflow
- —
- DSCR
- —
- Eligible?
- —
Short-term bridge; refi at stabilization.
HOA detail condo
- Monthly dues
- $350 · $4,200/yr
- Likely covers
- doormanparking
- Assessments
- None detected in remarks — confirm with the listing agent.
Listing history 15 events
-
2026-06-19days on market $85,000 Active 20 DOM
-
2026-06-18days on market $85,000 Active 19 DOM
-
2026-06-17days on market $85,000 Active 18 DOM
-
2026-06-16days on market $85,000 Active 17 DOM
-
2026-06-15days on market $85,000 Active 16 DOM
-
2026-06-14days on market $85,000 Active 14 DOM
-
2026-06-12days on market $85,000 Active 13 DOM
-
2026-06-09days on market $85,000 Active 10 DOM
-
2026-06-08days on market $85,000 Active 9 DOM
-
2026-06-07days on market $85,000 Active 8 DOM
-
2026-06-05days on market $85,000 Active 5 DOM
-
2026-06-02days on market $85,000 Active 3 DOM
-
2026-06-01days on market $85,000 Active 2 DOM
-
2026-05-31remarks 688-char remark
-
2026-05-31$85,000 Active 1 DOM
ⓘ Source: listings_history table (triggers on properties + properties_extension) + one-shot
backfill from property_details.listing_events for pre-trigger history.
Tax reassessment forecast CO · Resets to sale price
- Current annual tax
- $4,066 · $339/mo
- Projected year-2 tax
- $4,066 · $339/mo
- Expected delta
- $0/yr ($0/mo · 0.0%)
ⓘ Screening estimate from a state-policy table — verify with the county assessor before closing.
Climate risk First Street
- Flood 1/10 Low FEMA zone X (unshaded) · 0% chance over 30 yrs
- Wildfire 3/10 Moderate
- Heat 1/10 Low 9 d/yr ≥76°F today · 25 d/yr by 30 yrs out
- Wind 1/10 Low
- Air quality 3/10 Moderate 2 unhealthy d/yr today · 3 by 30 yrs out
Nearby sold comps map
Loading sold comps map…
Walkable amenities ~0.75 mi
Loading nearby amenities…
Taxation est. · year 1
- Rental income
- $69,839
- − Mortgage interest
- −$4,761
- − Property taxes
- −$4,066
- − Insurance
- −$425
- − Repairs & maintenance
- −$5,587
- − Management
- −$5,587
- − HOA
- −$4,200
- − Depreciation
- −$2,473
- Taxable income
- $42,740
- Est. tax owed @ 24.0%
- −$10,258
- After-tax cash flow
- $30,876/yr
For passive investors: Depreciation is non-cash, so a rental often shows a tax loss while cash-flowing — sheltering income. Rental losses are passive: they offset passive income freely, and up to $25,000/yr can offset ordinary (W-2) income if you actively participate and your MAGI is under $100k (phasing out to $0 by $150k); unused losses carry forward. On sale, claimed depreciation is recaptured at up to 25%, and gains may owe capital-gains tax (a 1031 exchange can defer both). Figures are a year-1 estimate at your 24.0% rate — not tax advice; consult a CPA.
Schools (NCES district)
- District
- Aspen School District No. 1 In The County Of Pitkin And Sta
- NCES district ID
- 0802280
- Math proficiency
- 36% ▼ -5.00%
- Reading proficiency
- 56% ▼ -3.00%
- Median HH income
- $66,694
- Composite
- 40.98/100
- National rank
- #3595
- State rank
- #18 of 86 in CO
Livability — Aspen
- Score
- 66/100
- State rank
- #142
- US rank
- #11780
Category grades
Schools grade is shown separately in the Schools card above.
Census & demographics
- Census place
- Aspen, CO
- County
- Pitkin County · 9,068 people
- City population
- 9,068
- Metro
- Glenwood Springs, CO
- Population (ZIP)
- 9,068
- Household income
- $82,664
- Rent vs Own
- Severe rent burden
- 566.0
Population outlook (Pitkin County) Hauer SSP2
- Today (2025)
- 20,121 people
- By 2030
- 21,110 · +4.9%
- By 2040
- 22,707 · +12.9%
- By 2050
- 24,105 · +19.8%
- By 2075
- 27,933 · +38.8%
- By 2100
- 30,018 · +49.2%
Race, ethnicity, and origin ACS 2023
- Neighborhood character
- Predominantly White (81%)
- Race & ethnicity
- White 81% Hispanic / Latino 10% Two or more races 7% Asian 4%
- Hispanic origin (detail)
- Mexican 4% Salvadoran 4%
- Common ancestry
- Slovak 3% Iranian 3% Romanian 3%
- Foreign-born
- 15% · Canada, Dominican Republic, China
- Languages at home
- 82% English-only · Spanish 9% Other Indo-European 2% Chinese 2%
Political lean MEDSL · Pitkin
- 2024 margin
- Solid D (+44.2) · D 71.0% · R 26.8% · Other 2.2%
- 2008→2024 swing
- -4.6pp toward R · 2008: 48.8pp · 2024: 44.2pp
- All cycles
- 2024: D+44.2 2020: D+51.9 2016: D+45.4 2012: D+37.9 2008: D+48.8
Not yet ingested
- Civics
- —
Market trends
- HPI YoY
- ▲ 12.97%
- Current HPI
- 370.9593
- Rent YoY
- ▲ 22.07%
- Metro
- Glenwood Springs, CO
- State GDP YoY
- ▲ 1.95%
- F500 in state
- 14
Industry mix (Fortune 500 HQ in CO)
| Industry | F500 HQs | Revenue |
|---|---|---|
| Technology Distribution | 1 | $31B |
|
||
| Food / Agriculture | 1 | $18B |
|
||
| Packaging | 1 | $14B |
|
||
| Healthcare | 1 | $13B |
|
||
| Energy | 1 | $10B |
|
||
| Technology | 1 | $4B |
|
||
Price history
+400.0% since first listed13 events — show timeline
- 2026-05-30 Listed $85,000 AGMLS
- 2025-07-15 Sold (MLS) $95,000 AGMLS
- 2025-05-25 Pending — AGMLS
- 2025-05-20 Price Changed $109,900 AGMLS
- 2025-04-25 Listed $119,500 AGMLS
- 2019-08-01 Sold (MLS) $33,000 AGMLS
- 2019-05-03 Sold (Public Records) $17,500 Public Records
- 2019-05-03 Sold (MLS) $17,500 AGMLS
- 2018-12-10 Sold (MLS) $16,000 AGMLS
- 2017-11-02 Sold (Public Records) $25,000 Public Records
- 2017-11-02 Sold (MLS) $25,000 AGMLS
- 2017-09-07 Sold (MLS) $31,000 AGMLS
- 2002-02-22 Sold (Public Records) $17,000 Public Records
Property tax history
+9.1%/yrLatest (2025): $4,066 · +10.2% YoY. Source: county tax records.
Cash-flow waterfall
monthlySold comps — $/sqft
last 12 mo · ≤1 miLoading sold comps…