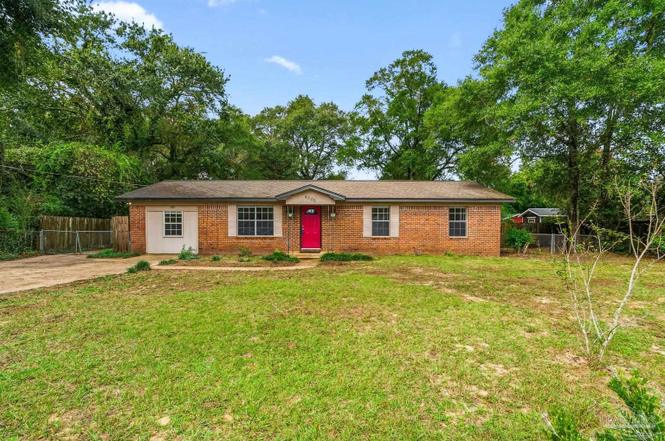
4305 Galt City Rd · Bagdad, FL
Flood risk 8/10 · Major
- FEMA flood zone
- X (unshaded)
- Chance of flooding over 30 yrs
- 0.99%
- Est. flood insurance / yr
- $507 – $1,088
Fire risk 4/10 · Minor
- Est. fire insurance / yr
- $947 – $1,759
Heat risk 10/10 · Severe
- Hot days now (above 105°F)
- 7 days/yr
- Hot days in 30 yrs
- 21 days/yr
Wind risk 9/10 · Severe
- Chance of severe wind over 30 yrs
- 99.0%
Air-quality risk 1/10 · Minimal
- Unhealthy air days now
- 0 days/yr
- Unhealthy air days in 30 yrs
- 0 days/yr
Risk factors via First Street. Map © Google.
Why this score? — see what drove the D grade
The composite is a weighted blend of 9 inputs, each scored 0–100. Each bar is that input's sub-score; the figure is the points it added to the 100-point composite (weight × sub-score).
- Cash flow +13.0/30.0
- ARV discount +8.1/15.0
- Schools +5.3/10.0
- DSCR +3.9/10.0
- Rent growth +3.6/5.0
- Livability +3.4/5.0
- 1% rule +2.9/10.0
- Condition / age +2.5/5.0
- Appreciation +0.0/10.0
$228,000
🖨 Deal sheet (PDF) 📄 Offer letter ✓ Due diligence
Listing remarks MLS
Move-in-ready! Charming 3/2 that has been freshly painted throughout the home. New carpet in the living room and all the bedrooms. New tile flooring installed in the kitchen, hall and bathrooms. Spacious backyard with plenty of room to store a boat or RV!
Key facts
- Spacious backyard
- Converted garage
- Tile flooring
Tags
Property features AI
Finance
- Other: Green energy features: insulation and insulated walls
- HOA & community: No association
Exterior
- Parking: Driveway parking with open parking available
- Utilities: Public water; Septic tank sewer; Circuit breakers and copper wiring for electric; Cable available
- Home design: One-story, ground-floor residence; Resale property; Not attached to other properties
- Construction: Brick and frame construction; Shingle roof; Slab foundation; Building area approximately 1,450 square feet
- Exterior features: Back yard with full privacy and chain link fencing; Yard building (outbuilding); Paved, county-maintained road access; Central access to lot
Interior
- Kitchen: Granite countertops; Self-cleaning oven; Dishwasher; Kitchen and dining combo
- Bedrooms: Two bedrooms on the first floor (approx. 12' x 9.06' and 11.11' x 9.06')
- Flooring: Tile; Carpet
- Bathrooms: Two full bathrooms
- Heating & cooling: Central heating; Central air; Ceiling fans for cooling
- Interior features: Baseboards; Ceiling fan(s); High speed internet; Blinds on windows
- Laundry & utility: Inside laundry with washer/dryer hookups; Electric water heater
Neighborhood map
What this means for you Summary
Snapshot
- This is a 3-bed/2.0-bath single-family listed at $228k.
Deal economics
- At list price, monthly cash flow is $-77 ($-924/yr) — negative.
- To cash-flow at today's rent, offer at most $214k (6.0% below list).
- To meet the 1% rule (rent ≥ 1% of price), the offer needs to be $180k (21.1% below list).
- Recommended offer: $180k (21.1% below list) — sets the bar for 1% rule.
- Cap rate 6.2% vs local median 5.0% in Bagdad — meaningfully above typical; check what's discounted (condition, days-on-market, listing class) to confirm the premium yield is real.
Location & tenants
- Location reads 67/100 on livability (#571 in FL) — a middle-class / working-renter tenant base. Strengths: crime A+, cost of living A+, housing A+; Watch: schools F, amenities F, commute F.
- Santa Rosa (suburban): math 63% / reading 60% proficiency, ranked #8 of 73 in FL (top 11%) — acceptable for families but not a draw, mixed tenant base, ~2y average lease.
- Market conditions: Rents rising fast (+4.5%/yr); 806 active listings in the ZIP; 4 comparable units currently listed for rent nearby; rentals at typical pace (median 25d on market — plan ~3-4 weeks tenant-placement turnaround); solid renter incomes; 1,983 units permitted in Santa Rosa County in 2024 (128 in 5+ unit buildings).
Forward outlook
- Local home prices are declining (-3.0%/yr); year-one equity from $2k of loan paydown is wiped out by about $7k of value loss. Plan a longer hold.
- Santa Rosa County population projected at +31% by 2050 — long-run rental-demand tailwind backs the buy-and-hold thesis.
Negotiation context
- It's been on market 171 days — a 12% lower offer ($201k) is reasonable based on typical stale-listing flexibility.
- 4 sale attempts since 24y ago with the ask held roughly flat each time — persistent listings suggest the price (not the market) is what's stuck; bring a comps-based counter.
- Current owner paid $98k; list at $228k implies a 133% gain — meaningful room to come down on a strong offer.
Risks & watch-outs
- Watch-outs: flood insurance adds $66/mo.
- Climate carrying-cost: severe flood risk; severe wind risk, 99% chance of damaging wind over 30y; extreme-heat days projected 7→21/yr by 2055 (HVAC capex compounding) — expect insurance premiums to compound above CPI over the hold.
Questions for the listing agent
- What do current leases actually rent for vs. the listed asking? Can we see a recent rent roll and the last 12 months of T-12 income?
- It's been on market 171 days. Have you received any prior offers? Is the seller open to a 21% concession, seller financing, or rate buy-down credit?
- Built in 1973 — when were the roof, HVAC, electrical panel, plumbing, and water heater last replaced?
- What's the actual annual flood-insurance premium (NFIP or private), and is the property in a SFHA with mandatory coverage?
- Why hasn't it sold? Are there any deal-killer items the seller is aware of (foundation, flood, title, zoning, code violations)?
- Is there a deadline driving the sale (1031 exchange, divorce, estate, relocation)? That informs how much negotiation room exists.
- Schools are F-rated, which usually means shorter tenancies and higher turnover. Who's the typical renter profile here, and what's been the actual vacancy rate?
- The area grade is low — what's the realistic commute time and amenity access for the typical tenant pool here? Any planned neighborhood developments (good or bad) we should know about?
- What's the average days-on-market for RENTAL listings here right now (not sales)? A rising rental-DOM trend means longer vacancies and softer asking-rent achievability than the comps imply.
- What's the recent tenant-quality profile in this submarket — average credit score on applications, eviction rate, late-payment / NSF rate, and stable-employment percentage? A property-management company in the area should have these aggregated.
- How much new for-sale + rental construction is in the pipeline within 1–3 miles? Heavy new supply typically softens prices + rents 12–24 months out; constrained supply supports both.
Investment metrics
- 1% rule
- 0.79% ✗
- Cap rate
- 6.24%
- Cash-on-cash
- -0.20%
- DSCR
- 0.99
- GRM
- 10.6
CMA / ARV
- ARV (on-the-fly)
- $230,958
- Comps found
- 12
Show comp detail 12 sales within ~0.75 mi
| Address | Dist | Beds/Ba | Sqft | Sold | Price | $/sf | Match |
|---|---|---|---|---|---|---|---|
| 4295 Galt City Rd | 0.02mi | 3/2.0 | 1,161 (-5%) | 13mo | $220,000 | $189 | 80 |
| 6333 Rice St | 0.37mi | 3/2.0 | 1,215 (-1%) | 4mo | $250,000 | $206 | 79 |
| 4281 Tomahawk Trl | 0.11mi | 3/2.0 | 1,356 (+11%) | 8mo | $215,000 | $159 | 70 |
| 4380 Glen Forest Dr | 0.22mi | 3/2.0 | 1,366 (+12%) | 10mo | $256,500 | $188 | 62 |
| 6187 June Bug Dr | 0.59mi | 3/2.0 | 1,205 (-1%) | 14mo | $229,900 | $191 | 59 |
| 6257 Mohawk Trl | 0.30mi | 3/1.5 | 1,356 (+11%) | 11mo | $214,999 | $159 | 57 |
| 6184 June Bug Dr | 0.61mi | 3/2.0 | 1,205 (-1%) | 15mo | $234,900 | $195 | 57 |
| 6361 Firefly Dr | 0.72mi | 3/2.0 | 1,205 (-1%) | 10mo | $249,900 | $207 | 56 |
| 6353 Firefly Dr | 0.74mi | 3/2.0 | 1,205 (-1%) | 10mo | $249,900 | $207 | 55 |
| 6309 Matador St | 0.59mi | 3/2.0 | 1,140 (-7%) | 8mo | $205,000 | $180 | 54 |
| 6246 Glenwood Dr | 0.37mi | 4/1.5 (+1) | 1,300 (+6%) | 14mo | $215,000 | $165 | 54 |
| 5953 Fairlands Rd | 0.66mi | 3/2.0 | 1,358 (+11%) | 0mo | $215,000 | $158 | 50 |
Match score weights: distance 35% · size 25% · config 20% · recency 20%. Top-matched comps best support the ARV.
Projected returns pro-forma
-3.0% appreciation · 4.53% rent growth · sell at horizon
- IRR
- -17.1%
- Equity multiple
- 0.39×
- Total profit
- $-39,058
- Equity at exit
- $33,996
- IRR
- -6.6%
- Equity multiple
- 0.55×
- Total profit
- $-28,506
- Equity at exit
- $19,713
Cash invested: $63,840 (down + closing). Projections, not guarantees.
Landlord ↔ Tenant lean methodology
- Overall (STATE)
- 87 Strongly Landlord-Friendly
- State Florida
- 87 Strongly Landlord-Friendly · R+3
- County
- — inherits STATE
- City
- — inherits STATE
ZIP-level market 32583
- Home prices YoY
- -11.3%
- Rents YoY
- 4.5%
- Active inventory
- 806
- Price-to-rent
- 10.6×
Monthly cashflow live
- Estimated rent
- $1,799 medium interval (Pro) →
- Mortgage (P&I)
- −$1,196
- Tax from tax record
- −$141 /mo · $1,689/yr
- Insurance
- −$95
- Flood insurance flood zone
- −$66 /mo · $798/yr
- HOA
- −$0
- Vacancy / Maint / Mgmt
- −$378
- Net cashflow
- $-77
Break-even live
Sensitivity live
| Price | -10% $52 | -5% $-12 | +0% $-77 | +5% $-142 | +10% $-206 |
|---|---|---|---|---|---|
| Rent | -10% $-219 | -5% $-148 | +0% $-77 | +5% $-6 | +10% $65 |
| Rate | -1.0pp $38 | -0.5pp $-19 | base $-77 | +0.5pp $-136 | +1.0pp $-196 |
UW: 25.0% down · 7.5% · 30yr · 1.5% tax · 5.0% vac · 8.0% maint · 8.0% mgmt
Financing live
Cash to close
- Down payment
- $57,000
- Closing costs
- $6,840
- Reserves months
- —
- Total cash needed
- —
Loan-product check · same deal, 3 products live
Conventional
25% down · 7.5% · 30yr
- Down + closing
- —
- Monthly P&I
- —
- Monthly cashflow
- —
- DSCR
- —
- Eligible?
- —
Personal DTI + credit; lowest rate.
DSCR
20% down · 8.5% · 30yr
- Down + closing
- —
- Monthly P&I
- —
- Monthly cashflow
- —
- DSCR
- —
- Eligible?
- —
No personal income docs; deal must DSCR.
Hard money
10% down · 12.0% · 12mo
- Down + closing
- —
- Monthly P&I
- —
- Monthly cashflow
- —
- DSCR
- —
- Eligible?
- —
Short-term bridge; refi at stabilization.
Rent comps 4 comps
| Address | Beds | Baths | Sqft | Rent | $/sqft | DOM | Units | Dist |
|---|---|---|---|---|---|---|---|---|
| 4355 Park Ct Trlr Park , FL | 2.0 | 1.5 | 1000 | $1,200 | $1.20 | 24d | 1 | 0.70mi |
| 4389 Park Ct Trlr Park , FL | 2.0 | 1.0 | 700 | $1,100 | $1.57 | 24d | 1 | 0.71mi |
| 6317 Firefly Dr Milton, FL | 4.0 | 2.0 | 1439 | $2,000 | $1.39 | 22d | 1 | 0.85mi |
| 6478 Da Lisa Rd Milton, FL | 3.0 | 2.0 | 1120 | $1,900 | $1.70 | 24d | 1 | 1.03mi |
Listing history 11 events
-
2026-04-27status Pending
-
2026-04-27historical Contingent
-
2026-03-06price $228,000
-
2026-03-05status Active
-
2026-02-20historical Contingent
-
2025-11-07$230,000 Active
-
2017-08-10soldstatus $98,000 259-char remark
Show marketing remark (259 chars)
Move-in-ready! Charming 3/2 that has been freshly painted throughout the home. New carpet in the living room and all the bedrooms. New tile flooring installed in the kitchen, hall and bathrooms. Spacious backyard with plenty of room to store a boat or RV!
-
2017-03-09$105,000 259-char remark
Show marketing remark (259 chars)
Move-in-ready! Charming 3/2 that has been freshly painted throughout the home. New carpet in the living room and all the bedrooms. New tile flooring installed in the kitchen, hall and bathrooms. Spacious backyard with plenty of room to store a boat or RV!
-
2003-04-01historical
-
2002-10-01$72,900
-
1975-06-01soldstatus $18,200
ⓘ Source: listings_history table (triggers on properties + properties_extension) + one-shot
backfill from property_details.listing_events for pre-trigger history.
Tax reassessment forecast FL · Resets to sale price
- Current annual tax
- $1,689 · $141/mo
- Projected year-2 tax
- $1,892 · $158/mo
- Expected delta
- +$203/yr (+$17/mo · 12.0%)
ⓘ Screening estimate from a state-policy table — verify with the county assessor before closing.
Climate risk First Street
- Flood 8/10 Severe FEMA zone X (unshaded) · 99% chance over 30 yrs
- Wildfire 4/10 Moderate
- Heat 10/10 Extreme 7 d/yr ≥105°F today · 21 d/yr by 30 yrs out
- Wind 9/10 Extreme 99% chance of damaging wind over 30 yrs
- Air quality 1/10 Low 0 unhealthy d/yr today · 0 by 30 yrs out
Nearby sold comps map
Loading sold comps map…
Walkable amenities ~0.75 mi
Loading nearby amenities…
Taxation est. · year 1
- Rental income
- $21,584
- − Mortgage interest
- −$12,772
- − Property taxes
- −$1,689
- − Insurance
- −$1,937
- − Repairs & maintenance
- −$1,727
- − Management
- −$1,727
- − Depreciation
- −$6,633
- Taxable loss
- −$4,901
- Est. tax savings @ 24.0%
- +$1,176
- After-tax cash flow
- $253/yr
For passive investors: Depreciation is non-cash, so a rental often shows a tax loss while cash-flowing — sheltering income. Rental losses are passive: they offset passive income freely, and up to $25,000/yr can offset ordinary (W-2) income if you actively participate and your MAGI is under $100k (phasing out to $0 by $150k); unused losses carry forward. On sale, claimed depreciation is recaptured at up to 25%, and gains may owe capital-gains tax (a 1031 exchange can defer both). Figures are a year-1 estimate at your 24.0% rate — not tax advice; consult a CPA.
Schools (NCES district)
- District
- Santa Rosa
- NCES district ID
- 1201650
- Math proficiency
- 63% ▼ -6.00%
- Reading proficiency
- 60% ▼ -5.00%
- Median HH income
- $58,161
- Composite
- 53.12/100
- National rank
- #1511
- State rank
- #8 of 73 in FL
Livability — Bagdad
- Score
- 67/100
- State rank
- #571
- US rank
- #10887
Category grades
Schools grade is shown separately in the Schools card above.
Census & demographics
- County
- Santa Rosa County · 194,764 people
- Metro
- Pensacola-Ferry Pass-Brent, FL
- Population (ZIP)
- 31,828
- Household income
- $85,440
- Rent vs Own
- Severe rent burden
- 122.0
Population outlook (Santa Rosa County) Hauer SSP2
- Today (2025)
- 195,978 people
- By 2030
- 209,782 · +7.0%
- By 2040
- 235,293 · +20.1%
- By 2050
- 256,408 · +30.8%
- By 2075
- 298,074 · +52.1%
- By 2100
- 303,216 · +54.7%
Race, ethnicity, and origin ACS 2023
- Neighborhood character
- Predominantly White (74%)
- Race & ethnicity
- White 74% Black 11% Two or more races 10% Hispanic / Latino 6% Asian 1%
- Hispanic origin (detail)
- Mexican 3% Puerto Rican 2% Cuban 1%
- Common ancestry
- Italian 3% Slovak 2% Serbian 2%
- Foreign-born
- 3% · Canada
- Languages at home
- 94% English-only · Spanish 3%
Political lean MEDSL · Santa Rosa
- 2024 margin
- Solid R (+51.0) · D 24.1% · R 75.0%
- 2008→2024 swing
- -3.0pp toward R · 2008: -47.9pp · 2024: -51.0pp
- All cycles
- 2024: R+51.0 2020: R+46.5 2016: R+53.5 2012: R+52.6 2008: R+47.9
Not yet ingested
- Civics
- —
Market trends
- HPI YoY
- ▼ -38.35%
- Current HPI
- 301.8819
- Rent YoY
- ▲ 4.53%
- Metro
- Pensacola-Ferry Pass-Brent, FL
- State GDP YoY
- ▲ 3.28%
- F500 in state
- 36
Industry mix (Fortune 500 HQ in FL)
| Industry | F500 HQs | Revenue |
|---|---|---|
| Industrial Technology | 2 | $29B |
|
||
| Insurance | 2 | $17B |
|
||
| Retail | 1 | $60B |
|
||
| Technology Distribution | 1 | $58B |
|
||
| Homebuilding | 1 | $35B |
|
||
| Technology Manufacturing | 1 | $35B |
|
||
Price history
+1152.7% since first listed11 events — show timeline
- 2026-04-27 Pending — PARMLS
- 2026-04-27 Contingent — PARMLS
- 2026-03-06 Price Changed $228,000 PARMLS
- 2026-03-05 Relisted — PARMLS
- 2026-02-20 Contingent — PARMLS
- 2025-11-07 Listed $230,000 PARMLS
- 2017-08-10 Sold (MLS) $98,000 PARMLS
- 2017-03-09 Listed $105,000 PARMLS
- 2003-04-01 Listing Removed — PARMLS
- 2002-10-01 Listed $72,900 PARMLS
- 1975-06-01 Sold (Public Records) $18,200 Public Records
Property tax history
+6.4%/yrLatest (2025): $1,689 · +7.5% YoY. Source: county tax records.
Cash-flow waterfall
monthlySold comps — $/sqft
last 12 mo · ≤1 miLoading sold comps…