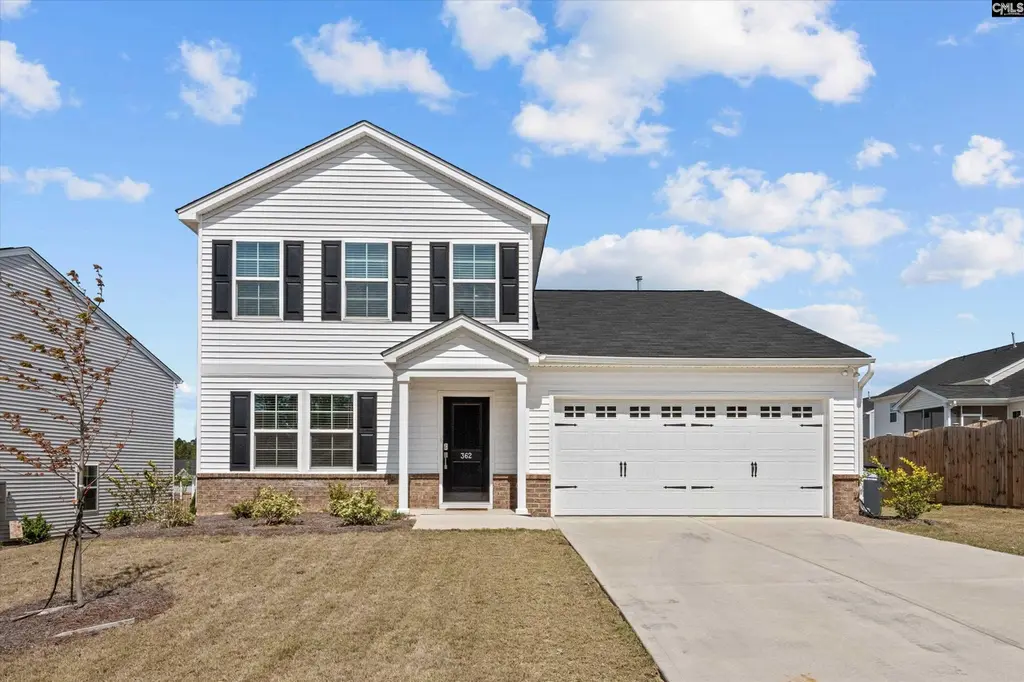
362 Aldergate Dr · White Knoll, SC
Flood risk No data
- FEMA flood zone
- —
- Chance of flooding over 30 yrs
- —
- Est. flood insurance / yr
- —
Fire risk No data
- Est. fire insurance / yr
- —
Heat risk No data
- Hot days now (above threshold)
- —
- Hot days in 30 yrs
- —
Wind risk No data
- Chance of severe wind over 30 yrs
- —
Air-quality risk No data
- Unhealthy air days now
- —
- Unhealthy air days in 30 yrs
- —
Risk factors via First Street. Map © Google.
Why this score? — see what drove the F grade
The composite is a weighted blend of 9 inputs, each scored 0–100. Each bar is that input's sub-score; the figure is the points it added to the 100-point composite (weight × sub-score).
- Cash flow +8.3/30.0
- ARV discount +7.5/15.0
- Schools +4.2/10.0
- Rent growth +3.3/5.0
- 1% rule +2.8/10.0
- Livability +2.5/5.0
- Condition / age +2.5/5.0
- DSCR +2.3/10.0
- Appreciation +0.0/10.0
$319,900
🖨 Deal sheet 📄 Offer letter ✓ Due diligence
Listing remarks
Welcome to 362 Aldergate Drive in Lexington - a well-maintained home offering comfort, space, and modern style. This 4-bedroom, 2 1/2-bathroom home features an open floor plan designed for both everyday living and entertaining. The main living areas showcase durable and stylish LVP flooring, complemented by a formal dining room perfect for gatherings. The eat-in kitchen is a standout, complete with a large island, granite countertops, and stainless steel appliances. The spacious master suite is conveniently located on the main floor and includes a walk-in closet and a private bathroom for added comfort and privacy. Upstairs, you'll find three generous bedrooms, all with walk-in closets, alo
Key facts
- Open floor plan
- Formal dining room
- Large island
Tags
Property features AI
Finance
- HOA & community: Has association; Association maintains common areas and provides pool and playground
Exterior
- Parking: Attached garage with 2 garage spaces (main level)
- Utilities: Public water; Public sewer
- Home design: Two-story house
- Construction: Slab foundation
- Exterior features: Vinyl exterior; Paved road access; Community pool; Playground
Interior
- Kitchen: Eat-in kitchen with island; Granite countertops; Dishwasher; Microwave (above stove); Gas range
- Bedrooms: Master bedroom on the main level with double vanity, private bath, ceiling fan, and carpeted floors; Three additional bedrooms on the second level with carpeted floors
- Flooring: Carpet in bedrooms; Luxury vinyl plank in living room and formal dining room
- Bathrooms: Two full bathrooms; One half bathroom; One additional full bathroom on the second level
- Heating & cooling: Central air conditioning; Central heating with gas on both first and second levels
- Interior features: Ceiling fans in master bedroom and living room; Recessed lights
- Laundry & utility: Main-level laundry in closet
Neighborhood map
What this means for you Summary
Snapshot
- This is a 4-bed/2.5-bath land listed at $320k.
Deal economics
- At list price, monthly cash flow is $-292 ($-4k/yr) — negative.
- To cash-flow at today's rent, offer at most $278k (13.2% below list).
- To meet the 1% rule (rent ≥ 1% of price), the offer needs to be $248k (22.5% below list).
- Recommended offer: $248k (22.5% below list) — sets the bar for 1% rule.
Location & tenants
- Location reads: area grade F — affects rentability + tenant quality, not the cash-flow math above.
- Lexington 01 (suburban): math 42% / reading 53% proficiency, ranked #11 of 80 in SC (top 14%) — families likely to look elsewhere, expect single-tenant / working-renter base with shorter leases.
- Zoned schools: White Knoll High (math 47% / reading 85%, grade B, #81 of 196 statewide, top 42%, 2,204 students, 45% FRL) — zoned schools average 45% FRL vs 30% district-wide (15 pts higher); higher-poverty schools than district average — tighter screening recommended.
- Zoned-school proficiency averages 66% at this address vs 48% district-wide (+18 pts) — the actual schools serving this property are materially stronger than the Lexington 01 average implies; a family-tenant draw the district grade alone would hide.
- Market conditions: Rents rising (+3.2%/yr); 564 active listings in the ZIP; 6 comparable units currently listed for rent nearby; rentals at typical pace (median 22d on market — plan ~3-4 weeks tenant-placement turnaround); solid renter incomes; 1,712 units permitted in Lexington County in 2024 (0 in 5+ unit buildings).
- This rent runs 39% of the median local income ($77k/yr) — at the standard rent-burdened threshold; future hikes will face affordability resistance.
Forward outlook
- Local home prices are declining (-3.0%/yr); year-one equity from $2k of loan paydown is wiped out by about $10k of value loss. Plan a longer hold.
- Lexington County population projected at +26% by 2050 — long-run rental-demand tailwind backs the buy-and-hold thesis.
Negotiation context
- It's been on market 70 days — a 6% lower offer ($301k) is reasonable based on typical stale-listing flexibility.
- 2 sale attempts since 2y ago with the ask held roughly flat each time — persistent listings suggest the price (not the market) is what's stuck; bring a comps-based counter.
Questions for the listing agent
- What do current leases actually rent for vs. the listed asking? Can we see a recent rent roll and the last 12 months of T-12 income?
- It's been on market 70 days. Have you received any prior offers? Is the seller open to a 22% concession, seller financing, or rate buy-down credit?
- What does the HOA fee cover, when was the last increase, and are there any pending special assessments or reserve-fund shortfalls?
- Why hasn't it sold? Are there any deal-killer items the seller is aware of (foundation, flood, title, zoning, code violations)?
- Is there a deadline driving the sale (1031 exchange, divorce, estate, relocation)? That informs how much negotiation room exists.
- The area grade is low — what's the realistic commute time and amenity access for the typical tenant pool here? Any planned neighborhood developments (good or bad) we should know about?
- What's the average days-on-market for RENTAL listings here right now (not sales)? A rising rental-DOM trend means longer vacancies and softer asking-rent achievability than the comps imply.
- What's the recent tenant-quality profile in this submarket — average credit score on applications, eviction rate, late-payment / NSF rate, and stable-employment percentage? A property-management company in the area should have these aggregated.
- How much new for-sale + rental construction is in the pipeline within 1–3 miles? Heavy new supply typically softens prices + rents 12–24 months out; constrained supply supports both.
Investment metrics
- 1% rule
- 0.78% ✗
- Cap rate
- 5.20%
- Cash-on-cash
- -3.91%
- DSCR
- 0.83
- GRM
- 10.7
CMA / ARV
No comps found within radius.
Projected returns pro-forma
-3.0% appreciation · 3.24% rent growth · sell at horizon
- IRR
- -22.6%
- Equity multiple
- 0.22×
- Total profit
- $-69,784
- Equity at exit
- $47,698
- IRR
- -16.2%
- Equity multiple
- 0.08×
- Total profit
- $-81,999
- Equity at exit
- $27,659
Cash invested: $89,572 (down + closing). Projections, not guarantees.
Landlord ↔ Tenant lean methodology
- Overall (STATE)
- 90 Strongly Landlord-Friendly
- State South Carolina
- 90 Strongly Landlord-Friendly · R+6
- County
- — inherits STATE
- City
- — inherits STATE
ZIP-level market 29073
- Home prices YoY
- -19.1%
- Rents YoY
- 3.2%
- Active inventory
- 564
- Price-to-rent
- 10.7×
Monthly cashflow live
- Estimated rent
- $2,480 high interval (Pro) →
- Mortgage (P&I)
- −$1,678
- Tax est. 1.5%
- −$400 /mo · $4,798/yr
- Insurance
- −$133
- HOA
- −$41
- Vacancy / Maint / Mgmt
- −$521
- Net cashflow
- $-292
Break-even live
UW: 25.0% down · 7.5% · 30yr · 1.5% tax · 5.0% vac · 8.0% maint · 8.0% mgmt
Financing live
Cash to close
- Down payment
- $79,975
- Closing costs
- $9,597
- Reserves months
- —
- Total cash needed
- —
Loan-product check · same deal, 3 products live
Conventional
25% down · 7.5% · 30yr
- Down + closing
- —
- Monthly P&I
- —
- Monthly cashflow
- —
- DSCR
- —
- Eligible?
- —
Personal DTI + credit; lowest rate.
DSCR
20% down · 8.5% · 30yr
- Down + closing
- —
- Monthly P&I
- —
- Monthly cashflow
- —
- DSCR
- —
- Eligible?
- —
No personal income docs; deal must DSCR.
Hard money
10% down · 12.0% · 12mo
- Down + closing
- —
- Monthly P&I
- —
- Monthly cashflow
- —
- DSCR
- —
- Eligible?
- —
Short-term bridge; refi at stabilization.
Rent comps 6 comps
| Address | Beds | Baths | Sqft | Rent | $/sqft | DOM | Units | Dist |
|---|---|---|---|---|---|---|---|---|
| 307 Savannah Hills Dr Lexington, SC | 3.0 | 2.5 | 1612 | $1,985 | $1.23 | 23d | 1 | 0.51mi |
| 2237 Trakand Dr Lexington, SC | 3.0 | 2.5 | 1962 | $1,975 | $1.01 | 2d | 1 | 0.52mi |
| 985 Native Rye Way Lexington, SC | 4.0 | 3.0 | 3100 | $3,500 | $1.13 | 2d | 1 | 0.57mi |
| 473 Walking Ln Lexington, SC | 3.0 | 2.5 | 1835 | $2,100 | $1.14 | 23d | 1 | 0.69mi |
| 432 Cape Jasmine Way Lexington, SC | 4.0 | 2.5 | 1600 | $2,049 | $1.28 | 3d | 1 | 0.91mi |
| 237 Tea Olive Ave Lexington, SC | 3.0 | 2.5 | 2448 | $2,099 | $0.86 | 21d | 1 | 1.26mi |
HOA detail
- Monthly dues
- $41 · $492/yr
Listing history 23 events
-
2026-06-18days on market $319,900 Active 70 DOM
-
2026-06-17days on market $319,900 Active 69 DOM
-
2026-06-16days on market $319,900 Active 68 DOM
-
2026-06-15days on market $319,900 Active 67 DOM
-
2026-06-14days on market $319,900 Active 65 DOM
-
2026-06-10days on market $319,900 Active 62 DOM
-
2026-06-09days on market $319,900 Active 61 DOM
-
2026-06-08days on market $319,900 Active 60 DOM
-
2026-06-07days on market $319,900 Active 59 DOM
-
2026-06-03days on market $319,900 Active 55 DOM
-
2026-06-03days on market $319,900 Active 54 DOM
-
2026-06-02days on market $319,900 Active 53 DOM
-
2026-05-31days on market $319,900 Active 52 DOM
-
2026-04-28price $319,900
-
2026-04-09$324,900 Active
-
2024-10-24status Pending
-
2024-10-10price $309,000
-
2024-10-03price $314,000
-
2024-08-08price $319,000
-
2024-06-22price $326,961
-
2024-06-08price $323,961
-
2024-06-05soldstatus $583,448
-
2024-04-29$320,576 Active
ⓘ Source: listings_history table (triggers on properties + properties_extension) + one-shot
backfill from property_details.listing_events for pre-trigger history.
Nearby sold comps map
Loading sold comps map…
Walkable amenities ~0.75 mi
Loading nearby amenities…
Taxation est. · year 1
- Rental income
- $29,766
- − Mortgage interest
- −$17,919
- − Property taxes
- −$4,798
- − Insurance
- −$1,600
- − Repairs & maintenance
- −$2,381
- − Management
- −$2,381
- − HOA
- −$492
- − Depreciation
- −$9,306
- Taxable loss
- −$9,112
- Est. tax savings @ 24.0%
- +$2,187
- After-tax cash flow
- $-1,319/yr
For passive investors: Depreciation is non-cash, so a rental often shows a tax loss while cash-flowing — sheltering income. Rental losses are passive: they offset passive income freely, and up to $25,000/yr can offset ordinary (W-2) income if you actively participate and your MAGI is under $100k (phasing out to $0 by $150k); unused losses carry forward. On sale, claimed depreciation is recaptured at up to 25%, and gains may owe capital-gains tax (a 1031 exchange can defer both). Figures are a year-1 estimate at your 24.0% rate — not tax advice; consult a CPA.
Schools (NCES district)
- District
- Lexington 01
- NCES district ID
- 4502700
- Math proficiency
- 42% ▼ -12.00%
- Reading proficiency
- 53% ▼ -2.00%
- Median HH income
- $61,298
- Composite
- 41.75/100
- National rank
- #3399
- State rank
- #11 of 80 in SC
Livability — White Knoll
No livability data for this city. (Only ~50 U.S. cities are tracked.)
Census & demographics
- Census place
- White Knoll, SC
- County
- Lexington County · 232,571 people
- City population
- 51,471
- Metro
- Columbia, SC
- Population (ZIP)
- 53,156
- Household income
- $77,229
- Rent vs Own
- Severe rent burden
- 935.0
Population outlook (Lexington County) Hauer SSP2
- Today (2025)
- 322,999 people
- By 2030
- 342,356 · +6.0%
- By 2040
- 377,715 · +16.9%
- By 2050
- 406,984 · +26.0%
- By 2075
- 465,447 · +44.1%
- By 2100
- 485,674 · +50.4%
Race, ethnicity, and origin ACS 2023
- Neighborhood character
- Predominantly White (72%)
- Race & ethnicity
- White 72% Black 14% Two or more races 7% Hispanic / Latino 6% Asian 2%
- Hispanic origin (detail)
- Mexican 2% Puerto Rican 1%
- Common ancestry
- Romanian 3% Italian 2% Slovak 1%
- Foreign-born
- 4% · Canada, China
- Languages at home
- 93% English-only · Spanish 5% Other Indo-European 1%
Political lean MEDSL · Lexington
- 2024 margin
- Solid R (+33.5) · D 32.5% · R 66.0% · Other 1.4%
- 2008→2024 swing
- +4.6pp toward D · 2008: -38.0pp · 2024: -33.5pp
- All cycles
- 2024: R+33.5 2020: R+30.1 2016: R+36.7 2012: R+37.8 2008: R+38.0
Not yet ingested
- Civics
- —
Market trends
- HPI YoY
- ▼ -59.20%
- Current HPI
- 249.8957
- Rent YoY
- ▲ 3.24%
- Metro
- Columbia, SC
- State GDP YoY
- ▲ 4.51%
- F500 in state
- 2
Industry mix (Fortune 500 HQ in SC)
| Industry | F500 HQs | Revenue |
|---|---|---|
| Packaging | 1 | $7B |
|
||
Price history
-0.2% since first listed10 events — show timeline
- 2026-04-28 Price Changed $319,900 Consolidated MLS
- 2026-04-09 Listed $324,900 Consolidated MLS
- 2024-10-24 Pending — Consolidated MLS
- 2024-10-10 Price Changed $309,000 Consolidated MLS
- 2024-10-03 Price Changed $314,000 Consolidated MLS
- 2024-08-08 Price Changed $319,000 Consolidated MLS
- 2024-06-22 Price Changed $326,961 Consolidated MLS
- 2024-06-08 Price Changed $323,961 Consolidated MLS
- 2024-06-05 Sold (Public Records) $583,448 Public Records
- 2024-04-29 Listed $320,576 Consolidated MLS
Cash-flow waterfall
monthlySold comps — $/sqft
last 12 mo · ≤1 miLoading sold comps…