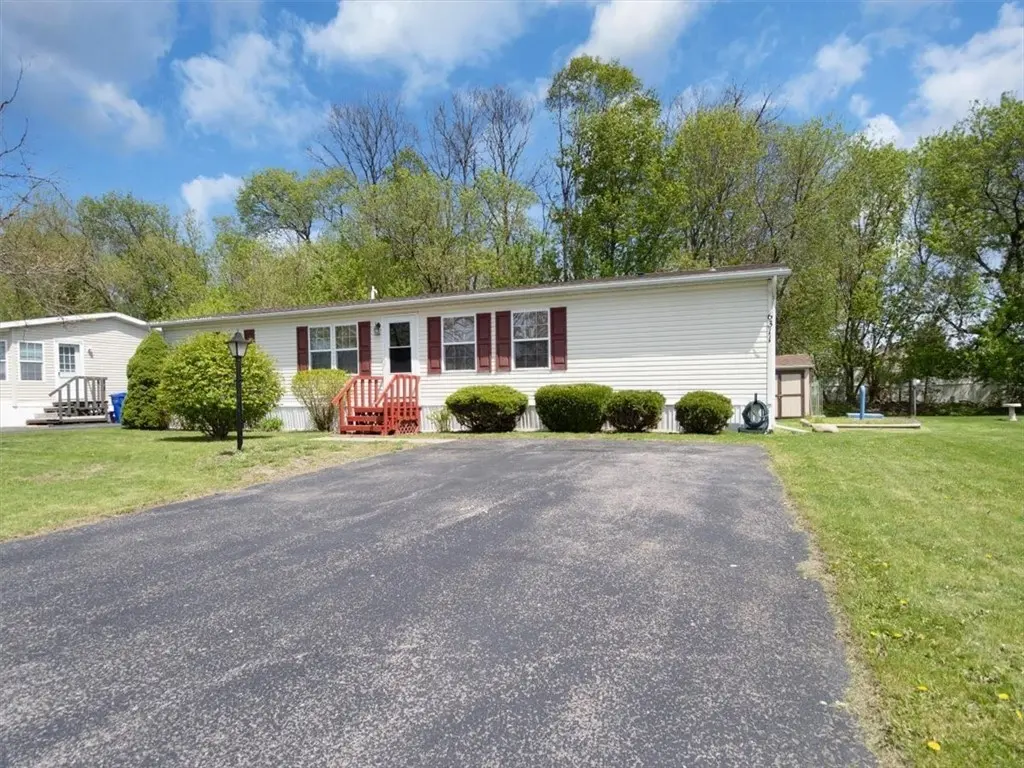
6311 Murphy · Victor, NY
Flood risk 1/10 · Minimal
- FEMA flood zone
- X
- Chance of flooding over 30 yrs
- 0.0%
- Est. flood insurance / yr
- $507 – $1,088
Fire risk 3/10 · Minor
- Est. fire insurance / yr
- $691 – $1,283
Heat risk 3/10 · Minor
- Hot days now (above 97°F)
- 7 days/yr
- Hot days in 30 yrs
- 17 days/yr
Wind risk 1/10 · Minimal
- Chance of severe wind over 30 yrs
- —
Air-quality risk 2/10 · Minimal
- Unhealthy air days now
- 0 days/yr
- Unhealthy air days in 30 yrs
- 1 days/yr
Risk factors via First Street. Map © Google.
Why this score? — see what drove the B grade
The composite is a weighted blend of 9 inputs, each scored 0–100. Each bar is that input's sub-score; the figure is the points it added to the 100-point composite (weight × sub-score).
- Cash flow +30.0/30.0
- 1% rule +10.0/10.0
- DSCR +10.0/10.0
- ARV discount +7.5/15.0
- Schools +5.2/10.0
- Livability +4.0/5.0
- Rent growth +2.5/5.0
- Condition / age +2.5/5.0
- Appreciation +0.0/10.0
$89,900
🖨 Deal sheet 📄 Offer letter ✓ Due diligence
Listing remarks MLS
1st OPEN HOUSE-SATURDAY SEPTEMBER 23RD 12-2 PM Charming circa 2002 Skyline Birchfield vinyl clad manufactured ranch home with soft contemporary accents. . Home offers master bedroom suite with full Bath and soaking tub, 2 spacious bedrooms and full Bath. 1 year old gas furnace six-year-old hot water heater. Cathedral ceilings vinyl clad thermal pane Windows that tilt in for cleaning. Fully applianced kitchen with center island and appliances, 8 by 10 storage shed and backs to wooded rear yard. Delayed showings begin 9/21 at noon/delayed presentation 9/26 @ 6pm (please take note that this is not real estate but personal property-mortgage prequals are not acceptable. SEE LIST OF MANUFACTURED HOME LENDING INSTITUTIONS IN THE SUPPLIMENTALS) Must be for manufactured home) Lot Rent and Taxes:$630 lot rent + Monthly taxes 119.19=748.18
Key facts
- Open floor plan
- Storage shed
- New roof
Tags
Property features AI
Finance
- Other: Lot is rectangular with agricultural designation (100 x 50)
- Financial info: Land lease applies
- HOA & community: Association amenities include golf course and pool; Community/association pool
Exterior
- Parking: No garage
- Utilities: Cable available; High-speed internet available; Public water (connected); Sewer connected
- Home design: Single-story home; Double wide mobile home; Existing (resale) property
- Construction: Vinyl siding; Architectural shingle roof; Poured foundation; Built as existing structure
- Exterior features: Blacktop driveway; Deck; Open porch
Interior
- Kitchen: Electric oven and electric range; Dishwasher
- Bedrooms: Three main-level bedrooms
- Flooring: Carpet; Luxury vinyl; Varies
- Bathrooms: Two full bathrooms (both on the main level)
- Heating & cooling: Central air conditioning; Electric and gas heating
- Interior features: Eat-in kitchen; Bedroom on main level; Programmable thermostat
- Laundry & utility: Washer and dryer; Electric water heater
Neighborhood map
What this means for you Summary
Snapshot
- This is a 3-bed/2.0-bath single-family listed at $90k.
Deal economics
- At list price, monthly cash flow is $1k ($15k/yr) — positive.
- The deal already cash-flows at list — no discount required.
- Meets the 1% rule at list price ($2k rent vs $90k).
- Cap rate 23.4% vs local median 2.6% in Victor — top-decile yield for the area; either an underpriced asset or a hidden risk that comps aren't pricing in. Stress-test before assuming the spread holds.
Location & tenants
- Location reads 79/100 on livability (#122 in NY, #1,991 nationally) — a middle-class / working-renter tenant base. Strengths: schools A+, employment A+, housing A+; Watch: amenities F, commute F.
- Victor Central School District (suburban): math 56% / reading 62% proficiency, ranked #222 of 590 in NY (top 38%) — acceptable for families but not a draw, mixed tenant base, ~2y average lease; only 12% free/reduced lunch — higher-income household profile.
- Market conditions: 110 active listings in the ZIP; 2 comparable units currently listed for rent nearby; high-income renter base; 284 units permitted in Ontario County in 2024 (69 in 5+ unit buildings).
Forward outlook
- Local home prices are declining (-3.0%/yr); year-one equity from $622 of loan paydown is wiped out by about $3k of value loss. Plan a longer hold.
- Ontario County population projected to shrink 6% by 2050 — rents likely to lag national; underwrite the cash flow, not the appreciation.
- At projected returns (-3.0% appreciation + 3.0% rent growth), your $25k cash investment doubles in ~2 years — after that, you're playing with house money.
Negotiation context
- Only 3 days on market — expect competitive offers; lowballing is unlikely to land.
- 2 sale attempts since 3y ago with the ask held roughly flat each time — persistent listings suggest the price (not the market) is what's stuck; bring a comps-based counter.
- Current owner paid $78k; 16% above their basis — modest negotiation headroom, anchor on the comps not their cost.
Questions for the listing agent
- What does the HOA fee cover, when was the last increase, and are there any pending special assessments or reserve-fund shortfalls?
- Is there a deadline driving the sale (1031 exchange, divorce, estate, relocation)? That informs how much negotiation room exists.
- Schools are A-rated — typically a magnet for longer-tenancy family renters. What's the average tenant stay here, and is there a school-zone premium baked into asking?
- What's the average days-on-market for RENTAL listings here right now (not sales)? A rising rental-DOM trend means longer vacancies and softer asking-rent achievability than the comps imply.
- What's the recent tenant-quality profile in this submarket — average credit score on applications, eviction rate, late-payment / NSF rate, and stable-employment percentage? A property-management company in the area should have these aggregated.
- How much new for-sale + rental construction is in the pipeline within 1–3 miles? Heavy new supply typically softens prices + rents 12–24 months out; constrained supply supports both.
Investment metrics
- 1% rule
- 2.73% ✓
- Cap rate
- 23.45%
- Cash-on-cash
- 61.26%
- DSCR
- 3.73
- GRM
- 3.1
CMA / ARV
No comps found within radius.
Projected returns pro-forma
-3.0% appreciation · 3.0% rent growth · sell at horizon
- IRR
- 60.1%
- Equity multiple
- 3.68×
- Total profit
- $67,339
- Equity at exit
- $13,404
- IRR
- 64.8%
- Equity multiple
- 7.53×
- Total profit
- $164,262
- Equity at exit
- $7,773
Cash invested: $25,172 (down + closing). Projections, not guarantees.
Landlord ↔ Tenant lean methodology
- Overall (STATE)
- 15 Strongly Tenant-Friendly
- State New York
- 15 Strongly Tenant-Friendly · D+10
- County
- — inherits STATE
- City
- — inherits STATE
ZIP-level market 14564
- Home prices YoY
- -12.8%
- Active inventory
- 110
- Price-to-rent
- 3.1×
Monthly cashflow live
- Estimated rent
- $2,454 medium interval (Pro) →
- Mortgage (P&I)
- −$471
- Tax est. 1.5%
- −$112 /mo · $1,348/yr
- Insurance
- −$37
- HOA
- −$32
- Vacancy / Maint / Mgmt
- −$515
- Net cashflow
- $1,285
Break-even live
UW: 25.0% down · 7.5% · 30yr · 1.5% tax · 5.0% vac · 8.0% maint · 8.0% mgmt
Financing live
Cash to close
- Down payment
- $22,475
- Closing costs
- $2,697
- Reserves months
- —
- Total cash needed
- —
Loan-product check · same deal, 3 products live
Conventional
25% down · 7.5% · 30yr
- Down + closing
- —
- Monthly P&I
- —
- Monthly cashflow
- —
- DSCR
- —
- Eligible?
- —
Personal DTI + credit; lowest rate.
DSCR
20% down · 8.5% · 30yr
- Down + closing
- —
- Monthly P&I
- —
- Monthly cashflow
- —
- DSCR
- —
- Eligible?
- —
No personal income docs; deal must DSCR.
Hard money
10% down · 12.0% · 12mo
- Down + closing
- —
- Monthly P&I
- —
- Monthly cashflow
- —
- DSCR
- —
- Eligible?
- —
Short-term bridge; refi at stabilization.
Rent comps 2 comps
| Address | Beds | Baths | Sqft | Rent | $/sqft | DOM | Units | Dist |
|---|---|---|---|---|---|---|---|---|
| 6141 Cedar Creek Way Farmington, NY | 1.0–3.0 | 1.0–2.0 | 1272 | $2,375 | $1.87 | 2d | 17 | 0.31mi |
| 6316 Bentley Dr Victor, NY | 2.0 | 1.5 | 1500 | $2,400 | $1.60 | 23d | 1 | 0.99mi |
HOA detail
- Monthly dues
- $32 · $384/yr
- Likely covers
- watergas
Listing history 4 events
-
2026-06-18days on market $89,900 Active 3 DOM
-
2026-06-17days on market $89,900 Active 2 DOM
-
2026-06-16remarks 699-char remark
-
2026-06-16$89,900 Active 1 DOM
ⓘ Source: listings_history table (triggers on properties + properties_extension) + one-shot
backfill from property_details.listing_events for pre-trigger history.
Climate risk First Street
- Flood 1/10 Low FEMA zone X · 0% chance over 30 yrs
- Wildfire 3/10 Moderate
- Heat 3/10 Moderate 7 d/yr ≥97°F today · 17 d/yr by 30 yrs out
- Wind 1/10 Low
- Air quality 2/10 Low 0 unhealthy d/yr today · 1 by 30 yrs out
Nearby sold comps map
Loading sold comps map…
Walkable amenities ~0.75 mi
Loading nearby amenities…
Taxation est. · year 1
- Rental income
- $29,444
- − Mortgage interest
- −$5,036
- − Property taxes
- −$1,348
- − Insurance
- −$450
- − Repairs & maintenance
- −$2,356
- − Management
- −$2,356
- − HOA
- −$384
- − Depreciation
- −$2,615
- Taxable income
- $14,900
- Est. tax owed @ 24.0%
- −$3,576
- After-tax cash flow
- $11,845/yr
For passive investors: Depreciation is non-cash, so a rental often shows a tax loss while cash-flowing — sheltering income. Rental losses are passive: they offset passive income freely, and up to $25,000/yr can offset ordinary (W-2) income if you actively participate and your MAGI is under $100k (phasing out to $0 by $150k); unused losses carry forward. On sale, claimed depreciation is recaptured at up to 25%, and gains may owe capital-gains tax (a 1031 exchange can defer both). Figures are a year-1 estimate at your 24.0% rate — not tax advice; consult a CPA.
Schools (NCES district)
- District
- Victor Central School District
- NCES district ID
- 3629640
- Math proficiency
- 56% ▼ -18.00%
- Reading proficiency
- 62% ▲ 3.00%
- Median HH income
- $73,046
- Composite
- 52.43/100
- National rank
- #1575
- State rank
- #222 of 590 in NY
Livability — Victor
- Score
- 79/100
- State rank
- #122
- US rank
- #1991
Category grades
Schools grade is shown separately in the Schools card above.
Census & demographics
- County
- Ontario County · 58,989 people
- City population
- 16,364
- Metro
- Rochester, NY
- Population (ZIP)
- 16,364
- Household income
- $115,625
- Rent vs Own
- Severe rent burden
- 357.0
Population outlook (Ontario County) Hauer SSP2
- Today (2025)
- 111,230 people
- By 2030
- 111,401 · +0.2%
- By 2040
- 109,535 · -1.5%
- By 2050
- 104,895 · -5.7%
- By 2075
- 92,999 · -16.4%
- By 2100
- 73,723 · -33.7%
Race, ethnicity, and origin ACS 2023
- Neighborhood character
- Predominantly White (89%)
- Race & ethnicity
- White 89% Two or more races 4% Hispanic / Latino 4% Asian 4% Black 1%
- Common ancestry
- Romanian 6% Iranian 3% Lithuanian 2%
- Foreign-born
- 7% · South Korea, Canada
- Languages at home
- 92% English-only · Other Indo-European 4% Spanish 1% German/W. Germanic 1%
Political lean MEDSL · Ontario
- 2024 margin
- Toss-up / Even · D 49.4% · R 50.6%
- 2008→2024 swing
- -1.0pp toward R · 2008: -0.1pp · 2024: -1.2pp
- All cycles
- 2024: R+1.2 2020: R+0.0 2016: R+8.6 2012: R+1.6 2008: R+0.1
Not yet ingested
- Civics
- —
Market trends
- HPI YoY
- ▼ -40.90%
- Current HPI
- 279.9821
- Rent YoY
- —
- Metro
- Rochester, NY
- State GDP YoY
- ▲ 2.60%
- F500 in state
- 92
Industry mix (Fortune 500 HQ in NY)
| Industry | F500 HQs | Revenue |
|---|---|---|
| Financial Services | 10 | $950B |
|
||
| Consumer Goods | 9 | $162B |
|
||
| Insurance | 4 | $225B |
|
||
| Telecommunications | 2 | $144B |
|
||
| Pharmaceuticals | 2 | $112B |
|
||
| Media / Entertainment | 2 | $69B |
|
||
Price history
+15.4% since first listed5 events — show timeline
- 2026-06-15 Listed $89,900 UNYREIS
- 2023-12-27 Pending — UNYREIS
- 2023-12-22 Sold (MLS) $77,500 UNYREIS
- 2023-09-28 Pending — UNYREIS
- 2023-09-17 Listed $77,900 UNYREIS
Cash-flow waterfall
monthlySold comps — $/sqft
last 12 mo · ≤1 miLoading sold comps…