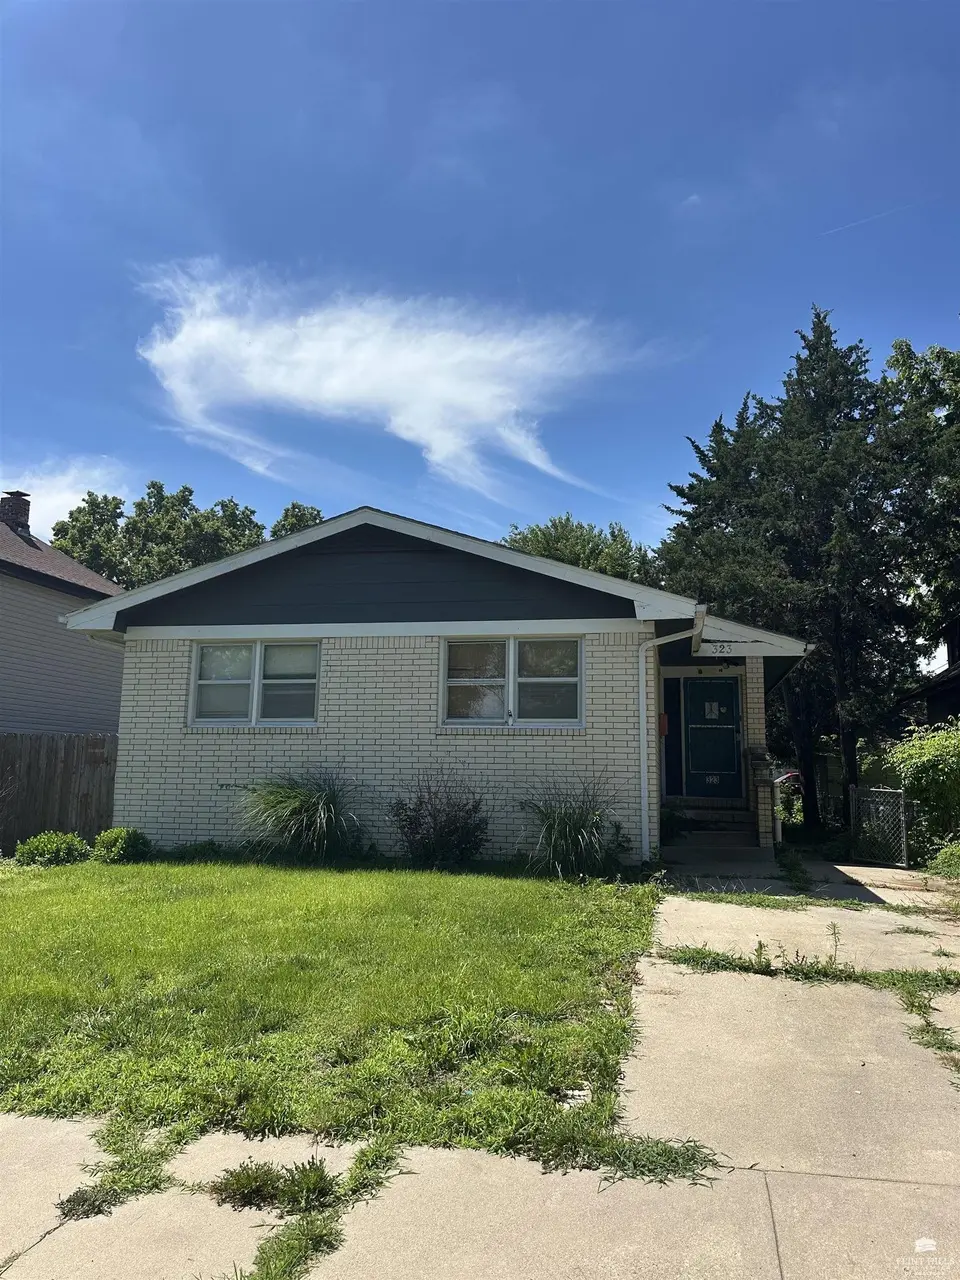
323 W 2nd St · Junction City, KS
Flood risk 1/10 · Minimal
- FEMA flood zone
- X (unshaded)
- Chance of flooding over 30 yrs
- 0.0%
- Est. flood insurance / yr
- $473 – $860
Fire risk 5/10 · Moderate
- Est. fire insurance / yr
- $1,154 – $2,142
Heat risk 4/10 · Minor
- Hot days now (above 107°F)
- 7 days/yr
- Hot days in 30 yrs
- 16 days/yr
Wind risk 2/10 · Minimal
- Chance of severe wind over 30 yrs
- —
Air-quality risk 3/10 · Minor
- Unhealthy air days now
- 2 days/yr
- Unhealthy air days in 30 yrs
- 3 days/yr
Risk factors via First Street. Map © Google.
Why this score? — see what drove the C+ grade
The composite is a weighted blend of 9 inputs, each scored 0–100. Each bar is that input's sub-score; the figure is the points it added to the 100-point composite (weight × sub-score).
- Cash flow +26.5/30.0
- DSCR +9.0/10.0
- 1% rule +8.2/10.0
- ARV discount +7.5/15.0
- Rent growth +4.0/5.0
- Livability +3.3/5.0
- Schools +3.0/10.0
- Condition / age +2.5/5.0
- Appreciation +0.0/10.0
$129,000
🖨 Deal sheet (PDF) 📄 Offer letter ✓ Due diligence
Key facts
- 6,554 sq ft lot
- Built 1968
- Listed 2 days
Property features AI
Exterior
- Utilities: Public water; Public sewer
- Home design: Single-family residence; Residential property
- Construction: Brick veneer and Masonite exterior; Built area above grade listed (finished area)
- Exterior features: Deck; Concrete road access
Interior
- Kitchen: Eat-in kitchen
- Bedrooms: 3 main-level bedrooms
- Bathrooms: 2 full bathrooms; 1 half bathroom
- Heating & cooling: Central air conditioning; Natural gas forced-air heating
- Interior features: Eat-in kitchen; Partially finished basement
Neighborhood map
What this means for you Summary
Snapshot
- This is a 5-bed/2.5-bath single-family listed at $129k.
Deal economics
- At list price, monthly cash flow is $339 ($4k/yr) — positive.
- The deal already cash-flows at list — no discount required.
- Meets the 1% rule at list price ($2k rent vs $129k).
Location & tenants
- Location reads 66/100 on livability (#266 in KS) — a middle-class / working-renter tenant base. Strengths: cost of living A+, housing A+, health & safety A+; Watch: schools D+, crime F, amenities F.
- Geary County Schools (town): math 32% / reading 39% proficiency, ranked #60 of 169 in KS (top 36%) — families likely to look elsewhere, expect single-tenant / working-renter base with shorter leases.
- Market conditions: Rents rising fast (+6.0%/yr); 262 active listings in the ZIP; 93 units permitted in Geary County in 2024 (0 in 5+ unit buildings).
- This rent runs 34% of the median local income ($60k/yr) — at the standard rent-burdened threshold; future hikes will face affordability resistance.
Forward outlook
- Local home prices are declining (-3.0%/yr); year-one equity from $892 of loan paydown is wiped out by about $4k of value loss. Plan a longer hold.
- Geary County population projected at +8% by 2050 — modest demand growth; plan on rents tracking national, not racing it.
- At projected returns (-3.0% appreciation + 6.0% rent growth), your $36k cash investment doubles in ~8 years — after that, you're playing with house money.
Negotiation context
- Only 3 days on market — expect competitive offers; lowballing is unlikely to land.
Risks & watch-outs
- Watch-outs: property tax is 2.5% of price.
- Climate carrying-cost: moderate wildfire risk — expect insurance premiums to compound above CPI over the hold.
Questions for the listing agent
- Built in 1968 — when were the roof, HVAC, electrical panel, plumbing, and water heater last replaced?
- Property tax is high relative to price — has the assessment been appealed recently, and will the sale trigger a re-assessment?
- Is there a deadline driving the sale (1031 exchange, divorce, estate, relocation)? That informs how much negotiation room exists.
- Schools are D-rated, which usually means shorter tenancies and higher turnover. Who's the typical renter profile here, and what's been the actual vacancy rate?
- Crime grade is F in this area — have there been break-ins, vandalism, or insurance claims at this property in the last 3 years? What carrier currently insures it and at what premium?
- What's the average days-on-market for RENTAL listings here right now (not sales)? A rising rental-DOM trend means longer vacancies and softer asking-rent achievability than the comps imply.
- What's the recent tenant-quality profile in this submarket — average credit score on applications, eviction rate, late-payment / NSF rate, and stable-employment percentage? A property-management company in the area should have these aggregated.
- How much new for-sale + rental construction is in the pipeline within 1–3 miles? Heavy new supply typically softens prices + rents 12–24 months out; constrained supply supports both.
Investment metrics
- 1% rule
- 1.32% ✓
- Cap rate
- 9.45%
- Cash-on-cash
- 11.27%
- DSCR
- 1.50
- GRM
- 6.3
CMA / ARV
No comps found within radius.
Projected returns pro-forma
-3.0% appreciation · 6.05% rent growth · sell at horizon
- IRR
- 4.3%
- Equity multiple
- 1.17×
- Total profit
- $6,166
- Equity at exit
- $19,234
- IRR
- 16.6%
- Equity multiple
- 2.58×
- Total profit
- $57,014
- Equity at exit
- $11,154
Cash invested: $36,120 (down + closing). Projections, not guarantees.
Landlord ↔ Tenant lean methodology
- Overall (STATE)
- 83 Strongly Landlord-Friendly
- State Kansas
- 83 Strongly Landlord-Friendly · R+10
- County
- — inherits STATE
- City
- — inherits STATE
ZIP-level market 66441
- Rents YoY
- 6.0%
- Active inventory
- 262
- Price-to-rent
- 6.3×
Monthly cashflow live
- Estimated rent
- $1,696 medium interval (Pro) →
- Mortgage (P&I)
- −$676
- Tax from tax record
- −$271 /mo · $3,247/yr
- Insurance
- −$54
- HOA
- −$0
- Vacancy / Maint / Mgmt
- −$356
- Net cashflow
- $339
Break-even live
Sensitivity live
| Price | -10% $412 | -5% $376 | +0% $339 | +5% $303 | +10% $266 |
|---|---|---|---|---|---|
| Rent | -10% $205 | -5% $272 | +0% $339 | +5% $406 | +10% $473 |
| Rate | -1.0pp $404 | -0.5pp $372 | base $339 | +0.5pp $306 | +1.0pp $272 |
UW: 25.0% down · 7.5% · 30yr · 1.5% tax · 5.0% vac · 8.0% maint · 8.0% mgmt
Financing live
Cash to close
- Down payment
- $32,250
- Closing costs
- $3,870
- Reserves months
- —
- Total cash needed
- —
Loan-product check · same deal, 3 products live
Conventional
25% down · 7.5% · 30yr
- Down + closing
- —
- Monthly P&I
- —
- Monthly cashflow
- —
- DSCR
- —
- Eligible?
- —
Personal DTI + credit; lowest rate.
DSCR
20% down · 8.5% · 30yr
- Down + closing
- —
- Monthly P&I
- —
- Monthly cashflow
- —
- DSCR
- —
- Eligible?
- —
No personal income docs; deal must DSCR.
Hard money
10% down · 12.0% · 12mo
- Down + closing
- —
- Monthly P&I
- —
- Monthly cashflow
- —
- DSCR
- —
- Eligible?
- —
Short-term bridge; refi at stabilization.
Listing history 2 events
-
2026-06-21days on market $129,000 Active 3 DOM
-
2026-06-19$129,000 Active 1 DOM
ⓘ Source: listings_history table (triggers on properties + properties_extension) + one-shot
backfill from property_details.listing_events for pre-trigger history.
Tax reassessment forecast KS · Resets to sale price
- Current annual tax
- $3,247 · $271/mo
- Projected year-2 tax
- $3,247 · $271/mo
- Expected delta
- $0/yr ($0/mo · 0.0%)
ⓘ Screening estimate from a state-policy table — verify with the county assessor before closing.
Climate risk First Street
- Flood 1/10 Low FEMA zone X (unshaded) · 0% chance over 30 yrs
- Wildfire 5/10 Major
- Heat 4/10 Moderate 7 d/yr ≥107°F today · 16 d/yr by 30 yrs out
- Wind 2/10 Low
- Air quality 3/10 Moderate 2 unhealthy d/yr today · 3 by 30 yrs out
Nearby sold comps map
Loading sold comps map…
Walkable amenities ~0.75 mi
Loading nearby amenities…
Taxation est. · year 1
- Rental income
- $20,357
- − Mortgage interest
- −$7,226
- − Property taxes
- −$3,247
- − Insurance
- −$645
- − Repairs & maintenance
- −$1,629
- − Management
- −$1,629
- − Depreciation
- −$3,753
- Taxable income
- $2,229
- Est. tax owed @ 24.0%
- −$535
- After-tax cash flow
- $3,537/yr
For passive investors: Depreciation is non-cash, so a rental often shows a tax loss while cash-flowing — sheltering income. Rental losses are passive: they offset passive income freely, and up to $25,000/yr can offset ordinary (W-2) income if you actively participate and your MAGI is under $100k (phasing out to $0 by $150k); unused losses carry forward. On sale, claimed depreciation is recaptured at up to 25%, and gains may owe capital-gains tax (a 1031 exchange can defer both). Figures are a year-1 estimate at your 24.0% rate — not tax advice; consult a CPA.
Schools (NCES district)
- District
- Geary County Schools
- NCES district ID
- 2007890
- Math proficiency
- 32% ▲ 1.00%
- Reading proficiency
- 39% ▲ 2.00%
- Median HH income
- $44,319
- Composite
- 30.2/100
- National rank
- #6306
- State rank
- #60 of 169 in KS
Livability — Junction City
- Score
- 66/100
- State rank
- #266
- US rank
- #11965
Category grades
Schools grade is shown separately in the Schools card above.
Census & demographics
- Census place
- Junction City, KS
- County
- Geary County · 25,828 people
- City population
- 25,828
- Metro
- Manhattan, KS
- Population (ZIP)
- 25,828
- Household income
- $59,522
- Rent vs Own
- Severe rent burden
- 950.0
Population outlook (Geary County) Hauer SSP2
- Today (2025)
- 37,364 people
- By 2030
- 38,234 · +2.3%
- By 2040
- 39,727 · +6.3%
- By 2050
- 40,314 · +7.9%
- By 2075
- 44,283 · +18.5%
- By 2100
- 46,935 · +25.6%
Race, ethnicity, and origin ACS 2023
- Neighborhood character
- Diverse neighborhood (Simpson 0.66)
- Race & ethnicity
- White 53% Black 19% Two or more races 15% Hispanic / Latino 15% Asian 3%
- Hispanic origin (detail)
- Mexican 8% Puerto Rican 4%
- Common ancestry
- Lithuanian 3% Italian 2% Portuguese 2%
- Foreign-born
- 8% · Canada, South Korea, Vietnam
- Languages at home
- 85% English-only · Spanish 9% German/W. Germanic 1% Korean 1%
Political lean MEDSL · Geary
- 2024 margin
- R (+17.6) · D 40.1% · R 57.7% · Other 2.2%
- 2008→2024 swing
- -5.2pp toward R · 2008: -12.4pp · 2024: -17.6pp
- All cycles
- 2024: R+17.6 2020: R+14.7 2016: R+21.7 2012: R+14.4 2008: R+12.4
Not yet ingested
- Civics
- —
Market trends
- HPI YoY
- ▼ -152.25%
- Current HPI
- 137.9936
- Rent YoY
- ▲ 6.05%
- Metro
- Manhattan, KS
- State GDP YoY
- —
- F500 in state
- 0
Price history
1 event — show timeline
- 2026-06-18 Listed $129,000 FHAOR as distributed by MLS GRID
Property tax history
+2.4%/yrLatest (2025): $3,247 · +3.9% YoY. Source: county tax records.
Cash-flow waterfall
monthlySold comps — $/sqft
last 12 mo · ≤1 miLoading sold comps…