 Duplex
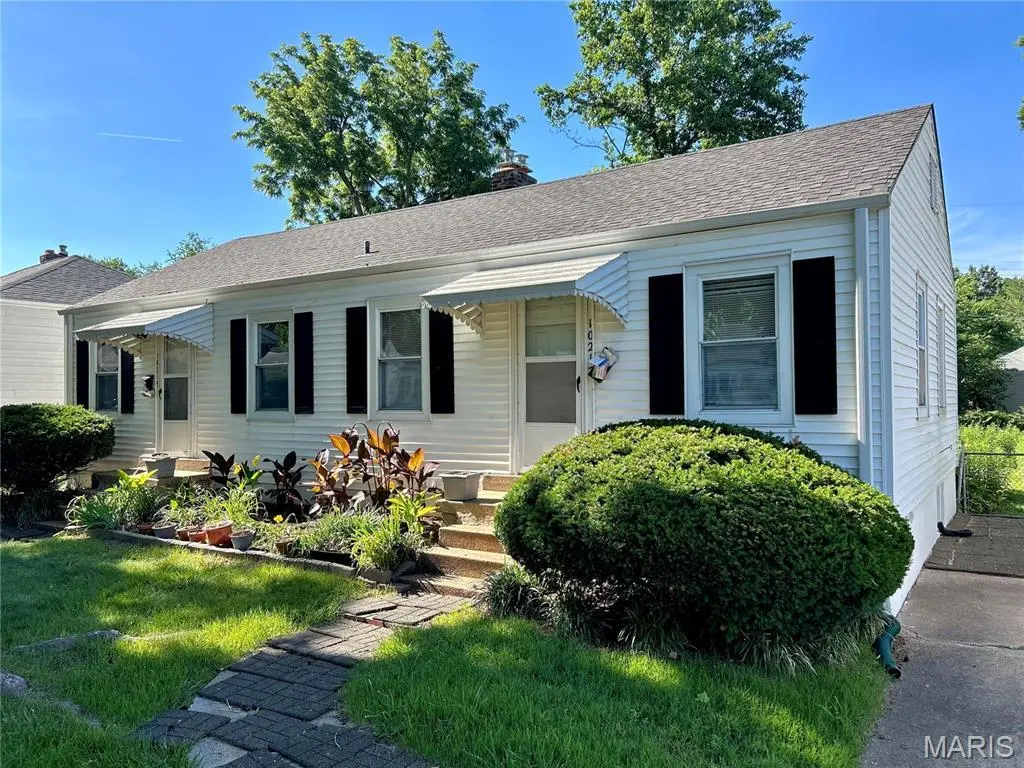
10217 Saint Katherine Ln · St. Ann, MO
Flood risk 1/10 · Minimal
- FEMA flood zone
- X (unshaded)
- Chance of flooding over 30 yrs
- 0.0%
- Est. flood insurance / yr
- $473 – $860
Fire risk 1/10 · Minimal
- Est. fire insurance / yr
- $1,054 – $1,958
Heat risk 4/10 · Minor
- Hot days now (above 106°F)
- 7 days/yr
- Hot days in 30 yrs
- 21 days/yr
Wind risk 2/10 · Minimal
- Chance of severe wind over 30 yrs
- 1.0%
Air-quality risk 2/10 · Minimal
- Unhealthy air days now
- 1 days/yr
- Unhealthy air days in 30 yrs
- 3 days/yr
Risk factors via First Street. Map © Google.
Why this score? — see what drove the B- grade
The composite is a weighted blend of 9 inputs, each scored 0–100. Each bar is that input's sub-score; the figure is the points it added to the 100-point composite (weight × sub-score).
- Cash flow +30.0/30.0
- DSCR +10.0/10.0
- 1% rule +9.3/10.0
- ARV discount +7.0/15.0
- Rent growth +3.5/5.0
- Livability +2.5/5.0
- Condition / age +2.5/5.0
- Schools +1.7/10.0
- Appreciation +0.0/10.0
$160,000
🖨 Deal sheet (PDF) 📄 Offer letter ✓ Due diligence
Multi-family units
County records classify this as Multi-Family (5+ Unit). Listing-text estimate: 2 units. estimate disagrees with records
5+ unit building — per-unit beds/baths from public records are typically unavailable; the breakdown below (if shown) is an estimate from the listing text.
Listing remarks
Fantastic investment opportunity in a highly desirable St. Ann location! Add two income-producing units to your portfolio with this well-maintained duplex that offers exceptional curb appeal from the moment you arrive. Each unit features a functional and desirable layout with 1 bedroom, 1 full bathroom, a spacious living room, and an eat-in kitchen, along with access to the large fenced backyard. The property has been well cared for, with major mechanical systems already updated and operating properly, including a sump pump system in the basement for added peace of mind. While the units are ready for cosmetic updates and modern finishes, the solid foundation and strong fundamentals make thi
Key facts
- Solid foundation
- Fenced backyard
- Sump pump system
Tags
Property features AI
Finance
- Other: Property type: Residential income, 2-4 units; Total units: 2 (both 1-bedroom, 1-bath); Number of buildings: 1; Lot size per public records: 0.1439 acres
- Financial info: Seller may consider concessions; No leases currently considered
Exterior
- Parking: Driveway; Off-street parking
- Utilities: Public water; Electric service by Ameren
- Home design: Residential income property (2–4 units); One-story building; Two units in one building
- Construction: Vinyl siding; Concrete perimeter foundation; Built area per public records: 1,056 above-grade finished
- Exterior features: Back yard; Chain link fencing
Interior
- Kitchen: Oven; Free-standing gas range; Gas range; Refrigerator
- Bedrooms: Two 1-bedroom units (one building)
- Flooring: Carpet; Laminate
- Bathrooms: Each unit has 1 bathroom
- Heating & cooling: Forced air heating; Central air conditioning; Ceiling fan(s)
- Interior features: Oven; Free-standing gas range; Gas range; Refrigerator
- Laundry & utility: Basement with storage space and sump pump (unfinished)
Neighborhood map
What this means for you Summary
Snapshot
- This is a 2 × 2-bed/2.0-bath units multifamily listed at $160k.
Deal economics
- At list price, monthly cash flow is $743 ($9k/yr) — positive. Per door: $372/mo.
- The deal already cash-flows at list — no discount required.
- Meets the 1% rule at list price ($2k rent vs $160k).
- Cap rate 11.9% vs local median 6.5% in St. Ann — top-decile yield for the area; either an underpriced asset or a hidden risk that comps aren't pricing in. Stress-test before assuming the spread holds.
Location & tenants
- Location reads: area grade B — affects rentability + tenant quality, not the cash-flow math above.
- Ritenour (suburban): math 13% / reading 27% proficiency, ranked #304 of 324 in MO (top 94%) — low school quality limits family demand, transient renter base, plan for 1-2y turnover; 66% free/reduced lunch — lower-income household profile, screen leases tightly.
- Zoned schools: Buder Elem. (math 17% / reading 22%, grade F, #941 of 1,115 statewide, top 86%, 406 students, 99% FRL); Ritenour Sr. High (math 9% / reading 36%, grade F, #455 of 521 statewide, top 88%, 1,873 students, 100% FRL) — zoned schools average 100% FRL vs 66% district-wide (34 pts higher); higher-poverty schools than district average — tighter screening recommended.
- Market conditions: Rents rising fast (+4.1%/yr); 61 active listings in the ZIP; 35 comparable units currently listed for rent nearby; rentals lingering (median 44d on market — plan ~5-8 weeks vacancy on turnover, expect pricing pressure); 51% of comp listings sitting > 30 days — soft ceiling on asking rent; 920 units permitted in St. Louis County in 2024 (250 in 5+ unit buildings).
- At $2,290/mo this rent would consume 53% of the median local household income ($52k/yr) (locally 782% of renters already pay >50% of income on rent) — very limited rent-growth headroom before tenants either downsize or default.
Forward outlook
- Local home prices are declining (-3.0%/yr); year-one equity from $1k of loan paydown is wiped out by about $5k of value loss. Plan a longer hold.
- At projected returns (-3.0% appreciation + 4.1% rent growth), your $45k cash investment doubles in ~6 years — after that, you're playing with house money.
Negotiation context
- Only 12 days on market — expect competitive offers; lowballing is unlikely to land.
Risks & watch-outs
- Watch-outs: built in 1943 — expect roof / HVAC / electrical / plumbing capex.
Questions for the listing agent
- Can we see the unit-by-unit rent roll, current vacancy, and any below-market leases? What's the average tenancy length?
- What capital expenditures (roof, boiler, parking lot, exteriors) have been made in the last 5 years, and what's planned in the next 2?
- Built in 1943 — when were the roof, HVAC, electrical panel, plumbing, and water heater last replaced?
- Is there a deadline driving the sale (1031 exchange, divorce, estate, relocation)? That informs how much negotiation room exists.
- What's the average days-on-market for RENTAL listings here right now (not sales)? A rising rental-DOM trend means longer vacancies and softer asking-rent achievability than the comps imply.
- What's the recent tenant-quality profile in this submarket — average credit score on applications, eviction rate, late-payment / NSF rate, and stable-employment percentage? A property-management company in the area should have these aggregated.
- How much new apartment / multifamily construction is in the pipeline within 1–3 miles? Heavy new supply (>2% of stock underway) typically softens rents 12–24 months out; light construction supports rent growth.
Investment metrics
- 1% rule
- 1.43% ✓
- Cap rate
- 11.87%
- Cash-on-cash
- 19.91%
- DSCR
- 1.89
- GRM
- 5.8
CMA / ARV
- ARV (on-the-fly)
- $158,400
- Comps found
- 8
Show comp detail 8 sales within ~0.75 mi
| Address | Dist | Beds/Ba | Sqft | Sold | Price | $/sf | Match |
|---|---|---|---|---|---|---|---|
| 10225 Saint Katherine Ln | 0.02mi | 2/2.0 | 1,056 (0%) | 7mo | $159,900 | $151 | 93 |
| 3430 Saint Mark Ln | 0.13mi | 2/2.0 | 1,100 (+4%) | 14mo | $165,000 | $150 | 75 |
| 3409 Saint Gregory Ln | 0.18mi | 2/2.0 | 1,100 (+4%) | 12mo | $158,900 | $144 | 75 |
| 3403 Saint Mark Ln | 0.13mi | 2/2.0 | 1,100 (+4%) | 20mo | $167,000 | $152 | 70 |
| 3452 Saint Mark Ln | 0.17mi | 2/2.0 | 1,100 (+4%) | 19mo | $167,000 | $152 | 69 |
| 3515 Saint Luke Ln | 0.31mi | 2/2.0 | 1,100 (+4%) | 15mo | $165,000 | $150 | 66 |
| 10554 Saint Michael Ln | 0.56mi | 2/2.0 | 1,176 (+11%) | 4mo | $169,900 | $144 | 51 |
| 10538 Saint Michael Ln | 0.55mi | 2/2.0 | 1,176 (+11%) | 21mo | $165,000 | $140 | 38 |
Match score weights: distance 35% · size 25% · config 20% · recency 20%. Top-matched comps best support the ARV.
Projected returns pro-forma
-3.0% appreciation · 4.14% rent growth · sell at horizon
- IRR
- 13.3%
- Equity multiple
- 1.54×
- Total profit
- $24,073
- Equity at exit
- $23,857
- IRR
- 23.0%
- Equity multiple
- 3.08×
- Total profit
- $93,110
- Equity at exit
- $13,834
Cash invested: $44,800 (down + closing). Projections, not guarantees.
Landlord ↔ Tenant lean methodology
- Overall (STATE)
- 81 Strongly Landlord-Friendly
- State Missouri
- 81 Strongly Landlord-Friendly · R+10
- County
- — inherits STATE
- City
- — inherits STATE
ZIP-level market 63074
- Rents YoY
- 4.1%
- Active inventory
- 61
- Price-to-rent
- 11.6×
Monthly cashflow live
- Estimated rent
- $2,290 high interval (Pro) →
- Mortgage (P&I)
- −$839
- Tax from tax record
- −$160 /mo · $1,922/yr
- Insurance
- −$67
- HOA
- −$0
- Vacancy / Maint / Mgmt
- −$481
- Net cashflow
- $743
Break-even live
Sensitivity live
| Price | -10% $834 | -5% $788 | +0% $743 | +5% $698 | +10% $653 |
|---|---|---|---|---|---|
| Rent | -10% $562 | -5% $653 | +0% $743 | +5% $834 | +10% $924 |
| Rate | -1.0pp $824 | -0.5pp $784 | base $743 | +0.5pp $702 | +1.0pp $660 |
2-unit breakdown (identical units grouped — click to expand)
| Units | Beds | Baths | Est. rent |
|---|---|---|---|
| 2× units | 2 | 2 | $2,290 |
| #1 | 2 | 2 | $1,145 |
| #2 | 2 | 2 | $1,145 |
| Total (2 units) | $2,290 | ||
UW: 25.0% down · 7.5% · 30yr · 1.5% tax · 5.0% vac · 8.0% maint · 8.0% mgmt
Financing live
Cash to close
- Down payment
- $40,000
- Closing costs
- $4,800
- Reserves months
- —
- Total cash needed
- —
Loan-product check · same deal, 3 products live
Conventional
25% down · 7.5% · 30yr
- Down + closing
- —
- Monthly P&I
- —
- Monthly cashflow
- —
- DSCR
- —
- Eligible?
- —
Personal DTI + credit; lowest rate.
DSCR
20% down · 8.5% · 30yr
- Down + closing
- —
- Monthly P&I
- —
- Monthly cashflow
- —
- DSCR
- —
- Eligible?
- —
No personal income docs; deal must DSCR.
Hard money
10% down · 12.0% · 12mo
- Down + closing
- —
- Monthly P&I
- —
- Monthly cashflow
- —
- DSCR
- —
- Eligible?
- —
Short-term bridge; refi at stabilization.
Rent comps 35 comps
| Address | Beds | Baths | Sqft | Rent | $/sqft | DOM | Units | Dist |
|---|---|---|---|---|---|---|---|---|
| 10214 Saint Anthony Ln Saint Ann, MO | 2.0 | 1.0 | 734 | $1,200 | $1.63 | 44d | 1 | 0.05mi |
| 10116 Saint Katherine Ln Saint Ann, MO | 3.0 | 1.0 | 984 | $1,865 | $1.90 | 18d | 1 | 0.10mi |
| 3529 Saint Joachim Ln Saint Ann, MO | 2.0 | 1.0 | 900 | $1,450 | $1.61 | 24d | 1 | 0.29mi |
| 3529 Saint Joachim Ln Unit NA St Ann, MO | 2.0 | 1.0 | 900 | $1,450 | $1.61 | 21d | 1 | 0.29mi |
| 10205 Saint Daniel Ln Saint Ann, MO | 2.0 | 1.0 | 792 | $1,450 | $1.83 | 44d | 1 | 0.33mi |
| 3434 Sims Ave Saint Ann, MO | 3.0 | 1.5 | 988 | $1,545 | $1.56 | 44d | 1 | 0.36mi |
| 10124 Saint Martha Ln Saint Ann, MO | 1.0 | 1.0 | 1400 | $890 | $0.64 | 15d | 1 | 0.40mi |
| 3219 Royalton Ave Saint Louis, MO | 2.0 | 1.0 | 792 | $1,095 | $1.38 | 22d | 1 | 0.65mi |
| 3209 Royalton Ave Saint Louis, MO | 2.0 | 1.0 | 805 | $1,150 | $1.43 | 44d | 1 | 0.67mi |
| 3213 Airway Ave Saint Louis, MO | 3.0 | 1.0 | 1215 | $1,550 | $1.28 | 44d | 1 | 0.73mi |
| 9618 De Porres Ln Saint Louis, MO | 2.0 | 1.0 | 875 | $1,200 | $1.37 | 44d | 1 | 0.74mi |
| 9675 Muriel Ave Unit 9733 Overland, MO | 2.0 | 1.5 | 830 | $1,200 | $1.45 | 3d | 1 | 0.77mi |
| 9675 Muriel Ave Unit 9627 Overland, MO | 2.0 | 1.5 | 830 | $1,200 | $1.45 | 44d | 1 | 0.77mi |
| 10069 Livingston Ave St Ann, MO | 2.0 | 1.0 | 875 | $1,100 | $1.26 | 24d | 1 | 0.77mi |
| 3961 Jane Ave Unit 3963 St Ann, MO | 2.0 | 1.0 | 750 | $1,195 | $1.59 | 15d | 1 | 0.90mi |
| 9807 Guthrie Ave Saint Louis, MO | 3.0 | 2.0 | 1068 | $1,700 | $1.59 | 24d | 1 | 0.93mi |
| 3648 Edmundson Rd Unit 1 St. Louis, MO | 2.0 | 1.0 | 900 | $995 | $1.11 | 44d | 1 | 0.95mi |
| 3209 Dix Ave Saint Louis, MO | 3.0 | 1.0 | 1122 | $1,550 | $1.38 | 24d | 1 | 0.98mi |
| 9535 Baltimore Ave Saint Louis, MO | 2.0 | 1.0 | 800 | $1,145 | $1.43 | 24d | 1 | 0.99mi |
| 2732 Annapolis Ave Saint Louis, MO | 2.0 | 1.0 | 768 | $1,250 | $1.63 | 44d | 1 | 1.08mi |
| 9457 Harold Dr Saint Louis, MO | 3.0 | 1.0 | 1472 | $1,530 | $1.04 | 22d | 1 | 1.09mi |
| 9448 Harold Dr Saint Louis, MO | 2.0 | 1.0 | 864 | $1,495 | $1.73 | 44d | 1 | 1.10mi |
| 9310 Shirley Gardens Dr Apt C St. Louis, MO | 2.0 | 1.0 | 800 | $1,200 | $1.50 | 44d | 1 | 1.13mi |
| 9310 Shirley Gardens Dr Apt B St. Louis, MO | 2.0 | 1.0 | 800 | $1,100 | $1.38 | 44d | 1 | 1.13mi |
| 9429 Baltimore Ave Saint Louis, MO | 2.0 | 1.0 | 900 | $1,200 | $1.33 | 24d | 1 | 1.17mi |
| 10742 Tropic Dr Unit VACANT St Ann, MO | 2.0 | 1.0 | 800 | $1,200 | $1.50 | 44d | 1 | 1.18mi |
| 10145 Cabana Club Dr St Ann, MO | 1.0–2.0 | 1.0–2.0 | 776 | $1,060 | $1.37 | 44d | 8 | 1.20mi |
| 11042 Florence Ave Saint Ann, MO | 3.0 | 1.0 | 864 | $1,300 | $1.50 | 13d | 1 | 1.20mi |
| 10788 Tropic Dr Saint Ann, MO | 2.0 | 1.0 | 828 | $1,260 | $1.52 | 44d | 1 | 1.22mi |
| 4120 Geraldine Ave St Ann, MO | 2.0 | 1.5 | 922 | $1,200 | $1.30 | 18d | 1 | 1.22mi |
| 3010 Woodson Rd Breckenridge Hills, MO | 1.0 | 1.0 | 850 | $895 | $1.05 | 44d | 1 | 1.25mi |
| 10525 Roseton Ct Saint Louis, MO | 2.0 | 2.0 | 1500 | $1,500 | $1.00 | 44d | 1 | 1.28mi |
| 11120 Graben Dr St Ann, MO | 1.0–2.0 | 1.0–1.5 | 850 | $1,250 | $1.47 | 2d | 14 | 1.29mi |
| 11276 Liana Ln Saint Ann, MO | 2.0 | 1.0 | 780 | $1,189 | $1.52 | 5d | 1 | 1.37mi |
| 9183 Harold Dr Saint Louis, MO | 3.0 | 1.0 | 912 | $1,200 | $1.32 | 44d | 1 | 1.48mi |
Listing history 9 events
-
2026-06-18days on market $160,000 Active 12 DOM
-
2026-06-17days on market $160,000 Active 11 DOM
-
2026-06-16days on market $160,000 Active 10 DOM
-
2026-06-15days on market $160,000 Active 9 DOM
-
2026-06-13days on market $160,000 Active 7 DOM
-
2026-06-09days on market $160,000 Active 3 DOM
-
2026-06-08days on market $160,000 Active 2 DOM
-
2026-06-07remarks 699-char remark
-
2026-06-07$160,000 Active 1 DOM
ⓘ Source: listings_history table (triggers on properties + properties_extension) + one-shot
backfill from property_details.listing_events for pre-trigger history.
Tax reassessment forecast MO · Resets to sale price
- Current annual tax
- $1,922 · $160/mo
- Projected year-2 tax
- $1,922 · $160/mo
- Expected delta
- $0/yr ($0/mo · 0.0%)
ⓘ Screening estimate from a state-policy table — verify with the county assessor before closing.
Climate risk First Street
- Flood 1/10 Low FEMA zone X (unshaded) · 0% chance over 30 yrs
- Wildfire 1/10 Low
- Heat 4/10 Moderate 7 d/yr ≥106°F today · 21 d/yr by 30 yrs out
- Wind 2/10 Low 100% chance of damaging wind over 30 yrs
- Air quality 2/10 Low 1 unhealthy d/yr today · 3 by 30 yrs out
Nearby sold comps map
Loading sold comps map…
Walkable amenities ~0.75 mi
Loading nearby amenities…
Taxation est. · year 1
- Rental income
- $27,480
- − Mortgage interest
- −$8,962
- − Property taxes
- −$1,922
- − Insurance
- −$800
- − Repairs & maintenance
- −$2,198
- − Management
- −$2,198
- − Depreciation
- −$4,655
- Taxable income
- $6,744
- Est. tax owed @ 24.0%
- −$1,619
- After-tax cash flow
- $7,300/yr
For passive investors: Depreciation is non-cash, so a rental often shows a tax loss while cash-flowing — sheltering income. Rental losses are passive: they offset passive income freely, and up to $25,000/yr can offset ordinary (W-2) income if you actively participate and your MAGI is under $100k (phasing out to $0 by $150k); unused losses carry forward. On sale, claimed depreciation is recaptured at up to 25%, and gains may owe capital-gains tax (a 1031 exchange can defer both). Figures are a year-1 estimate at your 24.0% rate — not tax advice; consult a CPA.
Schools (NCES district)
- District
- Ritenour
- NCES district ID
- 2926640
- Math proficiency
- 13% ▼ -14.00%
- Reading proficiency
- 27% ▼ -7.00%
- Median HH income
- $41,410
- Composite
- 17.04/100
- National rank
- #9125
- State rank
- #304 of 324 in MO
Livability — St. Ann
No livability data for this city. (Only ~50 U.S. cities are tracked.)
Census & demographics
- Census place
- St. Ann, MO
- County
- Saint Louis County · 888,823 people
- City population
- 16,237
- Metro
- St. Louis, MO-IL
- Population (ZIP)
- 15,793
- Household income
- $51,610
- Rent vs Own
- Severe rent burden
- 782.0
Population outlook (St. Louis County) Hauer SSP2
- Today (2025)
- 1,025,227 people
- By 2030
- 1,028,023 · +0.3%
- By 2040
- 1,020,940 · -0.4%
- By 2050
- 1,007,280 · -1.8%
- By 2075
- 987,277 · -3.7%
- By 2100
- 921,984 · -10.1%
Race, ethnicity, and origin ACS 2023
- Neighborhood character
- Diverse neighborhood (Simpson 0.65)
- Race & ethnicity
- White 50% Black 27% Hispanic / Latino 19% Two or more races 5% Asian 2%
- Hispanic origin (detail)
- Mexican 16%
- Common ancestry
- Lithuanian 2% Italian 1% Romanian 1%
- Foreign-born
- 13% · Canada, China
- Languages at home
- 80% English-only · Spanish 17% Chinese 1% German/W. Germanic 1%
Political lean MEDSL · St. Louis
- 2024 margin
- Strong D (+23.4) · D 60.8% · R 37.4% · Other 1.7%
- 2008→2024 swing
- +3.5pp toward D · 2008: 19.9pp · 2024: 23.4pp
- All cycles
- 2024: D+23.4 2020: D+24.0 2016: D+16.2 2012: D+13.7 2008: D+19.9
Not yet ingested
- Civics
- —
Market trends
- HPI YoY
- ▼ -242.89%
- Current HPI
- 210.6588
- Rent YoY
- ▲ 4.14%
- Metro
- St. Louis, MO-IL
- State GDP YoY
- ▲ 1.84%
- F500 in state
- 20
Industry mix (Fortune 500 HQ in MO)
| Industry | F500 HQs | Revenue |
|---|---|---|
| Healthcare | 1 | $163B |
|
||
| Insurance | 1 | $21B |
|
||
| Industrial Technology | 1 | $17B |
|
||
| Retail | 1 | $16B |
|
||
| Industrial Distribution | 1 | $10B |
|
||
| Utilities | 1 | $9B |
|
||
Price history
1 event — show timeline
- 2026-06-06 Listed $160,000 MARIS as Distributed by MLS Grid
Property tax history
+2.7%/yrLatest (2022): $1,922 · +0.1% YoY. Source: county tax records.
Cash-flow waterfall
monthlySold comps — $/sqft
last 12 mo · ≤1 miLoading sold comps…