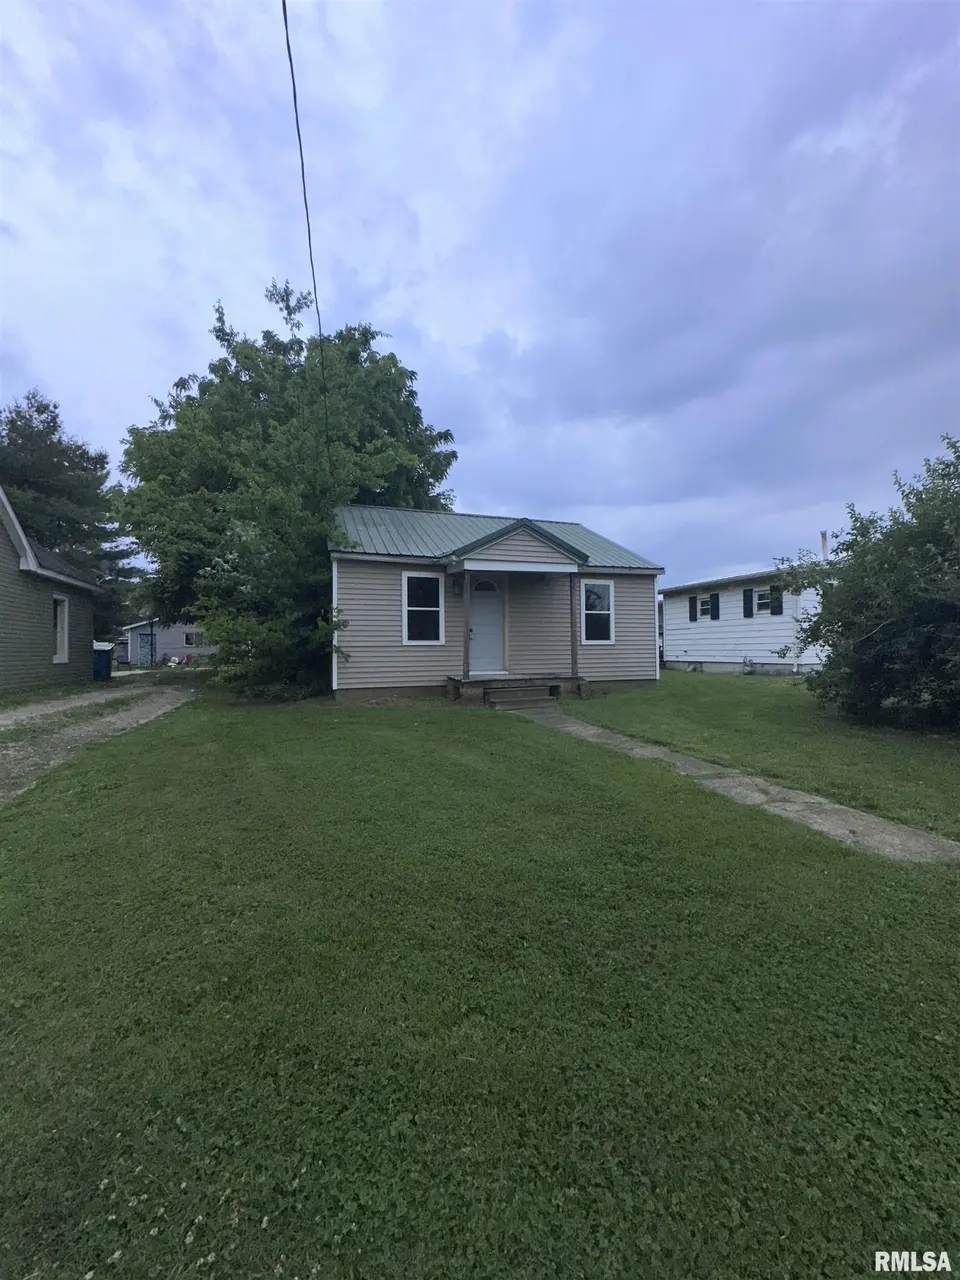
203 East Ave · Anna, IL
Flood risk 1/10 · Minimal
- FEMA flood zone
- X (unshaded)
- Chance of flooding over 30 yrs
- 0.0%
- Est. flood insurance / yr
- $473 – $860
Fire risk 1/10 · Minimal
- Est. fire insurance / yr
- $804 – $1,492
Heat risk 5/10 · Moderate
- Hot days now (above 107°F)
- 7 days/yr
- Hot days in 30 yrs
- 21 days/yr
Wind risk 2/10 · Minimal
- Chance of severe wind over 30 yrs
- 3.0%
Air-quality risk 1/10 · Minimal
- Unhealthy air days now
- 0 days/yr
- Unhealthy air days in 30 yrs
- 0 days/yr
Risk factors via First Street. Map © Google.
Why this score? — see what drove the B+ grade
The composite is a weighted blend of 9 inputs, each scored 0–100. Each bar is that input's sub-score; the figure is the points it added to the 100-point composite (weight × sub-score).
- Cash flow +30.0/30.0
- ARV discount +15.0/15.0
- 1% rule +10.0/10.0
- DSCR +10.0/10.0
- Livability +2.8/5.0
- Rent growth +2.5/5.0
- Condition / age +2.5/5.0
- Schools +2.4/10.0
- Appreciation +0.0/10.0
$45,000
🖨 Deal sheet (PDF) 📄 Offer letter ✓ Due diligence
Listing remarks
INVESTORS TAKE NOTE!! THIS WOULD MAKE A PERFECT INVESTMENT PROPERTY OR PERFECT FOR THE HANDYMAN WANTING TO OWN A HOME. SELLER PUT MUCH LOVE INTO THE REMODEL OF THIS HOUSE. AS WE ALL KNOW SOMETIMES LIFE GETS IN THE WAY AND WE CAN'T GET SOME ITEMS FINISHED. THIS COULD BE THE CUTEST HOME FOR SOMEONE WITH A GOAL AND DREAM. CALL TODAY FOR MORE INFOMRATION AND TO MAKE YOUR APPOINTMENT TO SEE WHAT POTENTIAL IS INSIDE.
Key facts
- 8,712 sq ft lot
- Parking
- Built 1950
Property features AI
Finance
- Other: Living area reported as 930
Exterior
- Parking: Alley access (no garage spaces)
- Utilities: Public water; Public sewer
- Home design: Single family residence; Not new construction
- Construction: Metal roof; Built in 1950
- Exterior features: Shed(s); Level lot; Paved road access; Lot approximately 50 x 175
Interior
- Kitchen: No appliances listed
- Bedrooms: 2 bedrooms (one on main level, one on main level)
- Flooring: Carpet in one bedroom; Other flooring in second bedroom; Hardwood in living room; Laminate in kitchen
- Bathrooms: 1 full bathroom
- Heating & cooling: Central air conditioning; Forced air heating; No heating in some areas listed as None
- Interior features: No appliances included; No fireplaces; Crawl space basement
- Laundry & utility: No laundry appliances listed
Neighborhood map
What this means for you Summary
Snapshot
- This is a 2-bed/1.0-bath single-family listed at $45k.
Deal economics
- At list price, monthly cash flow is $310 ($4k/yr) — positive.
- The deal already cash-flows at list — no discount required.
- Meets the 1% rule at list price ($750 rent vs $45k).
- Recommended offer: $44k (1.5% below list) — sets the bar for market timing.
- Cap rate 14.6% vs local median 5.6% in Anna — top-decile yield for the area; either an underpriced asset or a hidden risk that comps aren't pricing in. Stress-test before assuming the spread holds.
Location & tenants
- Location reads 56/100 on livability (#1,184 in IL) — a working-class tenant base; expect higher turnover. Strengths: cost of living A+, housing A+; Watch: crime F, amenities F, commute F.
- Anna Jonesboro Chsd 81 (town): math 20% / reading 30% proficiency, ranked #623 of 919 in IL (top 68%) — low school quality limits family demand, transient renter base, plan for 1-2y turnover.
- Zoned schools: Anna-Jonesboro High School (math 12% / reading 22%, grade F, #430 of 693 statewide, top 66%, 497 students, 0% FRL).
- Market conditions: 39 active listings in the ZIP; 1 comparable units currently listed for rent nearby; 10 units permitted in Union County in 2024 (0 in 5+ unit buildings).
Forward outlook
- Local home prices are declining (-3.0%/yr); year-one equity from $311 of loan paydown is wiped out by about $1k of value loss. Plan a longer hold.
- Union County population projected at -18% by 2050 — secular population decline; favor cash flow + early exit over multi-decade hold.
- At projected returns (-3.0% appreciation + 3.0% rent growth), your $13k cash investment doubles in ~5 years — after that, you're playing with house money.
Negotiation context
- It's been on market 21 days — a 2% lower offer ($44k) is reasonable based on typical stale-listing flexibility.
Risks & watch-outs
- Watch-outs: built in 1950 — expect roof / HVAC / electrical / plumbing capex.
- Climate carrying-cost: extreme-heat days projected 7→21/yr by 2055 (HVAC capex compounding) — expect insurance premiums to compound above CPI over the hold.
Questions for the listing agent
- Built in 1950 — when were the roof, HVAC, electrical panel, plumbing, and water heater last replaced?
- Is there a deadline driving the sale (1031 exchange, divorce, estate, relocation)? That informs how much negotiation room exists.
- Schools are F-rated, which usually means shorter tenancies and higher turnover. Who's the typical renter profile here, and what's been the actual vacancy rate?
- Crime grade is F in this area — have there been break-ins, vandalism, or insurance claims at this property in the last 3 years? What carrier currently insures it and at what premium?
- What's the average days-on-market for RENTAL listings here right now (not sales)? A rising rental-DOM trend means longer vacancies and softer asking-rent achievability than the comps imply.
- What's the recent tenant-quality profile in this submarket — average credit score on applications, eviction rate, late-payment / NSF rate, and stable-employment percentage? A property-management company in the area should have these aggregated.
- How much new for-sale + rental construction is in the pipeline within 1–3 miles? Heavy new supply typically softens prices + rents 12–24 months out; constrained supply supports both.
Investment metrics
- 1% rule
- 1.67% ✓
- Cap rate
- 14.56%
- Cash-on-cash
- 29.51%
- DSCR
- 2.31
- GRM
- 5.0
CMA / ARV
- ARV (on-the-fly)
- $71,610
- Comps found
- 11
Show comp detail 11 sales within ~0.75 mi
| Address | Dist | Beds/Ba | Sqft | Sold | Price | $/sf | Match |
|---|---|---|---|---|---|---|---|
| 105 Evergreen Dr | 0.34mi | 2/1.5 | 960 (+3%) | 2mo | $132,000 | $138 | 75 |
| 206 Springfield Ave | 0.26mi | 2/1.0 | 960 (+3%) | 22mo | $97,000 | $101 | 64 |
| 114 Evergreen Dr | 0.42mi | 3/1.0 (+1) | 1,000 (+8%) | 2mo | $115,000 | $115 | 61 |
| 314 E Douglas St | 0.48mi | 2/1.0 | 840 (-10%) | 8mo | $68,500 | $82 | 55 |
| 304 Douglas St | 0.47mi | 2/1.0 | 840 (-10%) | 9mo | $41,000 | $49 | 55 |
| 408 N Main St | 0.59mi | 2/1.0 | 816 (-12%) | 2mo | $54,900 | $67 | 50 |
| 311 Brady Mill Rd | 0.35mi | 2/1.0 | 1,032 (+11%) | 24mo | $70,000 | $68 | 46 |
| 202 N Wilson St | 0.60mi | 1/1.0 (-1) | 816 (-12%) | 6mo | $50,000 | $61 | 42 |
| 211 Forest St | 0.56mi | 1/1.0 (-1) | 816 (-12%) | 13mo | $83,000 | $102 | 38 |
| 706 Mckinley St | 0.63mi | 2/1.0 | 820 (-12%) | 18mo | $63,000 | $77 | 35 |
| 405 Oak St | 0.59mi | 3/1.5 (+1) | 1,047 (+13%) | 21mo | $70,000 | $67 | 27 |
Match score weights: distance 35% · size 25% · config 20% · recency 20%. Top-matched comps best support the ARV.
Projected returns pro-forma
-3.0% appreciation · 3.0% rent growth · sell at horizon
- IRR
- 24.0%
- Equity multiple
- 1.99×
- Total profit
- $12,439
- Equity at exit
- $6,710
- IRR
- 31.8%
- Equity multiple
- 3.87×
- Total profit
- $36,221
- Equity at exit
- $3,891
Cash invested: $12,600 (down + closing). Projections, not guarantees.
Landlord ↔ Tenant lean methodology
- Overall (STATE)
- 43 Moderately Tenant-Leaning
- State Illinois
- 43 Moderately Tenant-Leaning · D+7
- County
- — inherits STATE
- City
- — inherits STATE
ZIP-level market 62906
- Home prices YoY
- -13.6%
- Active inventory
- 39
- Price-to-rent
- 5.0×
Monthly cashflow live
- Estimated rent
- $750 medium interval (Pro) →
- Mortgage (P&I)
- −$236
- Tax from tax record
- −$28 /mo · $335/yr
- Insurance
- −$19
- HOA
- −$0
- Vacancy / Maint / Mgmt
- −$158
- Net cashflow
- $310
Break-even live
Sensitivity live
| Price | -10% $335 | -5% $323 | +0% $310 | +5% $297 | +10% $284 |
|---|---|---|---|---|---|
| Rent | -10% $251 | -5% $280 | +0% $310 | +5% $340 | +10% $369 |
| Rate | -1.0pp $333 | -0.5pp $321 | base $310 | +0.5pp $298 | +1.0pp $286 |
UW: 25.0% down · 7.5% · 30yr · 1.5% tax · 5.0% vac · 8.0% maint · 8.0% mgmt
Financing live
Cash to close
- Down payment
- $11,250
- Closing costs
- $1,350
- Reserves months
- —
- Total cash needed
- —
Loan-product check · same deal, 3 products live
Conventional
25% down · 7.5% · 30yr
- Down + closing
- —
- Monthly P&I
- —
- Monthly cashflow
- —
- DSCR
- —
- Eligible?
- —
Personal DTI + credit; lowest rate.
DSCR
20% down · 8.5% · 30yr
- Down + closing
- —
- Monthly P&I
- —
- Monthly cashflow
- —
- DSCR
- —
- Eligible?
- —
No personal income docs; deal must DSCR.
Hard money
10% down · 12.0% · 12mo
- Down + closing
- —
- Monthly P&I
- —
- Monthly cashflow
- —
- DSCR
- —
- Eligible?
- —
Short-term bridge; refi at stabilization.
Rent comps 1 comps
| Address | Beds | Baths | Sqft | Rent | $/sqft | DOM | Units | Dist |
|---|---|---|---|---|---|---|---|---|
| 204 W Jefferson St Apt 3A Anna, IL | 2.0 | 1.0 | 600 | $750 | $1.25 | 44d | 1 | 0.80mi |
Listing history 16 events
-
2026-06-21days on market $45,000 Under Contract 21 DOM
-
2026-06-18days on market $45,000 Under Contract 19 DOM
-
2026-06-17days on market $45,000 Under Contract 18 DOM
-
2026-06-16days on market $45,000 Under Contract 17 DOM
-
2026-06-15days on market $45,000 Under Contract 16 DOM
-
2026-06-13days on market $45,000 Under Contract 14 DOM
-
2026-06-12days on market $45,000 Under Contract 13 DOM
-
2026-06-09days on market $45,000 Under Contract 10 DOM
-
2026-06-08days on market $45,000 Under Contract 9 DOM
-
2026-06-07days on market $45,000 Under Contract 8 DOM
-
2026-06-07statusdays on market $45,000 Under Contract 7 DOM
-
2026-06-04days on market $45,000 Active 4 DOM
-
2026-06-02days on market $45,000 Active 3 DOM
-
2026-06-01days on market $45,000 Active 2 DOM
-
2026-05-31remarks 414-char remark
-
2026-05-31$45,000 Active 1 DOM
ⓘ Source: listings_history table (triggers on properties + properties_extension) + one-shot
backfill from property_details.listing_events for pre-trigger history.
Tax reassessment forecast IL · Partial reset (capped growth)
- Current annual tax
- $335 · $28/mo
- Projected year-2 tax
- $678 · $57/mo
- Expected delta
- +$343/yr (+$29/mo · 102.7%)
ⓘ Screening estimate from a state-policy table — verify with the county assessor before closing.
Climate risk First Street
- Flood 1/10 Low FEMA zone X (unshaded) · 0% chance over 30 yrs
- Wildfire 1/10 Low
- Heat 5/10 Major 7 d/yr ≥107°F today · 21 d/yr by 30 yrs out
- Wind 2/10 Low 3% chance of damaging wind over 30 yrs
- Air quality 1/10 Low 0 unhealthy d/yr today · 0 by 30 yrs out
Nearby sold comps map
Loading sold comps map…
Walkable amenities ~0.75 mi
Loading nearby amenities…
Taxation est. · year 1
- Rental income
- $9,000
- − Mortgage interest
- −$2,521
- − Property taxes
- −$335
- − Insurance
- −$225
- − Repairs & maintenance
- −$720
- − Management
- −$720
- − Depreciation
- −$1,309
- Taxable income
- $3,171
- Est. tax owed @ 24.0%
- −$761
- After-tax cash flow
- $2,958/yr
For passive investors: Depreciation is non-cash, so a rental often shows a tax loss while cash-flowing — sheltering income. Rental losses are passive: they offset passive income freely, and up to $25,000/yr can offset ordinary (W-2) income if you actively participate and your MAGI is under $100k (phasing out to $0 by $150k); unused losses carry forward. On sale, claimed depreciation is recaptured at up to 25%, and gains may owe capital-gains tax (a 1031 exchange can defer both). Figures are a year-1 estimate at your 24.0% rate — not tax advice; consult a CPA.
Schools (NCES district)
- District
- Anna Jonesboro Chsd 81
- NCES district ID
- 1703780
- Math proficiency
- 20% ▲ 5.00%
- Reading proficiency
- 30% ▲ 5.00%
- Median HH income
- $42,213
- Composite
- 24.33/100
- National rank
- #13113
- State rank
- #623 of 919 in IL
Livability — Anna
- Score
- 56/100
- State rank
- #1184
- US rank
- #22395
Category grades
Schools grade is shown separately in the Schools card above.
Census & demographics
- Census place
- Anna, IL
- Population (ZIP)
- 7,218
Population outlook (Union County) Hauer SSP2
- Today (2025)
- 16,606 people
- By 2030
- 16,055 · -3.3%
- By 2040
- 14,875 · -10.4%
- By 2050
- 13,645 · -17.8%
- By 2075
- 10,704 · -35.5%
- By 2100
- 7,880 · -52.5%
Race, ethnicity, and origin ACS 2023
- Neighborhood character
- Predominantly White (93%)
- Race & ethnicity
- White 93% Two or more races 5% Hispanic / Latino 3% Black 1%
- Common ancestry
- Slovak 3% Lithuanian 2% Serbian 2%
- Foreign-born
- 2% · Canada
- Languages at home
- 97% English-only · Spanish 3%
Political lean MEDSL · Union
- 2024 margin
- Solid R (+43.2) · D 27.8% · R 71.0% · Other 1.2%
- 2008→2024 swing
- -31.3pp toward R · 2008: -11.9pp · 2024: -43.2pp
- All cycles
- 2024: R+43.2 2020: R+40.2 2016: R+39.8 2012: R+21.9 2008: R+11.9
Not yet ingested
- Civics
- —
Market trends
- HPI YoY
- ▼ -20.17%
- Current HPI
- 128.4925
- Rent YoY
- —
- Metro
- —
- State GDP YoY
- ▲ 1.59%
- F500 in state
- 60
Industry mix (Fortune 500 HQ in IL)
| Industry | F500 HQs | Revenue |
|---|---|---|
| Insurance | 4 | $201B |
|
||
| Consumer Goods | 4 | $87B |
|
||
| Industrial Machinery | 3 | $64B |
|
||
| Healthcare | 2 | $55B |
|
||
| Retail / Pharmacy | 1 | $148B |
|
||
| Agriculture / Food | 1 | $86B |
|
||
Price history
1 event — show timeline
- 2026-05-30 Listed $45,000 RMLSA as Distributed by MLS Grid
Property tax history
+6.4%/yrLatest (2024): $335 · +23.3% YoY. Source: county tax records.
Cash-flow waterfall
monthlySold comps — $/sqft
last 12 mo · ≤1 miLoading sold comps…