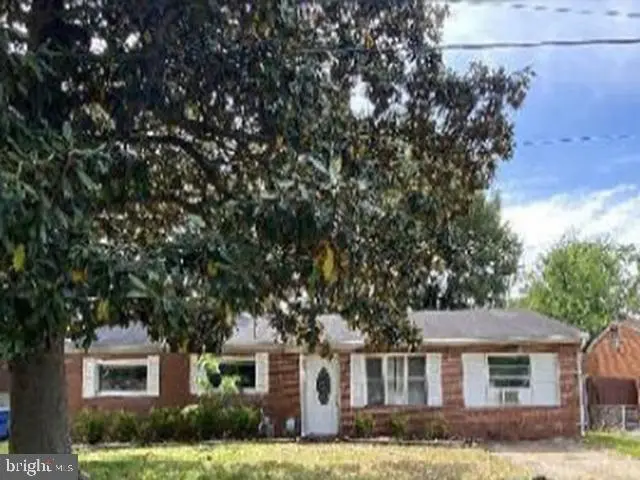
3904 Starboard Rd · Chesapeake, VA
Flood risk 1/10 · Minimal
- FEMA flood zone
- X (unshaded)
- Chance of flooding over 30 yrs
- 0.0%
- Est. flood insurance / yr
- $507 – $1,088
Fire risk 1/10 · Minimal
- Est. fire insurance / yr
- $666 – $1,236
Heat risk 9/10 · Severe
- Hot days now (above 106°F)
- 7 days/yr
- Hot days in 30 yrs
- 16 days/yr
Wind risk 8/10 · Major
- Chance of severe wind over 30 yrs
- 80.0%
Air-quality risk 2/10 · Minimal
- Unhealthy air days now
- 2 days/yr
- Unhealthy air days in 30 yrs
- 2 days/yr
Risk factors via First Street. Map © Google.
Why this score? — see what drove the C+ grade
The composite is a weighted blend of 9 inputs, each scored 0–100. Each bar is that input's sub-score; the figure is the points it added to the 100-point composite (weight × sub-score).
- Cash flow +19.7/30.0
- ARV discount +15.0/15.0
- DSCR +6.2/10.0
- Schools +5.8/10.0
- 1% rule +5.1/10.0
- Rent growth +4.4/5.0
- Livability +3.5/5.0
- Condition / age +2.5/5.0
- Appreciation +0.0/10.0
$172,900
🖨 Deal sheet 📄 Offer letter ✓ Due diligence
Listing remarks
Here is your next renovation project! 3/2 ranch home on a pleasant lot near easy access to downtown, schools, and parks. Needs new roof and other updates. Could be a great fixer upper with upside! Nice curb appeal. See it today! RESERVE AUCTION PROPERTY- Property sold “AS-IS” without contingencies, repairs, warranties, guarantees or representation as to listing accuracy, property information, photo or other depiction included or described herein. Inspect before bidding.
Key facts
- 9,104 sq ft lot
- Built 1964
- Listed 20 days
Property features AI
Exterior
- Utilities: Public water; Public sewer
- Home design: Detached structure; Brick veneer construction; Composite/shingle roof; Slab foundation
- Construction: Estimated year built
- Exterior features: Property is outside city limits; No tidal water
Interior
- Bedrooms: 3 bedrooms on the main level
- Bathrooms: 2 full bathrooms on the main level
- Heating & cooling: Central heating (natural gas); Central air conditioning (natural gas); Natural gas hot water
- Interior features: Estimated living area; No basement
Neighborhood map
What this means for you Summary
Snapshot
- This is a 3-bed/2.0-bath single-family listed at $173k.
Deal economics
- At list price, monthly cash flow is $203 ($2k/yr) — positive.
- The deal already cash-flows at list — no discount required.
- Meets the 1% rule at list price ($2k rent vs $173k).
- Recommended offer: $170k (1.5% below list) — sets the bar for market timing.
- Cap rate 7.7% vs local median 3.7% in Chesapeake — top-decile yield for the area; either an underpriced asset or a hidden risk that comps aren't pricing in. Stress-test before assuming the spread holds.
Location & tenants
- Location reads 70/100 on livability (#236 in VA) — a middle-class / working-renter tenant base. Strengths: employment A+, housing A+, schools A; Watch: crime C-, cost of living C-, amenities F.
- Chesapeake City Public School District (suburban): math 58% / reading 74% proficiency, ranked #31 of 131 in VA (top 24%) — acceptable for families but not a draw, mixed tenant base, ~2y average lease.
- Market conditions: Rents rising fast (+7.6%/yr); 231 active listings in the ZIP; 13 comparable units currently listed for rent nearby; rentals at typical pace (median 17d on market — plan ~3-4 weeks tenant-placement turnaround); solid renter incomes; 597 units permitted in Chesapeake city in 2024 (0 in 5+ unit buildings).
Forward outlook
- Local home prices are declining (-3.0%/yr); year-one equity from $1k of loan paydown is wiped out by about $5k of value loss. Plan a longer hold.
- Chesapeake County population projected at +21% by 2050 — long-run rental-demand tailwind backs the buy-and-hold thesis.
- At projected returns (-3.0% appreciation + 7.6% rent growth), your $48k cash investment doubles in ~10 years — after that, you're playing with house money.
Negotiation context
- It's been on market 20 days — a 2% lower offer ($170k) is reasonable based on typical stale-listing flexibility.
- 2 sale attempts with the ask held roughly flat each time — persistent listings suggest the price (not the market) is what's stuck; bring a comps-based counter.
Risks & watch-outs
- Climate carrying-cost: severe wind risk, 80% chance of damaging wind over 30y; extreme-heat days projected 7→16/yr by 2055 (HVAC capex compounding) — expect insurance premiums to compound above CPI over the hold.
Questions for the listing agent
- Built in 1964 — when were the roof, HVAC, electrical panel, plumbing, and water heater last replaced?
- Is there a deadline driving the sale (1031 exchange, divorce, estate, relocation)? That informs how much negotiation room exists.
- Schools are A-rated — typically a magnet for longer-tenancy family renters. What's the average tenant stay here, and is there a school-zone premium baked into asking?
- What's the average days-on-market for RENTAL listings here right now (not sales)? A rising rental-DOM trend means longer vacancies and softer asking-rent achievability than the comps imply.
- What's the recent tenant-quality profile in this submarket — average credit score on applications, eviction rate, late-payment / NSF rate, and stable-employment percentage? A property-management company in the area should have these aggregated.
- How much new for-sale + rental construction is in the pipeline within 1–3 miles? Heavy new supply typically softens prices + rents 12–24 months out; constrained supply supports both.
Investment metrics
- 1% rule
- 1.01% ✓
- Cap rate
- 7.70%
- Cash-on-cash
- 5.02%
- DSCR
- 1.22
- GRM
- 8.2
CMA / ARV
- ARV (on-the-fly)
- $322,812
- Comps found
- 12
Show comp detail 12 sales within ~0.75 mi
| Address | Dist | Beds/Ba | Sqft | Sold | Price | $/sf | Match |
|---|---|---|---|---|---|---|---|
| 3917 Sextant St | 0.20mi | 4/2.0 (+1) | 1,350 (+2%) | 9mo | $315,000 | $233 | 75 |
| 1704 Rowlock Ct | 0.25mi | 3/1.0 | 1,296 (-2%) | 8mo | $270,000 | $208 | 74 |
| 3929 Galleon Dr | 0.17mi | 4/2.0 (+1) | 1,221 (-8%) | 7mo | $322,000 | $264 | 68 |
| 3980 Port Rd | 0.28mi | 3/2.0 | 1,485 (+12%) | 1mo | $330,000 | $222 | 66 |
| 3725 Bosun Dr | 0.19mi | 4/2.0 (+1) | 1,476 (+12%) | 5mo | $320,000 | $217 | 63 |
| 3932 Sextant St | 0.23mi | 4/2.0 (+1) | 1,221 (-8%) | 11mo | $300,000 | $246 | 62 |
| 243 Jarman Ave | 0.48mi | 3/2.0 | 1,391 (+5%) | 9mo | $280,000 | $201 | 61 |
| 4015 Garwood Ave | 0.51mi | 4/2.0 (+1) | 1,250 (-6%) | 2mo | $310,000 | $248 | 60 |
| 4029 Sea Cliff Rd | 0.39mi | 3/2.0 | 1,485 (+12%) | 2mo | $375,000 | $253 | 60 |
| 1704 Sandy Pines Ct | 0.50mi | 3/2.0 | 1,459 (+10%) | 4mo | $355,900 | $244 | 57 |
| 4020 Sea Cliff Rd | 0.36mi | 3/2.0 | 1,500 (+13%) | 7mo | $350,000 | $233 | 55 |
| 4301 Airline Blvd | 0.73mi | 3/2.0 | 1,488 (+12%) | 3mo | $365,000 | $245 | 43 |
Match score weights: distance 35% · size 25% · config 20% · recency 20%. Top-matched comps best support the ARV.
Projected returns pro-forma
-3.0% appreciation · 7.59% rent growth · sell at horizon
- IRR
- -3.5%
- Equity multiple
- 0.86×
- Total profit
- $-6,634
- Equity at exit
- $25,780
- IRR
- 10.8%
- Equity multiple
- 2.01×
- Total profit
- $49,108
- Equity at exit
- $14,949
Cash invested: $48,412 (down + closing). Projections, not guarantees.
Landlord ↔ Tenant lean methodology
- Overall (STATE)
- 55 Moderately Landlord-Leaning
- State Virginia
- 55 Moderately Landlord-Leaning · D+2
- County
- — inherits STATE
- City
- — inherits STATE
ZIP-level market 23321
- Rents YoY
- 7.6%
- Active inventory
- 231
- Price-to-rent
- 8.2×
Monthly cashflow live
- Estimated rent
- $1,752 high interval (Pro) →
- Mortgage (P&I)
- −$907
- Tax from tax record
- −$203 /mo · $2,435/yr
- Insurance
- −$72
- HOA
- −$0
- Vacancy / Maint / Mgmt
- −$368
- Net cashflow
- $203
Break-even live
UW: 25.0% down · 7.5% · 30yr · 1.5% tax · 5.0% vac · 8.0% maint · 8.0% mgmt
Financing live
Cash to close
- Down payment
- $43,225
- Closing costs
- $5,187
- Reserves months
- —
- Total cash needed
- —
Loan-product check · same deal, 3 products live
Conventional
25% down · 7.5% · 30yr
- Down + closing
- —
- Monthly P&I
- —
- Monthly cashflow
- —
- DSCR
- —
- Eligible?
- —
Personal DTI + credit; lowest rate.
DSCR
20% down · 8.5% · 30yr
- Down + closing
- —
- Monthly P&I
- —
- Monthly cashflow
- —
- DSCR
- —
- Eligible?
- —
No personal income docs; deal must DSCR.
Hard money
10% down · 12.0% · 12mo
- Down + closing
- —
- Monthly P&I
- —
- Monthly cashflow
- —
- DSCR
- —
- Eligible?
- —
Short-term bridge; refi at stabilization.
Rent comps 13 comps
| Address | Beds | Baths | Sqft | Rent | $/sqft | DOM | Units | Dist |
|---|---|---|---|---|---|---|---|---|
| 4100 Sail Ct Unit 4118 Chesapeake, VA | 3.0 | 2.0 | 1100 | $1,500 | $1.36 | 7d | 1 | 0.27mi |
| 4100 Sail Ct Unit 4105 Chesapeake, VA | 3.0 | 2.0 | 1100 | $1,495 | $1.36 | 17d | 1 | 0.27mi |
| 4100 Sail Ct Unit 4124 Chesapeake, VA | 3.0 | 2.0 | 1100 | $1,595 | $1.45 | 14d | 1 | 0.27mi |
| 1507 Hodges Ferry Rd Portsmouth, VA | 3.0 | 1.5 | 1827 | $1,650 | $0.90 | 43d | 1 | 0.86mi |
| 840 Lancer Dr Unit 694 Portsmouth, VA | 3.0 | 1.5 | 1202 | $1,480 | $1.23 | 17d | 1 | 1.07mi |
| 840 Lancer Dr Unit 615 Portsmouth, VA | 2.0 | 1.5 | 1002 | $1,288 | $1.29 | 23d | 1 | 1.07mi |
| 1203 Baskerville Ln Portsmouth, VA | 4.0 | 2.0 | 1550 | $900 | $0.58 | 23d | 1 | 1.21mi |
| 1203 Baskerville Ln Portsmouth, VA | 4.0 | 2.0 | 1550 | $2,300 | $1.48 | 12d | 1 | 1.21mi |
| 1217 Lakeview Dr Portsmouth, VA | 4.0 | 2.0 | 1425 | $2,550 | $1.79 | 7d | 1 | 1.22mi |
| 4642 Greenwood Dr Portsmouth, VA | 2.0 | 1.0 | 946 | $1,550 | $1.64 | 43d | 1 | 1.22mi |
| 1008 Cherokee Rd Portsmouth, VA | 1.0–2.0 | 1.0 | 835 | $1,345 | $1.61 | 43d | 1 | 1.30mi |
| 1017 Hodges Ferry Rd Portsmouth, VA | 2.0 | 1.5 | 880 | $1,350 | $1.53 | 43d | 1 | 1.34mi |
| 207 Robin Rd Portsmouth, VA | 3.0 | 1.5 | 1250 | $1,950 | $1.56 | 7d | 1 | 1.50mi |
Listing history 16 events
-
2026-06-17status $172,900 Pending 20 DOM
-
2026-06-17days on market $172,900 Active 20 DOM
-
2026-06-16days on market $172,900 Active 19 DOM
-
2026-06-15days on market $172,900 Active 18 DOM
-
2026-06-13days on market $172,900 Active 16 DOM
-
2026-06-09days on market $172,900 Active 12 DOM
-
2026-06-08days on market $172,900 Active 11 DOM
-
2026-06-07days on market $172,900 Active 10 DOM
-
2026-06-03days on market $172,900 Active 6 DOM
-
2026-06-02days on market $172,900 Active 5 DOM
-
2026-06-01days on market $172,900 Active 4 DOM
-
2026-05-31days on market $172,900 Active 3 DOM
-
2026-05-28$172,900 Active
-
2025-06-30historical
-
2025-05-30$255,000 Active
-
2006-10-24soldstatus $166,000
ⓘ Source: listings_history table (triggers on properties + properties_extension) + one-shot
backfill from property_details.listing_events for pre-trigger history.
Tax reassessment forecast VA · Resets to sale price
- Current annual tax
- $2,435 · $203/mo
- Projected year-2 tax
- $2,435 · $203/mo
- Expected delta
- $0/yr ($0/mo · 0.0%)
ⓘ Screening estimate from a state-policy table — verify with the county assessor before closing.
Climate risk First Street
- Flood 1/10 Low FEMA zone X (unshaded) · 0% chance over 30 yrs
- Wildfire 1/10 Low
- Heat 9/10 Extreme 7 d/yr ≥106°F today · 16 d/yr by 30 yrs out
- Wind 8/10 Severe 80% chance of damaging wind over 30 yrs
- Air quality 2/10 Low 2 unhealthy d/yr today · 2 by 30 yrs out
Nearby sold comps map
Loading sold comps map…
Walkable amenities ~0.75 mi
Loading nearby amenities…
Taxation est. · year 1
- Rental income
- $21,026
- − Mortgage interest
- −$9,685
- − Property taxes
- −$2,435
- − Insurance
- −$864
- − Repairs & maintenance
- −$1,682
- − Management
- −$1,682
- − Depreciation
- −$5,030
- Taxable loss
- −$353
- Est. tax savings @ 24.0%
- +$85
- After-tax cash flow
- $2,515/yr
For passive investors: Depreciation is non-cash, so a rental often shows a tax loss while cash-flowing — sheltering income. Rental losses are passive: they offset passive income freely, and up to $25,000/yr can offset ordinary (W-2) income if you actively participate and your MAGI is under $100k (phasing out to $0 by $150k); unused losses carry forward. On sale, claimed depreciation is recaptured at up to 25%, and gains may owe capital-gains tax (a 1031 exchange can defer both). Figures are a year-1 estimate at your 24.0% rate — not tax advice; consult a CPA.
Schools (NCES district)
- District
- Chesapeake City Public School District
- NCES district ID
- 5100810
- Math proficiency
- 58% ▼ -29.00%
- Reading proficiency
- 74% ▼ -7.00%
- Median HH income
- $69,356
- Composite
- 57.84/100
- National rank
- #1047
- State rank
- #31 of 131 in VA
Livability — Chesapeake
- Score
- 70/100
- State rank
- #236
- US rank
- #7942
Category grades
Schools grade is shown separately in the Schools card above.
Census & demographics
- Census place
- Chesapeake, VA
- County
- Chesapeake City · 253,091 people
- City population
- 253,091
- Metro
- Virginia Beach-Norfolk-Newport News, VA-NC
- Population (ZIP)
- 40,176
- Household income
- $101,568
- Rent vs Own
- Severe rent burden
- 839.0
Population outlook (Chesapeake County) Hauer SSP2
- Today (2025)
- 263,804 people
- By 2030
- 276,798 · +4.9%
- By 2040
- 299,906 · +13.7%
- By 2050
- 318,284 · +20.7%
- By 2075
- 362,137 · +37.3%
- By 2100
- 372,225 · +41.1%
Race, ethnicity, and origin ACS 2023
- Neighborhood character
- Diverse neighborhood (Simpson 0.63)
- Race & ethnicity
- White 49% Black 37% Two or more races 8% Hispanic / Latino 5% Asian 3%
- Common ancestry
- Romanian 3% Italian 2% Lithuanian 2%
- Foreign-born
- 6% · Canada, Vietnam, South Korea
- Languages at home
- 92% English-only · Spanish 4% Vietnamese 1% Korean 1%
Political lean MEDSL · Chesapeake
- 2024 margin
- Toss-up / Even · D 51.3% · R 47.5% · Other 1.2%
- 2008→2024 swing
- +2.5pp toward D · 2008: 1.3pp · 2024: 3.8pp
- All cycles
- 2024: D+3.8 2020: D+6.5 2016: R+1.3 2012: D+1.1 2008: D+1.3
Not yet ingested
- Civics
- —
Market trends
- HPI YoY
- ▼ -256.23%
- Current HPI
- 295.6473
- Rent YoY
- ▲ 7.59%
- Metro
- Virginia Beach-Norfolk-Newport News, VA-NC
- State GDP YoY
- ▲ 2.40%
- F500 in state
- 50
Industry mix (Fortune 500 HQ in VA)
| Industry | F500 HQs | Revenue |
|---|---|---|
| Aerospace / Defense | 4 | $236B |
|
||
| Technology / Defense | 3 | $32B |
|
||
| Financial Services | 2 | $176B |
|
||
| Utilities | 2 | $27B |
|
||
| Insurance | 2 | $25B |
|
||
| Technology | 2 | $15B |
|
||
Price history
+4.2% since first listed4 events — show timeline
- 2026-05-28 Listed $172,900 BRIGHT MLS
- 2025-06-30 Listing Removed — REINMLS
- 2025-05-30 Listed $255,000 REINMLS
- 2006-10-24 Sold (Public Records) $166,000 Public Records
Property tax history
+4.2%/yrLatest (2025): $2,435 · +4.7% YoY. Source: county tax records.
Cash-flow waterfall
monthlySold comps — $/sqft
last 12 mo · ≤1 miLoading sold comps…