1169 Carnation Dr · Crowley, TX
Flood risk 1/10 · Minimal
- FEMA flood zone
- X (unshaded)
- Chance of flooding over 30 yrs
- 0.0%
- Est. flood insurance / yr
- $507 – $1,088
Fire risk 5/10 · Moderate
- Est. fire insurance / yr
- $1,222 – $2,270
Heat risk 7/10 · Major
- Hot days now (above 108°F)
- 7 days/yr
- Hot days in 30 yrs
- 23 days/yr
Wind risk 6/10 · Moderate
- Chance of severe wind over 30 yrs
- 27.0%
Air-quality risk 3/10 · Minor
- Unhealthy air days now
- 2 days/yr
- Unhealthy air days in 30 yrs
- 3 days/yr
Risk factors via First Street. Map © Google.
Why this score? — see what drove the D- grade
The composite is a weighted blend of 9 inputs, each scored 0–100. Each bar is that input's sub-score; the figure is the points it added to the 100-point composite (weight × sub-score).
- ARV discount +15.0/15.0
- Cash flow +7.5/30.0
- Livability +3.8/5.0
- Rent growth +3.1/5.0
- Schools +2.5/10.0
- Condition / age +2.5/5.0
- 1% rule +2.2/10.0
- DSCR +1.6/10.0
- Appreciation +0.0/10.0
$321,990
🖨 Deal sheet (PDF) 📄 Offer letter ✓ Due diligence
Listing remarks
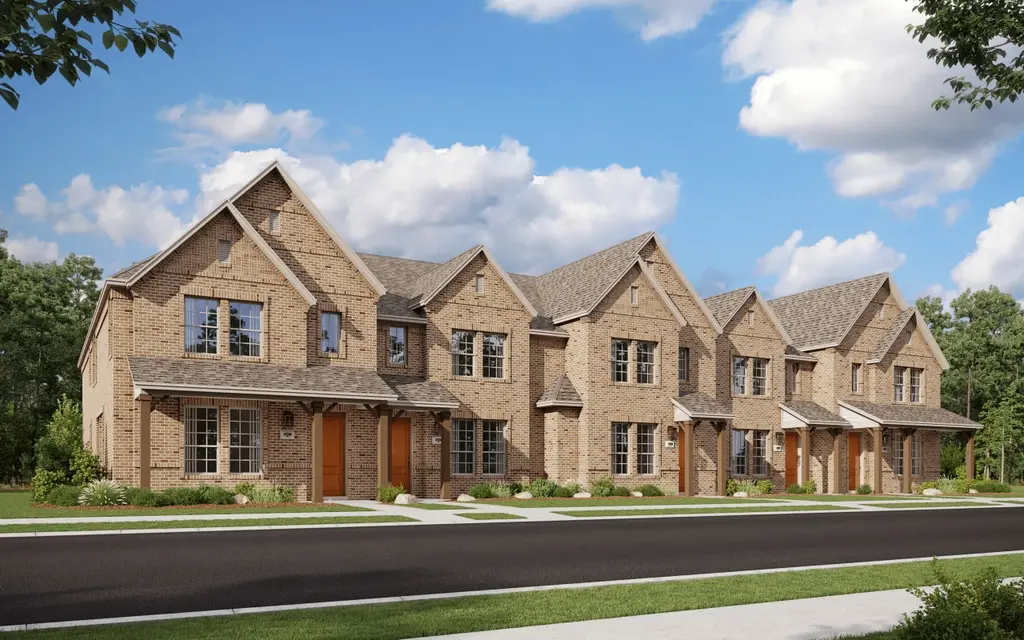
Austin Old World: Exquisite 2 Story Townhouse Floor Plan floor plan highlights: 2 Car Garage, Luxurious L-Shaped Kitchen, Charming Pocket Office, Bonus Loft Area, and more! Introducing the pinnacle of townhouse living embodied in the exquisite Austin Modern floor plan. Offering 3 bedrooms, 2.5 bathrooms, and a generous 2069 square feet of living space, this property stands ready to become your new sanctuary. Enter through the welcoming entry room, adaptable to feature a convenient drop zone for your everyday needs. The open-concept living, kitchen, and dining areas are bathed in natural light, perfectly suited for both vibrant entertaining and serene relaxation. The dining space is adorned
Key facts
- Lshaped kitchen
- Spacious pantry
- Pocket office
Tags
Property features AI
Finance
- Financial info: List price $319,990
Exterior
- Parking: 2 total parking spaces; 2-car garage
- Home design: Single-family property; Active listing
Interior
- Bedrooms: 3 bedrooms
- Bathrooms: 2 full bathrooms and 1 half bathroom (2.5 total)
- Interior features: Spec home — Austin - Old World plan; Living area of 2,085
Neighborhood map
What this means for you Summary
Snapshot
- This is a 3-bed/2.5-bath single-family listed at $322k.
Deal economics
- At list price, monthly cash flow is $-402 ($-5k/yr) — negative.
- To cash-flow at today's rent, offer at most $264k (18.1% below list).
- To meet the 1% rule (rent ≥ 1% of price), the offer needs to be $231k (28.3% below list).
- Recommended offer: $231k (28.3% below list) — sets the bar for 1% rule.
Location & tenants
- Location reads 76/100 on livability (#103 in TX, #3,462 nationally) — a middle-class / working-renter tenant base. Strengths: cost of living A+, housing A+, health & safety A+; Watch: amenities F, commute F.
- Crowley ISD (urban): math 23% / reading 32% proficiency, ranked #643 of 826 in TX (top 78%) — low school quality limits family demand, transient renter base, plan for 1-2y turnover.
- Zoned schools: Bess Race El (math 28% / reading 32%, grade F, #2,500 of 4,322 statewide, top 58%, 665 students, 77% FRL); H F Stevens Middle (math 16% / reading 26%, grade F, #1,387 of 1,662 statewide, top 85%, 747 students, 84% FRL); Crowley H S (math 23% / reading 36%, grade F, #1,112 of 1,632 statewide, top 70%, 2,351 students, 72% FRL) — zoned schools average 78% FRL vs 52% district-wide (26 pts higher); higher-poverty schools than district average — tighter screening recommended.
- Market conditions: Rents rising (+2.3%/yr); 1036 active listings in the ZIP; 40 comparable units currently listed for rent nearby; rentals at typical pace (median 26d on market — plan ~3-4 weeks tenant-placement turnaround); solid renter incomes; 18,938 units permitted in Tarrant County in 2024 (8,336 in 5+ unit buildings).
Forward outlook
- Local home prices are declining (-3.0%/yr); year-one equity from $2k of loan paydown is wiped out by about $10k of value loss. Plan a longer hold.
- Tarrant County population projected at +41% by 2050 — long-run rental-demand tailwind backs the buy-and-hold thesis.
Negotiation context
- It's been on market 48 days — a 3% lower offer ($312k) is reasonable based on typical stale-listing flexibility.
Risks & watch-outs
- Climate carrying-cost: major wind risk, 27% chance of damaging wind over 30y; moderate wildfire risk; extreme-heat days projected 7→23/yr by 2055 (HVAC capex compounding) — expect insurance premiums to compound above CPI over the hold.
Questions for the listing agent
- What do current leases actually rent for vs. the listed asking? Can we see a recent rent roll and the last 12 months of T-12 income?
- It's been on market 48 days. Have you received any prior offers? Is the seller open to a 28% concession, seller financing, or rate buy-down credit?
- Is there a deadline driving the sale (1031 exchange, divorce, estate, relocation)? That informs how much negotiation room exists.
- Schools are D-rated, which usually means shorter tenancies and higher turnover. Who's the typical renter profile here, and what's been the actual vacancy rate?
- The area grade is low — what's the realistic commute time and amenity access for the typical tenant pool here? Any planned neighborhood developments (good or bad) we should know about?
- What's the average days-on-market for RENTAL listings here right now (not sales)? A rising rental-DOM trend means longer vacancies and softer asking-rent achievability than the comps imply.
- What's the recent tenant-quality profile in this submarket — average credit score on applications, eviction rate, late-payment / NSF rate, and stable-employment percentage? A property-management company in the area should have these aggregated.
- How much new for-sale + rental construction is in the pipeline within 1–3 miles? Heavy new supply typically softens prices + rents 12–24 months out; constrained supply supports both.
Investment metrics
- 1% rule
- 0.72% ✗
- Cap rate
- 4.79%
- Cash-on-cash
- -5.35%
- DSCR
- 0.76
- GRM
- 11.6
CMA / ARV
- ARV (median comp)
- $415,932
- List price
- $321,990
- Delta
- -22.59%
- Verdict
- UNDERPRICED
- Comps
- 20 within 1.0 mi
Show comp detail 12 sales within ~0.75 mi
| Address | Dist | Beds/Ba | Sqft | Sold | Price | $/sf | Match |
|---|---|---|---|---|---|---|---|
| 1216 Carnation Dr | 0.03mi | 3/2.0 | 2,088 (+0%) | 3mo | $412,903 | $198 | 94 |
| 1013 Gilbreath Ave | 0.10mi | 3/2.5 | 2,088 (+0%) | 5mo | $429,990 | $206 | 91 |
| 921 Almond Blossom Cir | 0.13mi | 3/2.5 | 2,038 (-2%) | 2mo | $369,493 | $181 | 88 |
| 1112 Carnation Dr | 0.06mi | 3/2.5 | 1,901 (-9%) | 3mo | $345,145 | $182 | 80 |
| 1105 Red Admiral Ln | 0.12mi | 3/2.5 | 2,281 (+9%) | 1mo | $469,972 | $206 | 78 |
| 1001 Gilbreath Ave | 0.08mi | 3/2.5 | 2,276 (+9%) | 4mo | $459,093 | $202 | 78 |
| 917 Almond Blossom Cir | 0.14mi | 3/2.5 | 1,901 (-9%) | 4mo | $349,000 | $184 | 76 |
| 1104 Bolden Ave | 0.16mi | 3/2.5 | 2,273 (+9%) | 2mo | $375,000 | $165 | 76 |
| 1013 Karis Blvd | 0.17mi | 3/2.5 | 2,273 (+9%) | 3mo | $425,000 | $187 | 75 |
| 1112 Rosemary Ln | 0.34mi | 3/2.5 | 2,310 (+11%) | 4mo | $434,689 | $188 | 63 |
| 1048 Almond Blossom Cir | 0.20mi | 3/2.5 | 2,396 (+15%) | 5mo | $399,093 | $167 | 62 |
| 1000 Tulip Pl | 0.32mi | 4/3.0 (+1) | 2,349 (+13%) | 6mo | $410,000 | $175 | 52 |
Match score weights: distance 35% · size 25% · config 20% · recency 20%. Top-matched comps best support the ARV.
Projected returns pro-forma
-3.0% appreciation · 2.28% rent growth · sell at horizon
- IRR
- -26.2%
- Equity multiple
- 0.12×
- Total profit
- $-79,412
- Equity at exit
- $48,010
- IRR
- -25.6%
- Equity multiple
- -0.21×
- Total profit
- $-108,701
- Equity at exit
- $27,840
Cash invested: $90,157 (down + closing). Projections, not guarantees.
Landlord ↔ Tenant lean methodology
- Overall (STATE)
- 87 Strongly Landlord-Friendly
- State Texas
- 87 Strongly Landlord-Friendly · R+5
- County
- — inherits STATE
- City
- — inherits STATE
ZIP-level market 76036
- Home prices YoY
- -25.2%
- Rents YoY
- 2.3%
- Active inventory
- 1036
- Price-to-rent
- 11.6×
Monthly cashflow live
- Estimated rent
- $2,308 high interval (Pro) →
- Mortgage (P&I)
- −$1,689
- Tax est. 1.5%
- −$402 /mo · $4,830/yr
- Insurance
- −$134
- HOA
- −$0
- Vacancy / Maint / Mgmt
- −$485
- Net cashflow
- $-402
Break-even live
Sensitivity live
| Price | -10% $-180 | -5% $-291 | +0% $-402 | +5% $-513 | +10% $-625 |
|---|---|---|---|---|---|
| Rent | -10% $-584 | -5% $-493 | +0% $-402 | +5% $-311 | +10% $-220 |
| Rate | -1.0pp $-240 | -0.5pp $-320 | base $-402 | +0.5pp $-486 | +1.0pp $-570 |
UW: 25.0% down · 7.5% · 30yr · 1.5% tax · 5.0% vac · 8.0% maint · 8.0% mgmt
Financing live
Cash to close
- Down payment
- $80,498
- Closing costs
- $9,660
- Reserves months
- —
- Total cash needed
- —
Loan-product check · same deal, 3 products live
Conventional
25% down · 7.5% · 30yr
- Down + closing
- —
- Monthly P&I
- —
- Monthly cashflow
- —
- DSCR
- —
- Eligible?
- —
Personal DTI + credit; lowest rate.
DSCR
20% down · 8.5% · 30yr
- Down + closing
- —
- Monthly P&I
- —
- Monthly cashflow
- —
- DSCR
- —
- Eligible?
- —
No personal income docs; deal must DSCR.
Hard money
10% down · 12.0% · 12mo
- Down + closing
- —
- Monthly P&I
- —
- Monthly cashflow
- —
- DSCR
- —
- Eligible?
- —
Short-term bridge; refi at stabilization.
Rent comps 40 comps
| Address | Beds | Baths | Sqft | Rent | $/sqft | DOM | Units | Dist |
|---|---|---|---|---|---|---|---|---|
| 1013 Verde Valley Ln Crowley, TX | 4.0 | 2.5 | 2225 | $2,400 | $1.08 | 26d | 1 | 0.84mi |
| 1032 Verde Valley Ln Crowley, TX | 3.0 | 2.5 | 2145 | $2,400 | $1.12 | 20d | 1 | 0.90mi |
| 4004 Arklow St Crowley, TX | 4.0 | 2.0 | 1668 | $2,200 | $1.32 | 7d | 1 | 0.93mi |
| 4004 Arklow St Crowley, TX | 4.0 | 2.0 | 1668 | $2,200 | $1.32 | 26d | 1 | 0.93mi |
| 4013 Drifters Bend Dr Crowley, TX | 4.0 | 2.0 | 1667 | $2,200 | $1.32 | 45d | 1 | 0.96mi |
| 4052 Dublin Ridge Dr Crowley, TX | 3.0 | 2.0 | 1464 | $1,895 | $1.29 | 23d | 1 | 0.98mi |
| 1312 Hunters Ridge Dr Crowley, TX | 4.0 | 3.0 | 2155 | $2,700 | $1.25 | 12d | 1 | 1.02mi |
| 552 Kerry St Crowley, TX | 3.0 | 2.0 | 1636 | $2,295 | $1.40 | 3d | 1 | 1.03mi |
| 705 Loftin St Crowley, TX | 3.0 | 2.0 | 1514 | $2,200 | $1.45 | 45d | 1 | 1.06mi |
| 209 E Eller Ave Crowley, TX | 4.0 | 2.0 | 1978 | $2,200 | $1.11 | 14d | 1 | 1.09mi |
| 521 Mesquite Ave Crowley, TX | 3.0 | 2.0 | 1400 | $1,900 | $1.36 | 26d | 1 | 1.13mi |
| 4224 Old Timber Ln Crowley, TX | 3.0 | 2.0 | 2092 | $2,250 | $1.08 | 45d | 1 | 1.16mi |
| 9125 Nevis Dr Fort Worth, TX | 3.0 | 2.0 | 1497 | $2,159 | $1.44 | 0d | 1 | 1.18mi |
| 708 Cheryl St Crowley, TX | 3.0 | 2.0 | 1659 | $2,100 | $1.27 | 20d | 1 | 1.19mi |
| 9512 Carson Ranch Rd Crowley, TX | 4.0 | 2.0 | 1782 | $2,995 | $1.68 | 23d | 1 | 1.19mi |
| 305 Wilson St Crowley, TX | 2.0 | 2.0 | 1400 | $1,950 | $1.39 | 26d | 1 | 1.22mi |
| 720 Watson Way Crowley, TX | 3.0 | 2.0 | 1782 | $2,095 | $1.18 | 45d | 1 | 1.24mi |
| 4148 Crooked Bend Dr Crowley, TX | 3.0 | 2.0 | 1450 | $2,100 | $1.45 | 14d | 1 | 1.25mi |
| 4148 Crooked Bend Dr Crowley, TX | 3.0 | 2.0 | 1469 | $2,100 | $1.43 | 26d | 1 | 1.25mi |
| 4213 Dublin Ridge Dr Crowley, TX | 3.0 | 2.0 | 1553 | $2,050 | $1.32 | 4d | 1 | 1.25mi |
| 3408 Saint Vincent Rd Fort Worth, TX | 3.0 | 2.0 | 1400 | $2,195 | $1.57 | 45d | 1 | 1.26mi |
| 3416 Saint Vincent Rd Fort Worth, TX | 3.0 | 3.0 | 2033 | $1,895 | $0.93 | 45d | 1 | 1.27mi |
| 404 Canoe Way Crowley, TX | 4.0 | 2.0 | 1827 | $2,195 | $1.20 | 21d | 1 | 1.27mi |
| 9165 Abaco Way Fort Worth, TX | 4.0 | 2.0 | 1705 | $2,095 | $1.23 | 0d | 1 | 1.29mi |
| 4216 Summersweet Ln Crowley, TX | 3.0 | 2.0 | 1636 | $2,129 | $1.30 | 0d | 1 | 1.29mi |
| 9157 Abaco Way Fort Worth, TX | 4.0 | 2.0 | 1705 | $2,149 | $1.26 | 45d | 1 | 1.29mi |
| 9157 Abaco Way Fort Worth, TX | 4.0 | 2.0 | 1705 | $2,089 | $1.23 | 26d | 1 | 1.29mi |
| 744 Walls Blvd Crowley, TX | 4.0 | 2.0 | 1792 | $2,300 | $1.28 | 45d | 1 | 1.30mi |
| 752 Rutherford Dr Crowley, TX | 4.0 | 2.0 | 1856 | $2,209 | $1.19 | 45d | 1 | 1.33mi |
| 9213 Saint Martin Rd Fort Worth, TX | 4.0 | 2.0 | 2302 | $2,229 | $0.97 | 7d | 1 | 1.33mi |
| 432 Canoe Way Crowley, TX | 3.0 | 2.0 | 1589 | $1,945 | $1.22 | 0d | 1 | 1.36mi |
| 520 Horn St Crowley, TX | 4.0 | 2.5 | 2095 | $2,290 | $1.09 | 26d | 1 | 1.40mi |
| 3832 German Pointer Way Fort Worth, TX | 4.0 | 2.5 | 2532 | $3,299 | $1.30 | 7d | 1 | 1.42mi |
| 205 Kennedy Dr Crowley, TX | 3.0 | 2.0 | 1478 | $1,935 | $1.31 | 14d | 1 | 1.44mi |
| 237 Kennedy Dr Crowley, TX | 3.0 | 2.0 | 1478 | $1,920 | $1.30 | 0d | 1 | 1.45mi |
| 601 Porter Ave Crowley, TX | 3.0 | 2.0 | 1563 | $2,195 | $1.40 | 45d | 1 | 1.46mi |
| 200 Kennedy Ct Crowley, TX | 3.0 | 2.0 | 1478 | $1,860 | $1.26 | 45d | 1 | 1.46mi |
| 3400 Quiet Valley Rd Fort Worth, TX | 4.0 | 2.0 | 1904 | $2,100 | $1.10 | 45d | 1 | 1.47mi |
| 204 Kennedy Ct Crowley, TX | 3.0 | 2.0 | 1478 | $2,015 | $1.36 | 4d | 1 | 1.47mi |
| 9100 Saint Barts Rd Fort Worth, TX | 4.0 | 2.0 | 1630 | $1,969 | $1.21 | 45d | 1 | 1.48mi |
Listing history 17 events
-
2026-06-21days on market $321,990 Active 48 DOM
-
2026-06-18days on market $321,990 Active 45 DOM
-
2026-06-17days on market $321,990 Active 44 DOM
-
2026-06-16days on market $321,990 Active 43 DOM
-
2026-06-15days on market $321,990 Active 42 DOM
-
2026-06-13days on market $321,990 Active 40 DOM
-
2026-06-13days on market $321,990 Active 39 DOM
-
2026-06-09days on market $321,990 Active 36 DOM
-
2026-06-08days on market $321,990 Active 35 DOM
-
2026-06-07days on market $321,990 Active 34 DOM
-
2026-06-04days on market $321,990 Active 31 DOM
-
2026-06-03days on market $321,990 Active 30 DOM
-
2026-06-02pricedays on market $321,990 Active 29 DOM
-
2026-06-01days on market $319,990 Active 28 DOM
-
2026-05-31days on market $319,990 Active 27 DOM
-
2026-05-08price $319,990 1166-char remark
-
2026-05-04$317,990 Active 1166-char remark
ⓘ Source: listings_history table (triggers on properties + properties_extension) + one-shot
backfill from property_details.listing_events for pre-trigger history.
Climate risk First Street
- Flood 1/10 Low FEMA zone X (unshaded) · 0% chance over 30 yrs
- Wildfire 5/10 Major
- Heat 7/10 Severe 7 d/yr ≥108°F today · 23 d/yr by 30 yrs out
- Wind 6/10 Major 27% chance of damaging wind over 30 yrs
- Air quality 3/10 Moderate 2 unhealthy d/yr today · 3 by 30 yrs out
Nearby sold comps map
Loading sold comps map…
Walkable amenities ~0.75 mi
Loading nearby amenities…
Taxation est. · year 1
- Rental income
- $27,692
- − Mortgage interest
- −$18,036
- − Property taxes
- −$4,830
- − Insurance
- −$1,610
- − Repairs & maintenance
- −$2,215
- − Management
- −$2,215
- − Depreciation
- −$9,367
- Taxable loss
- −$10,582
- Est. tax savings @ 24.0%
- +$2,540
- After-tax cash flow
- $-2,286/yr
For passive investors: Depreciation is non-cash, so a rental often shows a tax loss while cash-flowing — sheltering income. Rental losses are passive: they offset passive income freely, and up to $25,000/yr can offset ordinary (W-2) income if you actively participate and your MAGI is under $100k (phasing out to $0 by $150k); unused losses carry forward. On sale, claimed depreciation is recaptured at up to 25%, and gains may owe capital-gains tax (a 1031 exchange can defer both). Figures are a year-1 estimate at your 24.0% rate — not tax advice; consult a CPA.
Schools (NCES district)
- District
- Crowley ISD
- NCES district ID
- 4815910
- Math proficiency
- 23% ▼ -15.00%
- Reading proficiency
- 32% ▼ -6.00%
- Median HH income
- $59,810
- Composite
- 25.04/100
- National rank
- #7549
- State rank
- #643 of 826 in TX
Livability — Crowley
- Score
- 76/100
- State rank
- #103
- US rank
- #3462
Category grades
Schools grade is shown separately in the Schools card above.
Census & demographics
- Census place
- Crowley, TX
- County
- Tarrant County · 2,033,669 people
- City population
- 36,044
- Metro
- Dallas-Fort Worth-Arlington, TX
- Population (ZIP)
- 36,044
- Household income
- $97,973
- Rent vs Own
- Severe rent burden
- 584.0
Population outlook (Tarrant County) Hauer SSP2
- Today (2025)
- 2,380,417 people
- By 2030
- 2,578,900 · +8.3%
- By 2040
- 2,974,995 · +25.0%
- By 2050
- 3,350,489 · +40.8%
- By 2075
- 4,216,909 · +77.2%
- By 2100
- 4,741,527 · +99.2%
Race, ethnicity, and origin ACS 2023
- Neighborhood character
- Diverse neighborhood (Simpson 0.65)
- Race & ethnicity
- White 48% Hispanic / Latino 28% Black 20% Two or more races 14% Asian 2%
- Hispanic origin (detail)
- Mexican 23% Puerto Rican 2%
- Common ancestry
- Slovak 3% Italian 2% Serbian 1%
- Foreign-born
- 8% · Canada, Vietnam
- Languages at home
- 79% English-only · Spanish 18% Other Indo-European 1% Vietnamese 1%
Political lean MEDSL · Tarrant
- 2024 margin
- Lean R (+5.1) · D 46.7% · R 51.9% · Other 1.4%
- 2008→2024 swing
- +6.6pp toward D · 2008: -11.7pp · 2024: -5.1pp
- All cycles
- 2024: R+5.1 2020: D+0.2 2016: R+8.7 2012: R+15.7 2008: R+11.7
Not yet ingested
- Civics
- —
Market trends
- HPI YoY
- ▼ -80.45%
- Current HPI
- 238.6365
- Rent YoY
- ▲ 2.28%
- Metro
- Dallas-Fort Worth-Arlington, TX
- State GDP YoY
- ▲ 3.95%
- F500 in state
- 110
Industry mix (Fortune 500 HQ in TX)
| Industry | F500 HQs | Revenue |
|---|---|---|
| Energy | 16 | $1,198B |
|
||
| Technology | 5 | $198B |
|
||
| Engineering / Construction | 4 | $72B |
|
||
| Energy Services | 3 | $60B |
|
||
| Utilities | 3 | $41B |
|
||
| Healthcare | 2 | $330B |
|
||
Cash-flow waterfall
monthlySold comps — $/sqft
last 12 mo · ≤1 miLoading sold comps…