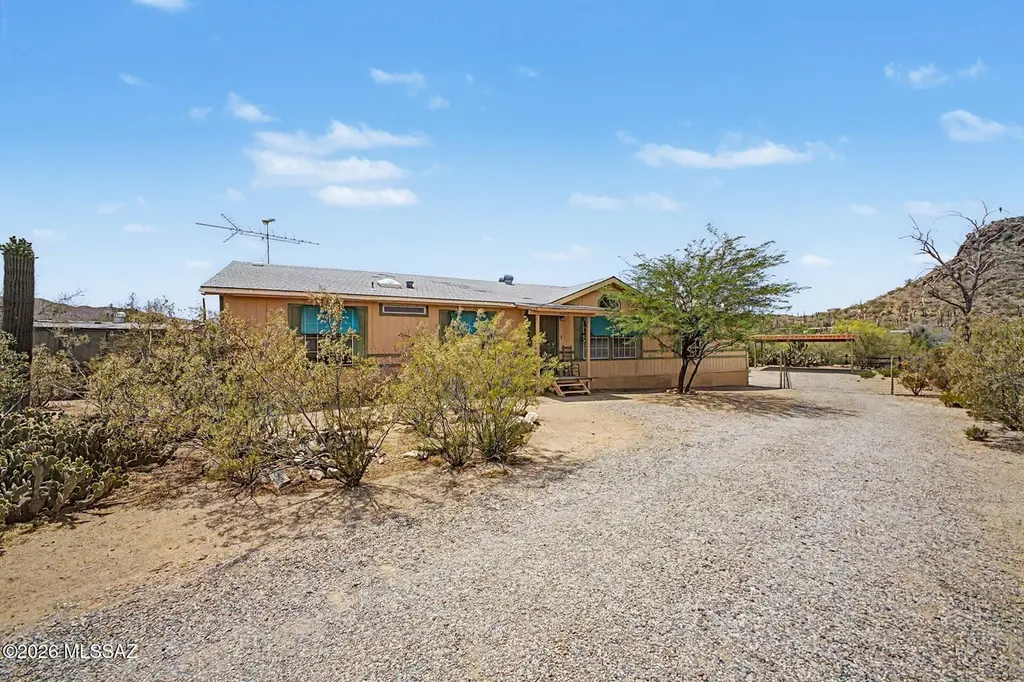
6670 N Desert View Dr · Picture Rocks, AZ
Flood risk 3/10 · Minor
- FEMA flood zone
- X (unshaded)
- Chance of flooding over 30 yrs
- 0.2%
- Est. flood insurance / yr
- $507 – $1,088
Fire risk 5/10 · Moderate
- Est. fire insurance / yr
- $610 – $1,132
Heat risk 8/10 · Major
- Hot days now (above 107°F)
- 6 days/yr
- Hot days in 30 yrs
- 15 days/yr
Wind risk 1/10 · Minimal
- Chance of severe wind over 30 yrs
- —
Air-quality risk 1/10 · Minimal
- Unhealthy air days now
- 0 days/yr
- Unhealthy air days in 30 yrs
- 0 days/yr
Risk factors via First Street. Map © Google.
Why this score? — see what drove the C- grade
The composite is a weighted blend of 9 inputs, each scored 0–100. Each bar is that input's sub-score; the figure is the points it added to the 100-point composite (weight × sub-score).
- Cash flow +15.8/30.0
- ARV discount +15.0/15.0
- DSCR +4.9/10.0
- 1% rule +3.4/10.0
- Schools +3.1/10.0
- Livability +2.8/5.0
- Rent growth +2.6/5.0
- Condition / age +2.5/5.0
- Appreciation +0.0/10.0
$250,000
🖨 Deal sheet (PDF) 📄 Offer letter ✓ Due diligence
Listing remarks
Welcome to this inviting 3-bed, 2-bath gem, featuring 1,904 square feet of potential and charm. While it's already gorgeous, there's plenty of opportunity to put your personal stamp on it. Enjoy the spacious layout, covered parking perfect for all your toys, and no HOA restrictions. Plus, it's just down the road from the stunning Saguaro National Park, offering endless outdoor adventures. And with a brand-new HVAC system installed in April, you'll be comfortable year-round. This private retreat is ready for your next chapter!
Key facts
- Covered parking
- No hoa restrictions
- 1 acre lot
Tags
Property features AI
Finance
- Other: Zoned Pima County - GR1
Exterior
- Parking: Covered parking for 2 vehicles; 2 carport spaces; Detached parking; Gated RV parking
- Utilities: Water from a water company; Sewer connected
- Home design: Manufactured home; Single-story
- Construction: Frame construction; Shingle roof
- Exterior features: Covered patio; Patio; Chain link and wood fencing; Cul-de-sac lot; North/South exposure; Gravel road access; County-maintained road
Interior
- Kitchen: Electric range; Microwave
- Flooring: Laminate flooring
- Bathrooms: 2 full bathrooms
- Heating & cooling: Forced air heating; Central air conditioning; Ceiling fans
- Interior features: Walk-in closet(s)
- Laundry & utility: Dedicated laundry room
Neighborhood map
What this means for you Summary
Snapshot
- This is a 3-bed/2.0-bath manufactured listed at $250k.
Deal economics
- At list price, monthly cash flow is $114 ($1k/yr) — positive.
- The deal already cash-flows at list — no discount required.
- To meet the 1% rule (rent ≥ 1% of price), the offer needs to be $211k (15.7% below list).
- Recommended offer: $211k (15.7% below list) — sets the bar for 1% rule.
- Cap rate 6.8% vs local median 5.6% in Picture Rocks — meaningfully above typical; check what's discounted (condition, days-on-market, listing class) to confirm the premium yield is real.
Location & tenants
- Location reads 55/100 on livability (#261 in AZ) — a working-class tenant base; expect higher turnover. Strengths: cost of living A+, housing A+; Watch: employment C-, crime D, amenities F.
- Marana Unified District (4404) (suburban): math 31% / reading 37% proficiency, ranked #83 of 249 in AZ (top 33%) — families likely to look elsewhere, expect single-tenant / working-renter base with shorter leases.
- Zoned schools: Picture Rocks Elementary (math 15% / reading 24%, grade F, #752 of 1,109 statewide, top 70%, 493 students, 67% FRL); Marana Middle School (math 24% / reading 30%, grade F, #97 of 218 statewide, top 45%, 907 students, 44% FRL); Marana High School (math 21% / reading 24%, grade F, #210 of 381 statewide, top 55%, 2,379 students, 36% FRL).
- Market conditions: Rents flat; 236 active listings in the ZIP; solid renter incomes; 5,268 units permitted in Pima County in 2024 (996 in 5+ unit buildings).
Forward outlook
- Local home prices are declining (-3.0%/yr); year-one equity from $2k of loan paydown is wiped out by about $8k of value loss. Plan a longer hold.
- Pima County population projected at +8% by 2050 — modest demand growth; plan on rents tracking national, not racing it.
Negotiation context
- Only 4 days on market — expect competitive offers; lowballing is unlikely to land.
- 5 sale attempts since 32y ago with the ask held roughly flat each time — persistent listings suggest the price (not the market) is what's stuck; bring a comps-based counter.
- Current owner paid $135k; list at $250k implies a 85% gain — meaningful room to come down on a strong offer.
Risks & watch-outs
- Climate carrying-cost: moderate wildfire risk; extreme-heat days projected 6→15/yr by 2055 (HVAC capex compounding) — expect insurance premiums to compound above CPI over the hold.
Questions for the listing agent
- Is there a deadline driving the sale (1031 exchange, divorce, estate, relocation)? That informs how much negotiation room exists.
- Schools are F-rated, which usually means shorter tenancies and higher turnover. Who's the typical renter profile here, and what's been the actual vacancy rate?
- Crime grade is D in this area — have there been break-ins, vandalism, or insurance claims at this property in the last 3 years? What carrier currently insures it and at what premium?
- What's the average days-on-market for RENTAL listings here right now (not sales)? A rising rental-DOM trend means longer vacancies and softer asking-rent achievability than the comps imply.
- What's the recent tenant-quality profile in this submarket — average credit score on applications, eviction rate, late-payment / NSF rate, and stable-employment percentage? A property-management company in the area should have these aggregated.
- How much new for-sale + rental construction is in the pipeline within 1–3 miles? Heavy new supply typically softens prices + rents 12–24 months out; constrained supply supports both.
Investment metrics
- 1% rule
- 0.84% ✗
- Cap rate
- 6.84%
- Cash-on-cash
- 1.95%
- DSCR
- 1.09
- GRM
- 9.9
CMA / ARV
- ARV (on-the-fly)
- $327,488
- Comps found
- 5
Show comp detail 5 sales within ~0.75 mi
| Address | Dist | Beds/Ba | Sqft | Sold | Price | $/sf | Match |
|---|---|---|---|---|---|---|---|
| 6362 N Van Ark Rd | 0.54mi | 4/2.0 (+1) | 1,980 (+4%) | 5mo | $340,000 | $172 | 59 |
| 9800 W Picture Rocks Rd | 0.26mi | 4/3.0 (+1) | 2,016 (+6%) | 16mo | $215,000 | $107 | 55 |
| 6633 N Desert View Dr | 0.06mi | 4/3.0 (+1) | 2,160 (+13%) | 13mo | $300,000 | $139 | 55 |
| 6370 N Van Ark Rd | 0.50mi | 4/2.0 (+1) | 1,758 (-8%) | 24mo | $340,000 | $193 | 39 |
| 10021 W Shidoni Ln | 0.73mi | 3/2.0 | 1,638 (-14%) | 13mo | $320,000 | $195 | 32 |
Match score weights: distance 35% · size 25% · config 20% · recency 20%. Top-matched comps best support the ARV.
Projected returns pro-forma
-3.0% appreciation · 0.47% rent growth · sell at horizon
- IRR
- -15.8%
- Equity multiple
- 0.45×
- Total profit
- $-38,586
- Equity at exit
- $37,276
- IRR
- -12.1%
- Equity multiple
- 0.36×
- Total profit
- $-45,010
- Equity at exit
- $21,615
Cash invested: $70,000 (down + closing). Projections, not guarantees.
Landlord ↔ Tenant lean methodology
- Overall (STATE)
- 87 Strongly Landlord-Friendly
- State Arizona
- 87 Strongly Landlord-Friendly · R+3
- County
- — inherits STATE
- City
- — inherits STATE
ZIP-level market 85743
- Home prices YoY
- -26.1%
- Rents YoY
- 0.5%
- Active inventory
- 236
- Price-to-rent
- 9.9×
Monthly cashflow live
- Estimated rent
- $2,108 medium interval (Pro) →
- Mortgage (P&I)
- −$1,311
- Tax from tax record
- −$136 /mo · $1,638/yr
- Insurance
- −$104
- HOA
- −$0
- Vacancy / Maint / Mgmt
- −$443
- Net cashflow
- $114
Break-even live
Sensitivity live
| Price | -10% $255 | -5% $184 | +0% $114 | +5% $43 | +10% $-28 |
|---|---|---|---|---|---|
| Rent | -10% $-53 | -5% $30 | +0% $114 | +5% $197 | +10% $280 |
| Rate | -1.0pp $239 | -0.5pp $177 | base $114 | +0.5pp $49 | +1.0pp $-17 |
UW: 25.0% down · 7.5% · 30yr · 1.5% tax · 5.0% vac · 8.0% maint · 8.0% mgmt
Financing live
Cash to close
- Down payment
- $62,500
- Closing costs
- $7,500
- Reserves months
- —
- Total cash needed
- —
Loan-product check · same deal, 3 products live
Conventional
25% down · 7.5% · 30yr
- Down + closing
- —
- Monthly P&I
- —
- Monthly cashflow
- —
- DSCR
- —
- Eligible?
- —
Personal DTI + credit; lowest rate.
DSCR
20% down · 8.5% · 30yr
- Down + closing
- —
- Monthly P&I
- —
- Monthly cashflow
- —
- DSCR
- —
- Eligible?
- —
No personal income docs; deal must DSCR.
Hard money
10% down · 12.0% · 12mo
- Down + closing
- —
- Monthly P&I
- —
- Monthly cashflow
- —
- DSCR
- —
- Eligible?
- —
Short-term bridge; refi at stabilization.
Listing history 19 events
-
2026-04-29status Pending
-
2026-04-25$250,000 Active
-
2026-03-23historical
-
2026-03-17historical Active Contingent
-
2026-03-06price $265,000
-
2025-11-14price $270,000
-
2025-08-16price $299,000
-
2025-07-12price $305,000
-
2025-05-29$320,000 Active
-
2008-07-07soldstatus $135,000
-
2008-07-07soldstatus $135,000
-
2008-04-01$135,000
-
2000-09-29soldstatus $67,000
-
2000-09-29soldstatus $67,000
-
2000-08-30$69,590
-
1994-07-27soldstatus $81,000
-
1994-07-26soldstatus $81,000
-
1994-02-11$85,000
-
1989-03-01soldstatus $55,568
ⓘ Source: listings_history table (triggers on properties + properties_extension) + one-shot
backfill from property_details.listing_events for pre-trigger history.
Tax reassessment forecast AZ · Resets to sale price
- Current annual tax
- $1,638 · $136/mo
- Projected year-2 tax
- $1,650 · $138/mo
- Expected delta
- +$12/yr (+$1/mo · 0.7%)
ⓘ Screening estimate from a state-policy table — verify with the county assessor before closing.
Climate risk First Street
- Flood 3/10 Moderate FEMA zone X (unshaded) · 20% chance over 30 yrs
- Wildfire 5/10 Major
- Heat 8/10 Severe 6 d/yr ≥107°F today · 15 d/yr by 30 yrs out
- Wind 1/10 Low
- Air quality 1/10 Low 0 unhealthy d/yr today · 0 by 30 yrs out
Nearby sold comps map
Loading sold comps map…
Walkable amenities ~0.75 mi
Loading nearby amenities…
Taxation est. · year 1
- Rental income
- $25,295
- − Mortgage interest
- −$14,004
- − Property taxes
- −$1,638
- − Insurance
- −$1,250
- − Repairs & maintenance
- −$2,024
- − Management
- −$2,024
- − Depreciation
- −$7,273
- Taxable loss
- −$2,916
- Est. tax savings @ 24.0%
- +$700
- After-tax cash flow
- $2,063/yr
For passive investors: Depreciation is non-cash, so a rental often shows a tax loss while cash-flowing — sheltering income. Rental losses are passive: they offset passive income freely, and up to $25,000/yr can offset ordinary (W-2) income if you actively participate and your MAGI is under $100k (phasing out to $0 by $150k); unused losses carry forward. On sale, claimed depreciation is recaptured at up to 25%, and gains may owe capital-gains tax (a 1031 exchange can defer both). Figures are a year-1 estimate at your 24.0% rate — not tax advice; consult a CPA.
Schools (NCES district)
- District
- Marana Unified District (4404)
- NCES district ID
- 0404630
- Math proficiency
- 31% ▼ -11.00%
- Reading proficiency
- 37% ▼ -5.00%
- Median HH income
- $65,282
- Composite
- 30.96/100
- National rank
- #6103
- State rank
- #83 of 249 in AZ
Livability — Picture Rocks
- Score
- 55/100
- State rank
- #261
- US rank
- #23370
Category grades
Schools grade is shown separately in the Schools card above.
Census & demographics
- Census place
- Picture Rocks, AZ
- County
- Pima County · 1,012,107 people
- Metro
- Tucson, AZ
- Population (ZIP)
- 31,300
- Household income
- $90,093
- Rent vs Own
- Severe rent burden
- 378.0
Population outlook (Pima County) Hauer SSP2
- Today (2025)
- 1,066,056 people
- By 2030
- 1,086,684 · +1.9%
- By 2040
- 1,117,160 · +4.8%
- By 2050
- 1,149,778 · +7.9%
- By 2075
- 1,271,480 · +19.3%
- By 2100
- 1,321,160 · +23.9%
Race, ethnicity, and origin ACS 2023
- Neighborhood character
- Majority White (63%)
- Race & ethnicity
- White 63% Hispanic / Latino 25% Two or more races 15% Asian 5% Black 2%
- Hispanic origin (detail)
- Mexican 21%
- Common ancestry
- Romanian 3% Lithuanian 2% Slovak 2%
- Foreign-born
- 9% · Canada, China, Vietnam
- Languages at home
- 85% English-only · Spanish 9% Chinese 1% Tagalog/Filipino 1%
Political lean MEDSL · Pima
- 2024 margin
- D (+15.2) · D 57.0% · R 41.8% · Other 1.2%
- 2008→2024 swing
- +9.1pp toward D · 2008: 6.1pp · 2024: 15.2pp
- All cycles
- 2024: D+15.2 2020: D+18.7 2016: D+13.5 2012: D+5.8 2008: D+6.1
Not yet ingested
- Civics
- —
Market trends
- HPI YoY
- ▼ -95.76%
- Current HPI
- 271.2845
- Rent YoY
- ▲ 0.47%
- Metro
- Tucson, AZ
- State GDP YoY
- ▲ 4.54%
- F500 in state
- 20
Industry mix (Fortune 500 HQ in AZ)
| Industry | F500 HQs | Revenue |
|---|---|---|
| Technology | 2 | $13B |
|
||
| Mining / Metals | 1 | $23B |
|
||
| Environmental Services | 1 | $16B |
|
||
| Metals / Steel | 1 | $14B |
|
||
| Technology Distribution | 1 | $9B |
|
||
| Homebuilding | 1 | $8B |
|
||
Price history
+349.9% since first listed19 events — show timeline
- 2026-04-29 Pending — MLSSAZ
- 2026-04-25 Listed $250,000 MLSSAZ
- 2026-03-23 Listing Removed — MLSSAZ
- 2026-03-17 Contingent — MLSSAZ
- 2026-03-06 Price Changed $265,000 MLSSAZ
- 2025-11-14 Price Changed $270,000 MLSSAZ
- 2025-08-16 Price Changed $299,000 MLSSAZ
- 2025-07-12 Price Changed $305,000 MLSSAZ
- 2025-05-29 Listed $320,000 MLSSAZ
- 2008-07-07 Sold (Public Records) $135,000 Public Records
- 2008-07-07 Sold (Public Records) $135,000 Public Records
- 2008-04-01 Listed $135,000 MLSSAZ
- 2000-09-29 Sold (Public Records) $67,000 Public Records
- 2000-09-29 Sold (MLS) $67,000 MLSSAZ
- 2000-08-30 Listed $69,590 MLSSAZ
- 1994-07-27 Sold (Public Records) $81,000 Public Records
- 1994-07-26 Sold (MLS) $81,000 MLSSAZ
- 1994-02-11 Listed $85,000 MLSSAZ
- 1989-03-01 Sold (Public Records) $55,568 Public Records
Property tax history
+1.2%/yrLatest (2025): $1,638 · -0.8% YoY. Source: county tax records.
Cash-flow waterfall
monthlySold comps — $/sqft
last 12 mo · ≤1 miLoading sold comps…