 🏗️ New Construction
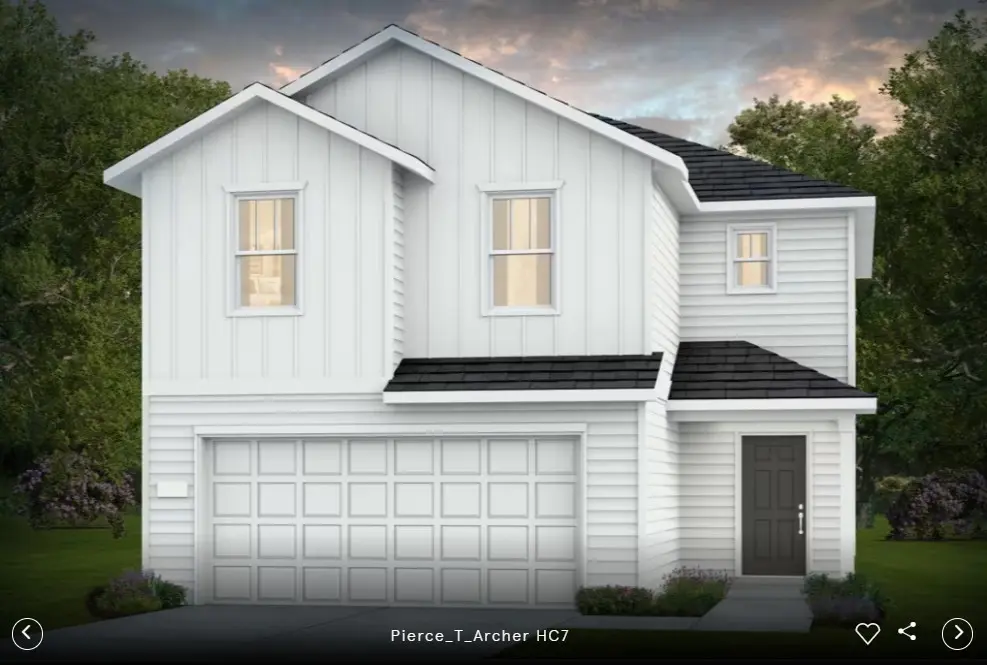
6818 Bens Lndg · Cove, TX
Flood risk 1/10 · Minimal
- FEMA flood zone
- X (unshaded)
- Chance of flooding over 30 yrs
- 0.0%
- Est. flood insurance / yr
- $507 – $1,088
Fire risk 4/10 · Minor
- Est. fire insurance / yr
- $1,222 – $2,270
Heat risk 9/10 · Severe
- Hot days now (above 111°F)
- 7 days/yr
- Hot days in 30 yrs
- 25 days/yr
Wind risk 9/10 · Severe
- Chance of severe wind over 30 yrs
- 99.0%
Air-quality risk 2/10 · Minimal
- Unhealthy air days now
- 1 days/yr
- Unhealthy air days in 30 yrs
- 1 days/yr
Risk factors via First Street. Map © Google.
Why this score? — see what drove the C- grade
The composite is a weighted blend of 9 inputs, each scored 0–100. Each bar is that input's sub-score; the figure is the points it added to the 100-point composite (weight × sub-score).
- Cash flow +16.7/30.0
- ARV discount +7.5/15.0
- Schools +6.2/10.0
- DSCR +5.2/10.0
- Condition / age +5.0/5.0
- 1% rule +4.9/10.0
- Rent growth +3.4/5.0
- Livability +3.2/5.0
- Appreciation +0.0/10.0
$269,800
🖨 Deal sheet 📄 Offer letter ✓ Due diligence
Listing remarks
This well-designed two story home blends open-concept living with private upstairs spaces, ideal for families. The first floor features a welcoming foyer, a spacious gathering room, and an open kitchen with a large island, ample counter space, and a café dining area with backyard access and an optional covered patio. A powder room sits off the foyer, and the 2 car garage provides direct entry. Upstairs, the owner’s suite offers a large bedroom, private bath, and walk-in closet. Three additional bedrooms provide space for kids, guests, or an office, along with a shared full bath and a central laundry room. With its efficient layout, modern amenities, and clear separation of shar
Key facts
- 7,500 sq ft lot
- 2 garage spots
- Community pool
Neighborhood map
What this means for you Summary
Snapshot
- This is a 4-bed/2.5-bath single-family listed at $270k. Condition is rated excellent.
Deal economics
- At list price, monthly cash flow is $171 ($2k/yr) — positive.
- The deal already cash-flows at list — no discount required.
- Meets the 1% rule at list price ($3k rent vs $270k).
- Recommended offer: $266k (1.5% below list) — sets the bar for market timing.
- Cap rate 7.0% vs local median 5.3% in Cove — top-decile yield for the area; either an underpriced asset or a hidden risk that comps aren't pricing in. Stress-test before assuming the spread holds.
Location & tenants
- Location reads 64/100 on livability (#766 in TX) — a middle-class / working-renter tenant base. Strengths: employment A+, housing A+, crime A; Watch: amenities F, commute F, health & safety F.
- Barbers Hill ISD (rural): math 72% / reading 65% proficiency, ranked #12 of 826 in TX (top 2%) — acceptable for families but not a draw, mixed tenant base, ~2y average lease.
- Zoned schools: Barbers Hill El South (math 68% / reading 62%, grade B+, #246 of 4,322 statewide, top 6%, 883 students, 37% FRL); Barbers Hill Middle South (math 77% / reading 63%, grade A, #58 of 1,662 statewide, top 4%, 636 students, 0% FRL); Barbers Hill H S (math 70% / reading 74%, grade B+, #95 of 1,632 statewide, top 7%, 1,972 students, 0% FRL) — zoned schools average 12% FRL vs 28% district-wide (16 pts lower); this property's tenant base skews higher-income than the district average.
- Market conditions: Rents rising (+3.4%/yr); 776 active listings in the ZIP; 4 comparable units currently listed for rent nearby; rentals at typical pace (median 24d on market — plan ~3-4 weeks tenant-placement turnaround); high-income renter base; 629 units permitted in Chambers County in 2024 (0 in 5+ unit buildings).
Forward outlook
- Local home prices are declining (-3.0%/yr); year-one equity from $2k of loan paydown is wiped out by about $8k of value loss. Plan a longer hold.
- Chambers County population projected at +46% by 2050 — long-run rental-demand tailwind backs the buy-and-hold thesis.
Negotiation context
- It's been on market 24 days — a 2% lower offer ($266k) is reasonable based on typical stale-listing flexibility.
- 2 sale attempts; this cycle's ask has dropped $18k (6%) from the opening price — seller is motivated, your offer sets the floor, not the list.
Risks & watch-outs
- Climate carrying-cost: severe wind risk, 99% chance of damaging wind over 30y; extreme-heat days projected 7→25/yr by 2055 (HVAC capex compounding) — expect insurance premiums to compound above CPI over the hold.
Questions for the listing agent
- What does the HOA fee cover, when was the last increase, and are there any pending special assessments or reserve-fund shortfalls?
- Is there a deadline driving the sale (1031 exchange, divorce, estate, relocation)? That informs how much negotiation room exists.
- Schools are D-rated, which usually means shorter tenancies and higher turnover. Who's the typical renter profile here, and what's been the actual vacancy rate?
- What's the average days-on-market for RENTAL listings here right now (not sales)? A rising rental-DOM trend means longer vacancies and softer asking-rent achievability than the comps imply.
- What's the recent tenant-quality profile in this submarket — average credit score on applications, eviction rate, late-payment / NSF rate, and stable-employment percentage? A property-management company in the area should have these aggregated.
- How much new for-sale + rental construction is in the pipeline within 1–3 miles? Heavy new supply typically softens prices + rents 12–24 months out; constrained supply supports both.
Investment metrics
- 1% rule
- 0.99% ✗
- Cap rate
- 7.03%
- Cash-on-cash
- 2.65%
- DSCR
- 1.12
- GRM
- 8.4
CMA / ARV
- ARV (on-the-fly)
- $277,498
- Comps found
- 12
Show comp detail 12 sales within ~0.75 mi
| Address | Dist | Beds/Ba | Sqft | Sold | Price | $/sf | Match |
|---|---|---|---|---|---|---|---|
| 6818 Bens Lndg | 0.00mi | 4/2.5 | 1,642 (0%) | 1mo | $269,800 | $164 | 99 |
| 6922 Bens Lndg | 0.10mi | 4/2.5 | 1,642 (0%) | 1mo | $269,180 | $164 | 95 |
| 6830 Bens Lndg | 0.03mi | 3/2.0 (-1) | 1,580 (-4%) | 1mo | $274,870 | $174 | 84 |
| 6743 Camila St | 0.27mi | 4/2.0 | 1,682 (+2%) | 2mo | $284,000 | $169 | 79 |
| 6707 Alejandro Pl | 0.18mi | 3/2.0 (-1) | 1,592 (-3%) | 1mo | $299,100 | $188 | 79 |
| 7106 Thomas James Ct | 0.14mi | 4/2.0 | 1,777 (+8%) | 1mo | $297,690 | $168 | 77 |
| 6714 Augusta Greens Dr | 0.14mi | 3/2.0 (-1) | 1,790 (+9%) | 2mo | $324,990 | $182 | 70 |
| 635 Hidden Brook Dr | 0.23mi | 3/2.0 (-1) | 1,516 (-8%) | 1mo | $282,000 | $186 | 68 |
| 14923 Spring Forest Ln | 0.35mi | 4/2.0 | 1,829 (+11%) | 2mo | $299,000 | $163 | 61 |
| 411 Ruby Ford Dr | 0.24mi | 3/2.0 (-1) | 1,408 (-14%) | 1mo | $254,970 | $181 | 57 |
| 218 San Marcos Dr | 0.68mi | 3/2.0 (-1) | 1,728 (+5%) | 1mo | $290,000 | $168 | 52 |
| 14603 Rain Tree Dr | 0.47mi | 3/2.0 (-1) | 1,821 (+11%) | 2mo | $308,000 | $169 | 51 |
Match score weights: distance 35% · size 25% · config 20% · recency 20%. Top-matched comps best support the ARV.
Projected returns pro-forma
-3.0% appreciation · 3.42% rent growth · sell at horizon
- IRR
- -11.6%
- Equity multiple
- 0.58×
- Total profit
- $-32,804
- Equity at exit
- $41,376
- IRR
- -1.7%
- Equity multiple
- 0.88×
- Total profit
- $-9,348
- Equity at exit
- $23,993
Cash invested: $77,699 (down + closing). Projections, not guarantees.
Landlord ↔ Tenant lean methodology
- Overall (STATE)
- 87 Strongly Landlord-Friendly
- State Texas
- 87 Strongly Landlord-Friendly · R+5
- County
- — inherits STATE
- City
- — inherits STATE
ZIP-level market 77523
- Home prices YoY
- -31.5%
- Rents YoY
- 3.4%
- Active inventory
- 776
- Price-to-rent
- 8.2×
Monthly cashflow live
- Estimated rent
- $2,739 medium interval (Pro) →
- Mortgage (P&I)
- −$1,455
- Tax est. 1.5%
- −$347 /mo · $4,162/yr
- Insurance
- −$116
- HOA
- −$75
- Vacancy / Maint / Mgmt
- −$575
- Net cashflow
- $171
Break-even live
UW: 25.0% down · 7.5% · 30yr · 1.5% tax · 5.0% vac · 8.0% maint · 8.0% mgmt
Financing live
Cash to close
- Down payment
- $69,374
- Closing costs
- $8,325
- Reserves months
- —
- Total cash needed
- —
Loan-product check · same deal, 3 products live
Conventional
25% down · 7.5% · 30yr
- Down + closing
- —
- Monthly P&I
- —
- Monthly cashflow
- —
- DSCR
- —
- Eligible?
- —
Personal DTI + credit; lowest rate.
DSCR
20% down · 8.5% · 30yr
- Down + closing
- —
- Monthly P&I
- —
- Monthly cashflow
- —
- DSCR
- —
- Eligible?
- —
No personal income docs; deal must DSCR.
Hard money
10% down · 12.0% · 12mo
- Down + closing
- —
- Monthly P&I
- —
- Monthly cashflow
- —
- DSCR
- —
- Eligible?
- —
Short-term bridge; refi at stabilization.
Rent comps 4 comps
| Address | Beds | Baths | Sqft | Rent | $/sqft | DOM | Units | Dist |
|---|---|---|---|---|---|---|---|---|
| 14930 Spring Forest Ln Baytown, TX | 4.0 | 2.0 | 1829 | $2,750 | $1.50 | 43d | 1 | 0.30mi |
| 14739 Sweet Water Dr Baytown, TX | 4.0 | 2.0 | 1821 | $2,395 | $1.32 | 1d | 1 | 0.45mi |
| 5815 Littoral Rd Baytown, TX | 3.0 | 2.0 | 1305 | $1,845 | $1.41 | 19d | 1 | 1.12mi |
| 8414 Liberty Sky Rd Baytown, TX | 3.0 | 2.5 | 2046 | $2,095 | $1.02 | 24d | 1 | 1.30mi |
HOA detail
- Monthly dues
- $75 · $900/yr
Listing history 6 events
-
2026-04-27status Pending
-
2026-04-11price $269,800
-
2026-04-08status Active
-
2026-04-08price $273,800
-
2026-03-30status Pending
-
2026-03-25$288,000 Active
ⓘ Source: listings_history table (triggers on properties + properties_extension) + one-shot
backfill from property_details.listing_events for pre-trigger history.
Climate risk First Street
- Flood 1/10 Low FEMA zone X (unshaded) · 0% chance over 30 yrs
- Wildfire 4/10 Moderate
- Heat 9/10 Extreme 7 d/yr ≥111°F today · 25 d/yr by 30 yrs out
- Wind 9/10 Extreme 99% chance of damaging wind over 30 yrs
- Air quality 2/10 Low 1 unhealthy d/yr today · 1 by 30 yrs out
Nearby sold comps map
Loading sold comps map…
Walkable amenities ~0.75 mi
Loading nearby amenities…
Taxation est. · year 1
- Rental income
- $32,872
- − Mortgage interest
- −$15,544
- − Property taxes
- −$4,162
- − Insurance
- −$1,387
- − Repairs & maintenance
- −$2,630
- − Management
- −$2,630
- − HOA
- −$900
- − Depreciation
- −$8,073
- Taxable loss
- −$2,454
- Est. tax savings @ 24.0%
- +$589
- After-tax cash flow
- $2,645/yr
For passive investors: Depreciation is non-cash, so a rental often shows a tax loss while cash-flowing — sheltering income. Rental losses are passive: they offset passive income freely, and up to $25,000/yr can offset ordinary (W-2) income if you actively participate and your MAGI is under $100k (phasing out to $0 by $150k); unused losses carry forward. On sale, claimed depreciation is recaptured at up to 25%, and gains may owe capital-gains tax (a 1031 exchange can defer both). Figures are a year-1 estimate at your 24.0% rate — not tax advice; consult a CPA.
Condition & rehab AI · 7 photos
This well-maintained two-story home is move-in ready with a spacious layout, modern amenities, and a desirable location with a pool and tennis courts. The home's excellent condition and curb appeal make it an attractive investment.
Value-add opportunities
- Both Landscaping and pool maintenance — Maintaining the pool and landscaping will enhance curb appeal and attract potential buyers or renters.
- Both Painting interior walls — Fresh paint can make the interior look more inviting and modern.
- Both Landscaping improvements — Enhancing the landscaping can increase the home's curb appeal and attract more potential buyers or renters.
Renovation cost estimate screening
Value-add ROI direction
- Both Landscaping and pool maintenance — Maintaining the pool and landscaping will enhance curb appeal and attract potential buyers or renters. ↑
- Both Painting interior walls — Fresh paint can make the interior look more inviting and modern. ↑
- Both Landscaping improvements — Enhancing the landscaping can increase the home's curb appeal and attract more potential buyers or renters. ↑
ⓘ Cost ranges are severity-bucket heuristics (US national rule-of-thumb). Get contractor quotes + a written scope before underwriting a rehab budget.
Schools (NCES district)
- District
- Barbers Hill ISD
- NCES district ID
- 4809450
- Math proficiency
- 72% ▼ -5.00%
- Reading proficiency
- 65% ▼ -1.00%
- Median HH income
- $87,257
- Composite
- 61.73/100
- National rank
- #737
- State rank
- #12 of 826 in TX
Livability — Cove
- Score
- 64/100
- State rank
- #766
- US rank
- #13996
Category grades
Schools grade is shown separately in the Schools card above.
Census & demographics
- County
- Chambers County · 30,186 people
- Metro
- Houston-The Woodlands-Sugar Land, TX
- Population (ZIP)
- 30,186
- Household income
- $124,188
- Rent vs Own
- Severe rent burden
- 549.0
Population outlook (Chambers County) Hauer SSP2
- Today (2025)
- 46,946 people
- By 2030
- 51,094 · +8.8%
- By 2040
- 59,578 · +26.9%
- By 2050
- 68,318 · +45.5%
- By 2075
- 90,485 · +92.7%
- By 2100
- 104,885 · +123.4%
Race, ethnicity, and origin ACS 2023
- Neighborhood character
- Majority White (62%)
- Race & ethnicity
- White 62% Hispanic / Latino 25% Two or more races 11% Black 8% Asian 2%
- Hispanic origin (detail)
- Mexican 22%
- Common ancestry
- Lithuanian 1% Slovak 1% Serbian 1%
- Foreign-born
- 9% · Canada
- Languages at home
- 82% English-only · Spanish 17%
Political lean MEDSL · Chambers
- 2024 margin
- Solid R (+65.6) · D 16.8% · R 82.4%
- 2008→2024 swing
- -14.4pp toward R · 2008: -51.2pp · 2024: -65.6pp
- All cycles
- 2024: R+65.6 2020: R+61.7 2016: R+62.1 2012: R+61.1 2008: R+51.2
Not yet ingested
- Civics
- —
Market trends
- HPI YoY
- ▼ -102.33%
- Current HPI
- 222.6999
- Rent YoY
- ▲ 3.42%
- Metro
- Houston-The Woodlands-Sugar Land, TX
- State GDP YoY
- ▲ 3.95%
- F500 in state
- 110
Industry mix (Fortune 500 HQ in TX)
| Industry | F500 HQs | Revenue |
|---|---|---|
| Energy | 16 | $1,198B |
|
||
| Technology | 5 | $198B |
|
||
| Engineering / Construction | 4 | $72B |
|
||
| Energy Services | 3 | $60B |
|
||
| Utilities | 3 | $41B |
|
||
| Healthcare | 2 | $330B |
|
||
Price history
-6.3% since first listed6 events — show timeline
- 2026-04-27 Pending — HARMLS
- 2026-04-11 Price Changed $269,800 HARMLS
- 2026-04-08 Relisted — HARMLS
- 2026-04-08 Price Changed $273,800 HARMLS
- 2026-03-30 Pending — HARMLS
- 2026-03-25 Listed $288,000 HARMLS
Cash-flow waterfall
monthlySold comps — $/sqft
last 12 mo · ≤1 miLoading sold comps…