450 Abbeyville Rd · Bethel Park, PA
Flood risk 1/10 · Minimal
- FEMA flood zone
- X (unshaded)
- Chance of flooding over 30 yrs
- 0.0%
- Est. flood insurance / yr
- $507 – $1,088
Fire risk 1/10 · Minimal
- Est. fire insurance / yr
- $511 – $949
Heat risk 3/10 · Minor
- Hot days now (above 96°F)
- 7 days/yr
- Hot days in 30 yrs
- 17 days/yr
Wind risk 2/10 · Minimal
- Chance of severe wind over 30 yrs
- —
Air-quality risk 3/10 · Minor
- Unhealthy air days now
- 3 days/yr
- Unhealthy air days in 30 yrs
- 5 days/yr
Risk factors via First Street. Map © Google.
Why this score? — see what drove the D grade
The composite is a weighted blend of 9 inputs, each scored 0–100. Each bar is that input's sub-score; the figure is the points it added to the 100-point composite (weight × sub-score).
- Cash flow +11.8/30.0
- ARV discount +7.5/15.0
- 1% rule +6.1/10.0
- Schools +5.6/10.0
- Livability +4.2/5.0
- DSCR +3.5/10.0
- Rent growth +3.3/5.0
- Condition / age +1.0/5.0
- Appreciation +0.0/10.0
$109,000
🖨 Deal sheet 📄 Offer letter ✓ Due diligence
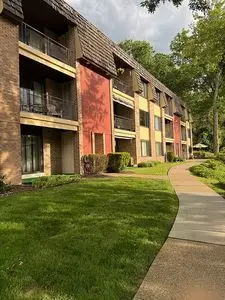
Listing remarks MLS
Nice view from top Flr end unit w/ Priv Balcony. Light & Bright w/ Neut Decor. New Kit(05), Updated Baths. Owner Pays Elect only. Extra storage off Balcony & Bsmt. Walking Distance to Restaurants & Malls. No Pets Allowed per Ass. www. visualtour.com/showvt. asp?T=1363056
Key facts
- Corner condo
- First floor
- Built 1969
Tags
Neighborhood map
What this means for you Summary
Snapshot
- This is a 1-bed/1.0-bath condo listed at $109k. Condition is rated poor.
Deal economics
- At list price, monthly cash flow is $-30 ($-364/yr) — negative.
- The deal already cash-flows at list — no discount required.
- Meets the 1% rule at list price ($1k rent vs $109k).
- Recommended offer: $107k (1.5% below list) — sets the bar for market timing.
- Cap rate 6.0% vs local median 3.1% in Bethel Park — top-decile yield for the area; either an underpriced asset or a hidden risk that comps aren't pricing in. Stress-test before assuming the spread holds.
Location & tenants
- Location reads 85/100 on livability (#70 in PA, #483 nationally) — a professional / high-income tenant draw. Strengths: schools A+, crime A+, employment A+; Watch: amenities C-, commute F.
- Bethel Park SD (suburban): math 52% / reading 76% proficiency, ranked #50 of 539 in PA (top 9%) — acceptable for families but not a draw, mixed tenant base, ~2y average lease; only 11% free/reduced lunch — higher-income household profile.
- Market conditions: Rents rising (+3.2%/yr); 3 active listings in the ZIP; 10 comparable units currently listed for rent nearby; rentals at typical pace (median 24d on market — plan ~3-4 weeks tenant-placement turnaround); 40% of comp listings sitting > 30 days — soft ceiling on asking rent; high-income renter base; 2,996 units permitted in Allegheny County in 2024 (1,588 in 5+ unit buildings).
- This rent is only 12% of the median local income ($124k/yr) — well below the 30% rent-burden line; pricing power to push rent on renewal without tenant pushback.
Forward outlook
- Local home prices are declining (-3.0%/yr); year-one equity from $754 of loan paydown is wiped out by about $3k of value loss. Plan a longer hold.
Negotiation context
- It's been on market 16 days — a 2% lower offer ($107k) is reasonable based on typical stale-listing flexibility.
- 3 sale attempts since 18y ago with the ask held roughly flat each time — persistent listings suggest the price (not the market) is what's stuck; bring a comps-based counter.
- Current owner paid $64k; list at $109k implies a 70% gain — meaningful room to come down on a strong offer.
Questions for the listing agent
- What do current leases actually rent for vs. the listed asking? Can we see a recent rent roll and the last 12 months of T-12 income?
- Have any recent inspections been done? Can we get a copy of the seller's disclosures and any deferred-maintenance estimates?
- Built in 1969 — when were the roof, HVAC, electrical panel, plumbing, and water heater last replaced?
- What does the HOA fee cover, when was the last increase, and are there any pending special assessments or reserve-fund shortfalls?
- Any open or pending special assessments — roof, HVAC, plumbing, elevator, façade? What's the per-unit balance and payoff schedule, and is the seller paying it off at close or rolling it to the buyer?
- Is there a deadline driving the sale (1031 exchange, divorce, estate, relocation)? That informs how much negotiation room exists.
- Schools are A-rated — typically a magnet for longer-tenancy family renters. What's the average tenant stay here, and is there a school-zone premium baked into asking?
- The area grade is low — what's the realistic commute time and amenity access for the typical tenant pool here? Any planned neighborhood developments (good or bad) we should know about?
- What's the average days-on-market for RENTAL listings here right now (not sales)? A rising rental-DOM trend means longer vacancies and softer asking-rent achievability than the comps imply.
- What's the recent tenant-quality profile in this submarket — average credit score on applications, eviction rate, late-payment / NSF rate, and stable-employment percentage? A property-management company in the area should have these aggregated.
- How much new apartment / multifamily construction is in the pipeline within 1–3 miles? Heavy new supply (>2% of stock underway) typically softens rents 12–24 months out; light construction supports rent growth.
Investment metrics
- 1% rule
- 1.11% ✓
- Cap rate
- 5.96%
- Cash-on-cash
- -1.19%
- DSCR
- 0.95
- GRM
- 7.5
CMA / ARV
No comps found within radius.
Projected returns pro-forma
-3.0% appreciation · 3.16% rent growth · sell at horizon
- IRR
- -17.8%
- Equity multiple
- 0.37×
- Total profit
- $-19,240
- Equity at exit
- $16,252
- IRR
- -9.3%
- Equity multiple
- 0.42×
- Total profit
- $-17,789
- Equity at exit
- $9,424
Cash invested: $30,520 (down + closing). Projections, not guarantees.
Landlord ↔ Tenant lean methodology
- Overall (STATE)
- 62 Landlord-Friendly
- State Pennsylvania
- 62 Landlord-Friendly · EVEN
- County
- — inherits STATE
- City
- — inherits STATE
ZIP-level market 15228
- Rents YoY
- 3.2%
- Active inventory
- 3
- Price-to-rent
- 7.5×
Monthly cashflow live
- Estimated rent
- $1,208 high interval (Pro) →
- Mortgage (P&I)
- −$572
- Tax est. 1.5%
- −$136 /mo · $1,635/yr
- Insurance
- −$45
- HOA est. from 2 same-building comps
- −$231
- Vacancy / Maint / Mgmt
- −$254
- Net cashflow
- $-30
Break-even live
UW: 25.0% down · 7.5% · 30yr · 1.5% tax · 5.0% vac · 8.0% maint · 8.0% mgmt
Financing live
Cash to close
- Down payment
- $27,250
- Closing costs
- $3,270
- Reserves months
- —
- Total cash needed
- —
Loan-product check · same deal, 3 products live
Conventional
25% down · 7.5% · 30yr
- Down + closing
- —
- Monthly P&I
- —
- Monthly cashflow
- —
- DSCR
- —
- Eligible?
- —
Personal DTI + credit; lowest rate.
DSCR
20% down · 8.5% · 30yr
- Down + closing
- —
- Monthly P&I
- —
- Monthly cashflow
- —
- DSCR
- —
- Eligible?
- —
No personal income docs; deal must DSCR.
Hard money
10% down · 12.0% · 12mo
- Down + closing
- —
- Monthly P&I
- —
- Monthly cashflow
- —
- DSCR
- —
- Eligible?
- —
Short-term bridge; refi at stabilization.
Rent comps 10 comps
| Address | Beds | Baths | Sqft | Rent | $/sqft | DOM | Units | Dist |
|---|---|---|---|---|---|---|---|---|
| 435 Abbeyville Rd Pittsburgh, PA | 1.0–2.0 | 1.0–1.5 | 880 | $1,215 | $1.38 | 2d | 10 | 0.05mi |
| 35 Highland Rd Bethel Park, PA | 1.0–2.0 | 1.0–2.0 | 831 | $1,419 | $1.71 | 1d | 24 | 0.22mi |
| 7 Dorchester Dr Unit 7-611 Pittsburgh, PA | 1.0 | 1.0 | 660 | $1,277 | $1.93 | 43d | 1 | 0.75mi |
| 3 Dorchester Dr Unit 301 Bethel Park, PA | 1.0 | 1.0 | 660 | $1,149 | $1.74 | 21d | 1 | 0.75mi |
| 5 Dorchester Dr Pittsburgh, PA | 1.0–2.0 | 1.0–1.5 | 837 | $1,113 | $1.33 | 1d | 46 | 0.78mi |
| 1000 Vermont Ave Pittsburgh, PA | 2.0 | 1.0 | 791 | $975 | $1.23 | 43d | 1 | 0.84mi |
| 405 Hoodridge Dr Pittsburgh, PA | 2.0 | 2.0 | 1100 | $1,150 | $1.05 | 43d | 1 | 1.24mi |
| 446 Hoodridge Dr #2 Pittsburgh, PA | — | 1.0 | 528 | $1,000 | $1.89 | 23d | 1 | 1.28mi |
| 957 Bockstoce Ave Pittsburgh, PA | 2.0 | 1.0 | 900 | $1,050 | $1.17 | 43d | 1 | 1.40mi |
| 799-B Cooke Dr Pittsburgh, PA | 2.0 | 1.0 | 988 | $1,495 | $1.51 | 17d | 1 | 1.42mi |
HOA detail condo
- Monthly dues
- $0 · $0/yr
- Assessments
- None detected in remarks — confirm with the listing agent.
Listing history 11 events
-
2026-06-18days on market $109,000 Active 16 DOM
-
2026-06-17days on market $109,000 Active 15 DOM
-
2026-06-16days on market $109,000 Active 14 DOM
-
2026-06-15days on market $109,000 Active 13 DOM
-
2026-06-13days on market $109,000 Active 11 DOM
-
2026-06-09days on market $109,000 Active 7 DOM
-
2026-06-08days on market $109,000 Active 6 DOM
-
2026-06-07days on market $109,000 Active 5 DOM
-
2026-06-05days on market $109,000 Active 2 DOM
-
2026-06-02remarks 699-char remark
-
2026-06-02$109,000 Active 1 DOM
ⓘ Source: listings_history table (triggers on properties + properties_extension) + one-shot
backfill from property_details.listing_events for pre-trigger history.
Climate risk First Street
- Flood 1/10 Low FEMA zone X (unshaded) · 0% chance over 30 yrs
- Wildfire 1/10 Low
- Heat 3/10 Moderate 7 d/yr ≥96°F today · 17 d/yr by 30 yrs out
- Wind 2/10 Low
- Air quality 3/10 Moderate 3 unhealthy d/yr today · 5 by 30 yrs out
Nearby sold comps map
Loading sold comps map…
Walkable amenities ~0.75 mi
Loading nearby amenities…
Taxation est. · year 1
- Rental income
- $14,490
- − Mortgage interest
- −$6,106
- − Property taxes
- −$1,635
- − Insurance
- −$545
- − Repairs & maintenance
- −$1,159
- − Management
- −$1,159
- − HOA
- −$2,772
- − Depreciation
- −$3,171
- Taxable loss
- −$2,057
- Est. tax savings @ 24.0%
- +$494
- After-tax cash flow
- $130/yr
For passive investors: Depreciation is non-cash, so a rental often shows a tax loss while cash-flowing — sheltering income. Rental losses are passive: they offset passive income freely, and up to $25,000/yr can offset ordinary (W-2) income if you actively participate and your MAGI is under $100k (phasing out to $0 by $150k); unused losses carry forward. On sale, claimed depreciation is recaptured at up to 25%, and gains may owe capital-gains tax (a 1031 exchange can defer both). Figures are a year-1 estimate at your 24.0% rate — not tax advice; consult a CPA.
Condition & rehab AI · 1 photo
This property requires extensive repairs and updates to its exterior, interior, and systems, significantly impacting its value. Immediate action is needed to address the deteriorating condition and improve its marketability.
Repairs flagged
- Major exterior siding — Severe weathering and peeling paint
- Major roof — No visible damage, but not enough information to assess
- Major interior walls/paint — No visible interior, but not enough information to assess
- Major bathrooms — No visible bathrooms, but not enough information to assess
- Major kitchen — No visible kitchen, but not enough information to assess
- Major HVAC/mechanicals — No visible HVAC/mechanicals, but not enough information to assess
- Major windows — No visible windows, but not enough information to assess
- Major foundation/structure — No visible foundation/structure, but not enough information to assess
- Major landscaping/curb appeal — No visible landscaping/curb appeal, but not enough information to assess
Value-add opportunities
- Both exterior siding and paint — Improves curb appeal and property value
- Both roof replacement — Essential for structural integrity and property value
- Both interior painting and repairs — Enhances living space and property value
- Both bathroom and kitchen updates — Modernizes spaces and increases property value
- Both HVAC and mechanical upgrades — Improves comfort and energy efficiency
- Both window replacements — Enhances energy efficiency and property value
- Both foundation and structural repairs — Ensures structural integrity and property value
- Both landscaping and curb appeal improvements — Enhances property value and curb appeal
Renovation cost estimate screening
| Repair item | Severity | Est. cost |
|---|---|---|
| exterior siding · Severe weathering and peeling paint | Major | $15,000–50,000 |
| roof · No visible damage, but not enough information to assess | Major | $15,000–50,000 |
| interior walls/paint · No visible interior, but not enough information to assess | Major | $15,000–50,000 |
| bathrooms · No visible bathrooms, but not enough information to assess | Major | $15,000–50,000 |
| kitchen · No visible kitchen, but not enough information to assess | Major | $15,000–50,000 |
| HVAC/mechanicals · No visible HVAC/mechanicals, but not enough information to assess | Major | $15,000–50,000 |
| windows · No visible windows, but not enough information to assess | Major | $15,000–50,000 |
| foundation/structure · No visible foundation/structure, but not enough information to assess | Major | $15,000–50,000 |
| landscaping/curb appeal · No visible landscaping/curb appeal, but not enough information to assess | Major | $15,000–50,000 |
| Total estimated repair cost · 9 items | $135,000–450,000 |
Value-add ROI direction
- Both exterior siding and paint — Improves curb appeal and property value ↑
- Both roof replacement — Essential for structural integrity and property value ↑
- Both interior painting and repairs — Enhances living space and property value ↑
- Both bathroom and kitchen updates — Modernizes spaces and increases property value ↑
- Both HVAC and mechanical upgrades — Improves comfort and energy efficiency ↑
- Both window replacements — Enhances energy efficiency and property value ↑
- Both foundation and structural repairs — Ensures structural integrity and property value ↑
- Both landscaping and curb appeal improvements — Enhances property value and curb appeal ↑
ⓘ Cost ranges are severity-bucket heuristics (US national rule-of-thumb). Get contractor quotes + a written scope before underwriting a rehab budget.
Schools (NCES district)
- District
- Bethel Park SD
- NCES district ID
- 4203510
- Math proficiency
- 52% ▼ -16.00%
- Reading proficiency
- 76% ▼ -8.00%
- Median HH income
- $67,758
- Composite
- 56.0/100
- National rank
- #1194
- State rank
- #50 of 539 in PA
Livability — Bethel Park
- Score
- 85/100
- State rank
- #70
- US rank
- #483
Category grades
Schools grade is shown separately in the Schools card above.
Census & demographics
- Census place
- Bethel Park, PA
- County
- Allegheny County · 1,022,028 people
- City population
- 30,344
- Metro
- Pittsburgh, PA
- Population (ZIP)
- 18,236
- Household income
- $123,681
- Rent vs Own
- Severe rent burden
- 453.0
Population outlook (Allegheny County) Hauer SSP2
- Today (2025)
- 1,250,282 people
- By 2030
- 1,256,482 · +0.5%
- By 2040
- 1,256,318 · +0.5%
- By 2050
- 1,244,169 · -0.5%
- By 2075
- 1,197,693 · -4.2%
- By 2100
- 1,093,187 · -12.6%
Race, ethnicity, and origin ACS 2023
- Neighborhood character
- Predominantly White (89%)
- Race & ethnicity
- White 89% Two or more races 6% Hispanic / Latino 3% Asian 2% Black 1%
- Common ancestry
- Romanian 5% Serbian 3% Slovak 2%
- Foreign-born
- 7% · Canada, China
- Languages at home
- 91% English-only · Other Indo-European 3% Russian/Polish/Slavic 2% Other Asian/Pacific 2%
Political lean MEDSL · Allegheny
- 2024 margin
- Strong D (+20.3) · D 59.7% · R 39.4%
- 2008→2024 swing
- +4.8pp toward D · 2008: 15.5pp · 2024: 20.3pp
- All cycles
- 2024: D+20.3 2020: D+20.4 2016: D+16.4 2012: D+14.4 2008: D+15.5
Not yet ingested
- Civics
- —
Market trends
- HPI YoY
- ▼ -235.23%
- Current HPI
- 265.5711
- Rent YoY
- ▲ 3.16%
- Metro
- Pittsburgh, PA
- State GDP YoY
- ▲ 1.68%
- F500 in state
- 34
Industry mix (Fortune 500 HQ in PA)
| Industry | F500 HQs | Revenue |
|---|---|---|
| Healthcare | 2 | $309B |
|
||
| Insurance | 2 | $27B |
|
||
| Telecommunications / Media | 1 | $124B |
|
||
| Industrial Distribution | 1 | $22B |
|
||
| Financial Services | 1 | $20B |
|
||
| Chemicals / Materials | 1 | $18B |
|
||
Price history
+55.7% since first listed5 events — show timeline
- 2026-06-03 Listed $109,000 FSBO.com
- 2008-12-03 Sold (MLS) $64,000 West Penn MLS
- 2008-06-26 Sold (MLS) $77,500 West Penn MLS
- 2008-05-19 Listed $84,000 West Penn MLS
- 2008-01-11 Listed $70,000 West Penn MLS
Cash-flow waterfall
monthlySold comps — $/sqft
last 12 mo · ≤1 miLoading sold comps…