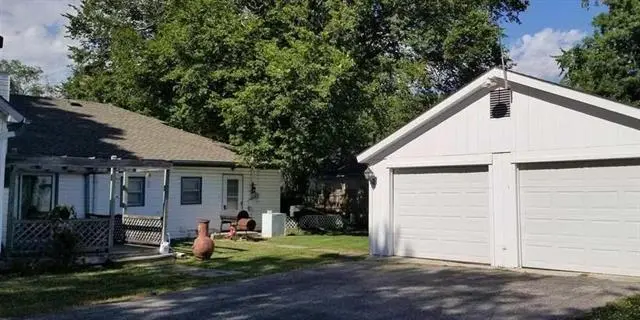
617 N Houston St · Adrian, MO
Flood risk 1/10 · Minimal
- FEMA flood zone
- X (unshaded)
- Chance of flooding over 30 yrs
- 0.0%
- Est. flood insurance / yr
- $473 – $860
Fire risk 1/10 · Minimal
- Est. fire insurance / yr
- $1,054 – $1,958
Heat risk 4/10 · Minor
- Hot days now (above 108°F)
- 7 days/yr
- Hot days in 30 yrs
- 17 days/yr
Wind risk 2/10 · Minimal
- Chance of severe wind over 30 yrs
- —
Air-quality risk 2/10 · Minimal
- Unhealthy air days now
- 1 days/yr
- Unhealthy air days in 30 yrs
- 1 days/yr
Risk factors via First Street. Map © Google.
Why this score? — see what drove the B+ grade
The composite is a weighted blend of 9 inputs, each scored 0–100. Each bar is that input's sub-score; the figure is the points it added to the 100-point composite (weight × sub-score).
- Cash flow +30.0/30.0
- 1% rule +10.0/10.0
- DSCR +10.0/10.0
- Appreciation +10.0/10.0
- ARV discount +7.5/15.0
- Livability +3.6/5.0
- Schools +3.3/10.0
- Rent growth +2.5/5.0
- Condition / age +2.5/5.0
$80,000
🖨 Deal sheet 📄 Offer letter ✓ Due diligence
Listing remarks MLS
Beautiful older home Needs TLC, w/ great character that needs your loving touch-Large family room w/ stone fireplace, custom built-in window seat & that is just the beginning! Kitchen has antique tile ceiling w/ painted cabinets-Built in over sized desk, lots of storage-Beautiful hard wood floors-Floor to ceiling cabinets in the mudroom/laundry area-Kitchen appliances stay 2 extra large garage/sheds that are perfect for all sorts hobbies & storage. 3ys Gutters!! 3 yr old Roof Dryer is GAS! All bedrooms have hardwood flooring underneath the carpet. Perennials are abundant. Covered front porch is just waiting for the porch swing
Key facts
- Oversized corner lot
- Storm shelter
- Original framing
Tags
Property features AI
Finance
- Financial info: Annual property tax amount available (not included per instructions)
Exterior
- Parking: Detached garage with garage door opener (2-car)
- Utilities: Public water; Public sewer
- Home design: Single-family residence; Ranch floor plan; Facing: (not specified)
- Construction: Lap siding and vinyl siding; Composition roof; Built approximately 76-100 years ago
- Exterior features: Front porch; Partial metal fencing; Corner lot in city limits; Level lot; Outbuilding
Interior
- Kitchen: Kitchen on the first level
- Bedrooms: 3 bedrooms (all on the first level)
- Flooring: Wood flooring
- Bathrooms: 1 full bathroom
- Heating & cooling: Heating: Other; Cooling: Other
- Interior features: Storm door(s); Cellar; Crawl space; Sump pump; Wood flooring; Wood-burning fireplace
- Laundry & utility: Main-level laundry
Neighborhood map
What this means for you Summary
Snapshot
- This is a 3-bed/1.0-bath other listed at $80k.
Deal economics
- At list price, monthly cash flow is $433 ($5k/yr) — positive.
- The deal already cash-flows at list — no discount required.
- Meets the 1% rule at list price ($1k rent vs $80k).
- Cap rate 12.8% vs local median 2.5% in Adrian — top-decile yield for the area; either an underpriced asset or a hidden risk that comps aren't pricing in. Stress-test before assuming the spread holds.
Location & tenants
- Location reads 71/100 on livability (#102 in MO) — a middle-class / working-renter tenant base. Strengths: cost of living A+, housing A+, crime A; Watch: schools C-, amenities F, commute F.
- Adrian R-III (rural): math 28% / reading 50% proficiency, ranked #167 of 324 in MO (top 52%) — families likely to look elsewhere, expect single-tenant / working-renter base with shorter leases.
- Market conditions: 29 active listings in the ZIP; 2 units permitted in Bates County in 2024 (0 in 5+ unit buildings).
Forward outlook
- In year one you build about $9k of equity ($553 loan paydown + $8k appreciation (10.0% local appreciation)).
- Bates County population projected at -22% by 2050 — secular population decline; favor cash flow + early exit over multi-decade hold.
- At projected returns (10.0% appreciation + 3.0% rent growth), your $22k cash investment doubles in ~2 years — after that, you're playing with house money.
- By year 4, paydown + projected appreciation supports a ~$30k cash-out refi (75% LTV) — recoverable capital for the next deal without selling this one.
Negotiation context
- Only 2 days on market — expect competitive offers; lowballing is unlikely to land.
- 3 sale attempts since 9y ago; this cycle's ask has dropped $20k (20%) from the opening price — seller is motivated, your offer sets the floor, not the list.
Risks & watch-outs
- Watch-outs: built in 1930 — expect roof / HVAC / electrical / plumbing capex.
Questions for the listing agent
- Built in 1930 — when were the roof, HVAC, electrical panel, plumbing, and water heater last replaced?
- Is there a deadline driving the sale (1031 exchange, divorce, estate, relocation)? That informs how much negotiation room exists.
- What's the average days-on-market for RENTAL listings here right now (not sales)? A rising rental-DOM trend means longer vacancies and softer asking-rent achievability than the comps imply.
- What's the recent tenant-quality profile in this submarket — average credit score on applications, eviction rate, late-payment / NSF rate, and stable-employment percentage? A property-management company in the area should have these aggregated.
- How much new for-sale + rental construction is in the pipeline within 1–3 miles? Heavy new supply typically softens prices + rents 12–24 months out; constrained supply supports both.
Investment metrics
- 1% rule
- 1.52% ✓
- Cap rate
- 12.79%
- Cash-on-cash
- 23.19%
- DSCR
- 2.03
- GRM
- 5.5
CMA / ARV
No comps found within radius.
Projected returns pro-forma
10.0% appreciation · 3.0% rent growth · sell at horizon
- IRR
- 41.7%
- Equity multiple
- 4.18×
- Total profit
- $71,146
- Equity at exit
- $72,070
- IRR
- 36.0%
- Equity multiple
- 9.39×
- Total profit
- $187,840
- Equity at exit
- $155,422
Cash invested: $22,400 (down + closing). Projections, not guarantees.
Landlord ↔ Tenant lean methodology
- Overall (STATE)
- 81 Strongly Landlord-Friendly
- State Missouri
- 81 Strongly Landlord-Friendly · R+10
- County
- — inherits STATE
- City
- — inherits STATE
ZIP-level market 64720
- Home prices YoY
- 8.1%
- Active inventory
- 29
- Price-to-rent
- 5.5×
Monthly cashflow live
- Estimated rent
- $1,219 medium interval (Pro) →
- Mortgage (P&I)
- −$420
- Tax from tax record
- −$77 /mo · $925/yr
- Insurance
- −$33
- HOA
- −$0
- Vacancy / Maint / Mgmt
- −$256
- Net cashflow
- $433
Break-even live
UW: 25.0% down · 7.5% · 30yr · 1.5% tax · 5.0% vac · 8.0% maint · 8.0% mgmt
Financing live
Cash to close
- Down payment
- $20,000
- Closing costs
- $2,400
- Reserves months
- —
- Total cash needed
- —
Loan-product check · same deal, 3 products live
Conventional
25% down · 7.5% · 30yr
- Down + closing
- —
- Monthly P&I
- —
- Monthly cashflow
- —
- DSCR
- —
- Eligible?
- —
Personal DTI + credit; lowest rate.
DSCR
20% down · 8.5% · 30yr
- Down + closing
- —
- Monthly P&I
- —
- Monthly cashflow
- —
- DSCR
- —
- Eligible?
- —
No personal income docs; deal must DSCR.
Hard money
10% down · 12.0% · 12mo
- Down + closing
- —
- Monthly P&I
- —
- Monthly cashflow
- —
- DSCR
- —
- Eligible?
- —
Short-term bridge; refi at stabilization.
Listing history 3 events
-
2026-06-18days on market $80,000 Coming Soon 2 DOM
-
2026-06-17remarks 691-char remark
-
2026-06-17$80,000 Coming Soon 1 DOM
ⓘ Source: listings_history table (triggers on properties + properties_extension) + one-shot
backfill from property_details.listing_events for pre-trigger history.
Tax reassessment forecast MO · Resets to sale price
- Current annual tax
- $925 · $77/mo
- Projected year-2 tax
- $925 · $77/mo
- Expected delta
- $0/yr ($0/mo · 0.0%)
ⓘ Screening estimate from a state-policy table — verify with the county assessor before closing.
Climate risk First Street
- Flood 1/10 Low FEMA zone X (unshaded) · 0% chance over 30 yrs
- Wildfire 1/10 Low
- Heat 4/10 Moderate 7 d/yr ≥108°F today · 17 d/yr by 30 yrs out
- Wind 2/10 Low
- Air quality 2/10 Low 1 unhealthy d/yr today · 1 by 30 yrs out
Nearby sold comps map
Loading sold comps map…
Walkable amenities ~0.75 mi
Loading nearby amenities…
Taxation est. · year 1
- Rental income
- $14,625
- − Mortgage interest
- −$4,481
- − Property taxes
- −$925
- − Insurance
- −$400
- − Repairs & maintenance
- −$1,170
- − Management
- −$1,170
- − Depreciation
- −$2,327
- Taxable income
- $4,152
- Est. tax owed @ 24.0%
- −$996
- After-tax cash flow
- $4,198/yr
For passive investors: Depreciation is non-cash, so a rental often shows a tax loss while cash-flowing — sheltering income. Rental losses are passive: they offset passive income freely, and up to $25,000/yr can offset ordinary (W-2) income if you actively participate and your MAGI is under $100k (phasing out to $0 by $150k); unused losses carry forward. On sale, claimed depreciation is recaptured at up to 25%, and gains may owe capital-gains tax (a 1031 exchange can defer both). Figures are a year-1 estimate at your 24.0% rate — not tax advice; consult a CPA.
Schools (NCES district)
- District
- Adrian R-III
- NCES district ID
- 2902850
- Math proficiency
- 28% ▼ -12.00%
- Reading proficiency
- 50% ▼ -9.00%
- Median HH income
- $43,790
- Composite
- 32.99/100
- National rank
- #5581
- State rank
- #167 of 324 in MO
Livability — Adrian
- Score
- 71/100
- State rank
- #102
- US rank
- #6848
Category grades
Schools grade is shown separately in the Schools card above.
Census & demographics
- Census place
- Adrian, MO
- Population (ZIP)
- 4,358
Population outlook (Bates County) Hauer SSP2
- Today (2025)
- 15,295 people
- By 2030
- 14,644 · -4.3%
- By 2040
- 13,282 · -13.2%
- By 2050
- 11,944 · -21.9%
- By 2075
- 9,442 · -38.3%
- By 2100
- 7,372 · -51.8%
Race, ethnicity, and origin ACS 2023
- Neighborhood character
- Predominantly White (92%)
- Race & ethnicity
- White 92% Two or more races 4% Black 3% Hispanic / Latino 2%
- Common ancestry
- Iranian 2% Portuguese 2% Italian 1%
- Foreign-born
- 0%
Political lean MEDSL · Bates
- 2024 margin
- Solid R (+61.6) · D 18.7% · R 80.4%
- 2008→2024 swing
- -42.8pp toward R · 2008: -18.9pp · 2024: -61.6pp
- All cycles
- 2024: R+61.6 2020: R+58.5 2016: R+54.6 2012: R+31.7 2008: R+18.9
Not yet ingested
- Civics
- —
Market trends
- HPI YoY
- ▲ 21.86%
- Current HPI
- 293.132
- Rent YoY
- —
- Metro
- —
- State GDP YoY
- ▲ 1.84%
- F500 in state
- 20
Industry mix (Fortune 500 HQ in MO)
| Industry | F500 HQs | Revenue |
|---|---|---|
| Healthcare | 1 | $163B |
|
||
| Insurance | 1 | $21B |
|
||
| Industrial Technology | 1 | $17B |
|
||
| Retail | 1 | $16B |
|
||
| Industrial Distribution | 1 | $10B |
|
||
| Utilities | 1 | $9B |
|
||
Price history
+6.8% since first listed11 events — show timeline
- 2026-06-16 Coming Soon $80,000 Heartland MLS as Distributed by MLS Grid
- 2021-07-06 Sold (Public Records) — Public Records
- 2021-06-22 Sold (MLS) — Heartland MLS as Distributed by MLS Grid
- 2021-05-08 Contingent — Heartland MLS as Distributed by MLS Grid
- 2021-05-07 Relisted — Heartland MLS as Distributed by MLS Grid
- 2021-05-04 Listing Removed — Heartland MLS as Distributed by MLS Grid
- 2021-05-03 Price Changed $110,000 Heartland MLS as Distributed by MLS Grid
- 2021-05-03 Listed $100,000 Heartland MLS as Distributed by MLS Grid
- 2018-09-28 Sold (Public Records) — Public Records
- 2018-09-27 Sold (MLS) — Heartland MLS as Distributed by MLS Grid
- 2017-03-20 Listed $74,900 Heartland MLS as Distributed by MLS Grid
Property tax history
+4.5%/yrLatest (2025): $925 · +13.4% YoY. Source: county tax records.
Cash-flow waterfall
monthlySold comps — $/sqft
last 12 mo · ≤1 miLoading sold comps…