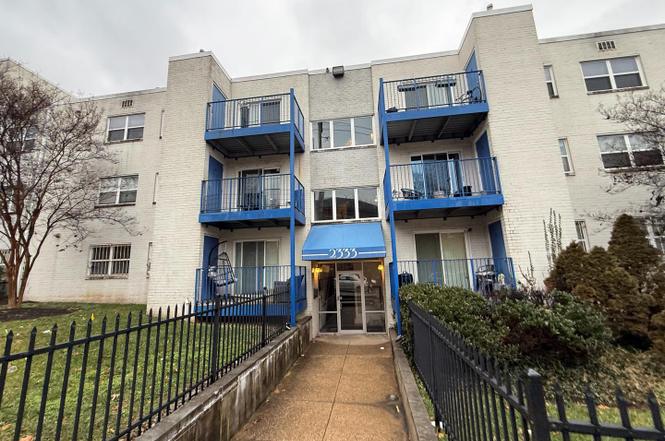
2333 16th St SE #203 · Washington, DC
Flood risk 7/10 · Major
- FEMA flood zone
- X (unshaded)
- Chance of flooding over 30 yrs
- 0.77%
- Est. flood insurance / yr
- $507 – $1,088
Fire risk 1/10 · Minimal
- Est. fire insurance / yr
- $631 – $1,173
Heat risk 7/10 · Major
- Hot days now (above 104°F)
- 7 days/yr
- Hot days in 30 yrs
- 15 days/yr
Wind risk 4/10 · Minor
- Chance of severe wind over 30 yrs
- 20.0%
Air-quality risk 4/10 · Minor
- Unhealthy air days now
- 4 days/yr
- Unhealthy air days in 30 yrs
- 5 days/yr
Risk factors via First Street. Map © Google.
Why this score? — see what drove the B- grade
The composite is a weighted blend of 9 inputs, each scored 0–100. Each bar is that input's sub-score; the figure is the points it added to the 100-point composite (weight × sub-score).
- Cash flow +28.0/30.0
- 1% rule +10.0/10.0
- DSCR +9.9/10.0
- ARV discount +7.5/15.0
- Livability +3.7/5.0
- Schools +3.6/10.0
- Rent growth +3.5/5.0
- Condition / age +2.5/5.0
- Appreciation +0.0/10.0
$99,950
🖨 Deal sheet (PDF) 📄 Offer letter ✓ Due diligence
Listing remarks
No Offers can be submitted for seller review until 2/7/26. * * Some images in this listing have been virtually staged and/or digitally altered. * * Spacious 2-bedroom, 1 full bathroom condominium offering approximately 810 square feet, located in the Fairway/16th Street SE corridor. The unit is in fair to average condition and presents a solid opportunity for an owner-occupant or investor looking to renovate and add value. Functional layout with good room sizes and natural light. Property is being sold AS IS, WHERE IS, with the seller making no repairs. Buyer to independently verify all information, including but not limited to taxes, condo fees, square footage, and any association ma
Key facts
- $539 HOA
- Built 1966
- Listed 140 days
Property features AI
Finance
- Other: In city limits; Directions: W Street SE to Right on 16th Street SE; Finished area: approximately 810 above-grade square feet (estimated)
- HOA & community: Monthly condo fee of $539; Condo fee covers exterior building maintenance, lawn maintenance, pest control, snow removal, trash, and water; Association amenities: other
Exterior
- Parking: On-street parking
- Utilities: Public water; Public sewer; Electric service for major systems
- Home design: Condominium unit/flat; Garden-style building (1–4 floors); Entry on level 2; Building name: ANACOSTIA
- Construction: Above-grade structures
- Exterior features: Pets allowed (case-by-case)
Interior
- Kitchen: Kitchen
- Bedrooms: Two bedrooms on the main level
- Bathrooms: One full bathroom on the main level; One full bathroom total
- Heating & cooling: Heat pump heating; Central air conditioning; Electric heating and cooling; Electric hot water
- Interior features: Estimated living area; Living Room; Kitchen; Basement (other)
- Laundry & utility: Washer/dryer hookup in the unit
Neighborhood map
What this means for you Summary
Snapshot
- This is a 2-bed/1.0-bath condo listed at $100k.
Deal economics
- At list price, monthly cash flow is $245 ($3k/yr) — positive.
- The deal already cash-flows at list — no discount required.
- Meets the 1% rule at list price ($2k rent vs $100k).
- Recommended offer: $88k (12.0% below list) — sets the bar for market timing.
- Cap rate 10.0% vs local median 2.5% in Washington — top-decile yield for the area; either an underpriced asset or a hidden risk that comps aren't pricing in. Stress-test before assuming the spread holds.
Location & tenants
- Location reads 73/100 on livability (#1 in DC) — a middle-class / working-renter tenant base. Strengths: amenities A+, commute A+, employment A+; Watch: crime F, cost of living F.
- District Of Columbia Public Schools (urban): math 33% / reading 40% proficiency, ranked #8 of 32 in DC (top 25%) — families likely to look elsewhere, expect single-tenant / working-renter base with shorter leases; 65% free/reduced lunch — lower-income household profile, screen leases tightly.
- Zoned schools: Capitol Hill Montessori School At Logan (424 students, 0% FRL); Kramer Ms (203 students, 0% FRL); Anacostia Hs (287 students, 0% FRL) — zoned schools average 0% FRL vs 65% district-wide (65 pts lower); this property's tenant base skews higher-income than the district average.
- Market conditions: Rents rising (+3.9%/yr); 298 active listings in the ZIP; 40 comparable units currently listed for rent nearby; rentals at typical pace (median 26d on market — plan ~3-4 weeks tenant-placement turnaround); 1,737 units permitted in District of Columbia in 2024 (1,506 in 5+ unit buildings).
- This rent runs 41% of the median local income ($54k/yr) — at the standard rent-burdened threshold; future hikes will face affordability resistance.
Forward outlook
- Local home prices are declining (-3.0%/yr); year-one equity from $692 of loan paydown is wiped out by about $3k of value loss. Plan a longer hold.
- District of Columbia County population projected at +50% by 2050 — long-run rental-demand tailwind backs the buy-and-hold thesis.
- At projected returns (-3.0% appreciation + 3.9% rent growth), your $28k cash investment doubles in ~9 years — after that, you're playing with house money.
Negotiation context
- It's been on market 141 days — a 12% lower offer ($88k) is reasonable based on typical stale-listing flexibility.
Risks & watch-outs
- Watch-outs: flood insurance adds $66/mo; HOA is 29% of rent.
- Climate carrying-cost: major flood risk; extreme-heat days projected 7→15/yr by 2055 (HVAC capex compounding) — expect insurance premiums to compound above CPI over the hold.
Questions for the listing agent
- It's been on market 141 days. Have you received any prior offers? Is the seller open to a 12% concession, seller financing, or rate buy-down credit?
- Built in 1966 — when were the roof, HVAC, electrical panel, plumbing, and water heater last replaced?
- What's the actual annual flood-insurance premium (NFIP or private), and is the property in a SFHA with mandatory coverage?
- What does the HOA fee cover, when was the last increase, and are there any pending special assessments or reserve-fund shortfalls?
- Any open or pending special assessments — roof, HVAC, plumbing, elevator, façade? What's the per-unit balance and payoff schedule, and is the seller paying it off at close or rolling it to the buyer?
- Why hasn't it sold? Are there any deal-killer items the seller is aware of (foundation, flood, title, zoning, code violations)?
- Is there a deadline driving the sale (1031 exchange, divorce, estate, relocation)? That informs how much negotiation room exists.
- Crime grade is F in this area — have there been break-ins, vandalism, or insurance claims at this property in the last 3 years? What carrier currently insures it and at what premium?
- What's the average days-on-market for RENTAL listings here right now (not sales)? A rising rental-DOM trend means longer vacancies and softer asking-rent achievability than the comps imply.
- What's the recent tenant-quality profile in this submarket — average credit score on applications, eviction rate, late-payment / NSF rate, and stable-employment percentage? A property-management company in the area should have these aggregated.
- How much new apartment / multifamily construction is in the pipeline within 1–3 miles? Heavy new supply (>2% of stock underway) typically softens rents 12–24 months out; light construction supports rent growth.
Investment metrics
- 1% rule
- 1.85% ✓
- Cap rate
- 10.03%
- Cash-on-cash
- 13.35%
- DSCR
- 1.59
- GRM
- 4.5
CMA / ARV
No comps found within radius.
Projected returns pro-forma
-3.0% appreciation · 3.86% rent growth · sell at horizon
- IRR
- 1.2%
- Equity multiple
- 1.05×
- Total profit
- $1,357
- Equity at exit
- $14,903
- IRR
- 12.4%
- Equity multiple
- 2.05×
- Total profit
- $29,414
- Equity at exit
- $8,642
Cash invested: $27,986 (down + closing). Projections, not guarantees.
Landlord ↔ Tenant lean methodology
- Overall (CITY)
- 0 Strongly Tenant-Friendly
- State District of Columbia
- 12 Strongly Tenant-Friendly · D+43
- County
- — inherits STATE
- City Washington
- 0 Strongly Tenant-Friendly · D+43
ZIP-level market 20020
- Rents YoY
- 3.9%
- Active inventory
- 298
- Price-to-rent
- 4.5×
Monthly cashflow live
- Estimated rent
- $1,848 high interval (Pro) →
- Mortgage (P&I)
- −$524
- Tax from tax record
- −$44 /mo · $525/yr
- Insurance
- −$42
- Flood insurance flood zone
- −$66 /mo · $798/yr
- HOA
- −$539
- Vacancy / Maint / Mgmt
- −$388
- Net cashflow
- $245
Break-even live
Sensitivity live
| Price | -10% $301 | -5% $273 | +0% $245 | +5% $217 | +10% $188 |
|---|---|---|---|---|---|
| Rent | -10% $99 | -5% $172 | +0% $245 | +5% $318 | +10% $391 |
| Rate | -1.0pp $295 | -0.5pp $270 | base $245 | +0.5pp $219 | +1.0pp $193 |
UW: 25.0% down · 7.5% · 30yr · 1.5% tax · 5.0% vac · 8.0% maint · 8.0% mgmt
Financing live
Cash to close
- Down payment
- $24,988
- Closing costs
- $2,998
- Reserves months
- —
- Total cash needed
- —
Loan-product check · same deal, 3 products live
Conventional
25% down · 7.5% · 30yr
- Down + closing
- —
- Monthly P&I
- —
- Monthly cashflow
- —
- DSCR
- —
- Eligible?
- —
Personal DTI + credit; lowest rate.
DSCR
20% down · 8.5% · 30yr
- Down + closing
- —
- Monthly P&I
- —
- Monthly cashflow
- —
- DSCR
- —
- Eligible?
- —
No personal income docs; deal must DSCR.
Hard money
10% down · 12.0% · 12mo
- Down + closing
- —
- Monthly P&I
- —
- Monthly cashflow
- —
- DSCR
- —
- Eligible?
- —
Short-term bridge; refi at stabilization.
Rent comps 40 comps
| Address | Beds | Baths | Sqft | Rent | $/sqft | DOM | Units | Dist |
|---|---|---|---|---|---|---|---|---|
| 1619 Butler St SE Unit 3 Washington, DC | 2.0 | 1.0 | 700 | $1,700 | $2.43 | 26d | 1 | 0.09mi |
| 2341 Green St SE Washington, DC | 2.0 | 1.0 | 741 | $1,225 | $1.65 | 26d | 1 | 0.13mi |
| 1425-1429 Cedar St SE Washington, DC | 1.0–2.0 | 1.0–2.0 | 736 | $1,651 | $2.24 | 0d | 5 | 0.17mi |
| 1526 V St SE Unit 2 Washington, DC | 2.0 | 1.0 | 800 | $1,700 | $2.12 | 26d | 1 | 0.19mi |
| 1600 Marion Barry Ave SE Unit Basement -B01 Washington, DC | 1.0 | 1.0 | 550 | $1,550 | $2.82 | 26d | 1 | 0.31mi |
| 1516 Marion Barry Ave SE Unit 301 Washington, DC | 3.0 | 2.0 | 1100 | $1,795 | $1.63 | 9d | 1 | 0.32mi |
| 1847 Marion Barry Ave SE Washington, DC | 1.0–2.0 | 1.0 | 725 | $1,525 | $2.10 | 26d | 1 | 0.34mi |
| 1953 19th Pl SE Apt 301 Washington, DC | 3.0 | 1.0 | 980 | $5,301 | $5.41 | 26d | 1 | 0.35mi |
| 1507 Erie St SE Washington, DC | 1.0 | 1.0 | 1000 | $2,800 | $2.80 | 26d | 1 | 0.35mi |
| 1953 19th Pl SE Apt 104 Washington, DC | 3.0 | 1.0 | 980 | $2,800 | $2.86 | 7d | 1 | 0.35mi |
| 1907 Good Hope Ct SE #7 Washington, DC | 1.0 | 1.0 | 578 | $1,500 | $2.60 | 26d | 1 | 0.36mi |
| 1907 Good Hope Ct SE #309 Washington, DC | 2.0 | 1.0 | 670 | $1,595 | $2.38 | 26d | 1 | 0.36mi |
| 1907 Marion Barry Ave SE Washington, DC | 2.0 | 1.0 | 900 | $1,495 | $1.66 | 26d | 1 | 0.36mi |
| 1302 Morris Rd SE Washington, DC | 3.0 | 1.0 | 750 | $2,400 | $3.20 | 26d | 1 | 0.39mi |
| 1721 T St SE Washington, DC | 1.0–2.0 | 1.0 | 785 | $1,980 | $2.52 | 23d | 6 | 0.39mi |
| 1300 Morris Rd SE Washington, DC | 2.0 | 1.0 | 650 | $1,650 | $2.54 | 0d | 1 | 0.39mi |
| 1300 Morris Rd SE Washington, DC | 2.0 | 1.0 | 650 | $1,499 | $2.31 | 26d | 1 | 0.39mi |
| 1737 T St SE Washington, DC | 2.0 | 1.0 | 800 | $2,500 | $3.12 | 5d | 1 | 0.40mi |
| 1300 Dexter Ter SE Washington, DC | 2.0 | 1.5 | 1100 | $2,600 | $2.36 | 26d | 1 | 0.42mi |
| 2228 Martin Luther King Jr Ave SE Washington, DC | 1.0 | 1.0 | 656 | $1,795 | $2.73 | 0d | 3 | 0.42mi |
| 1721 Minnesota Ave SE Washington, DC | 3.0 | 1.0 | 680 | $1,450 | $2.13 | 26d | 1 | 0.49mi |
| 2629 Douglass Rd SE Washington, DC | 2.0–3.0 | 1.0–1.5 | 888 | $1,450 | $1.63 | 3d | 13 | 0.49mi |
| 2300 Good Hope Rd SE Washington, DC | 2.0 | 1.0–2.0 | 1020 | $1,913 | $1.88 | 26d | 6 | 0.51mi |
| 1642 16th St SE #3 Washington, DC | 2.0 | 1.0 | 870 | $2,000 | $2.30 | 21d | 1 | 0.53mi |
| 1720 R St SE Washington, DC | 3.0 | 1.0 | 750 | $2,500 | $3.33 | 26d | 1 | 0.55mi |
| 1622 17th St SE Unit 2001 Washington, DC | 2.0 | 1.0 | 535 | $1,850 | $3.46 | 26d | 1 | 0.57mi |
| 2400 Good Hope Ct SE #204 Washington, DC | 1.0 | 1.0 | 610 | $1,550 | $2.54 | 0d | 1 | 0.57mi |
| 1621 17th Pl SE Apt 3 Washington, DC | 1.0 | 1.0 | 720 | $1,300 | $1.81 | 26d | 1 | 0.58mi |
| 2609 Douglass Rd SE #402 Washington, DC | 2.0 | 2.0 | 990 | $2,200 | $2.22 | 26d | 1 | 0.59mi |
| 1609 17th St SE #202 Washington, DC | 2.0 | 1.0 | 718 | $1,950 | $2.72 | 26d | 1 | 0.59mi |
| 1609 17th St SE #202 Washington, DC | 2.0 | 1.0 | 718 | $1,950 | $2.72 | 16d | 1 | 0.59mi |
| 1601 17th St SE Washington, DC | 1.0 | 1.0 | 720 | $1,650 | $2.29 | 26d | 1 | 0.60mi |
| 1618 18th St SE Unit 1 Washington, DC | 2.0 | 1.0 | 800 | $1,850 | $2.31 | 26d | 1 | 0.61mi |
| 2607 Naylor Rd SE Washington, DC | 1.0 | 1.0 | 665 | $1,275 | $1.92 | 9d | 4 | 0.65mi |
| 1629 Fairlawn Ave SE Unit 3 Washington, DC | 2.0 | 1.0 | 850 | $2,500 | $2.94 | 26d | 1 | 0.66mi |
| 1629 Fairlawn Ave SE Apt 2 Washington, DC | 2.0 | 1.0 | 850 | $2,800 | $3.29 | 13d | 1 | 0.66mi |
| 1925 Minnesota Ave SE Washington, DC | 1.0 | 1.0 | 600 | $1,400 | $2.33 | 26d | 1 | 0.69mi |
| 2439 25th St SE Washington, DC | 1.0 | 1.0 | 679 | $1,293 | $1.90 | 17d | 1 | 0.73mi |
| 2562 Naylor Rd SE Washington, DC | 1.0–2.0 | 1.0 | 790 | $2,075 | $2.63 | 4d | 21 | 0.76mi |
| 2440 S St SE Unit 4 Washington, DC | 3.0 | 1.0 | 800 | $2,450 | $3.06 | 9d | 1 | 0.77mi |
HOA detail condo
- Monthly dues
- $539 · $6,468/yr
- Assessments
- None detected in remarks — confirm with the listing agent.
Listing history 18 events
-
2026-06-21days on market $99,950 Active 141 DOM
-
2026-06-18days on market $99,950 Active 138 DOM
-
2026-06-17days on market $99,950 Active 137 DOM
-
2026-06-16days on market $99,950 Active 136 DOM
-
2026-06-15days on market $99,950 Active 135 DOM
-
2026-06-13pricedays on market $99,950 Active 133 DOM
-
2026-06-09days on market $104,950 Active 129 DOM
-
2026-06-08days on market $104,950 Active 128 DOM
-
2026-06-07days on market $104,950 Active 127 DOM
-
2026-06-04days on market $104,950 Active 124 DOM
-
2026-06-03days on market $104,950 Active 123 DOM
-
2026-06-02days on market $104,950 Active 122 DOM
-
2026-06-01days on market $104,950 Active 121 DOM
-
2026-05-31days on market $104,950 Active 120 DOM
-
2026-05-14price $104,950
-
2026-04-14price $114,950
-
2026-03-10price $129,950
-
2026-01-31$139,950 Active
ⓘ Source: listings_history table (triggers on properties + properties_extension) + one-shot
backfill from property_details.listing_events for pre-trigger history.
Tax reassessment forecast DC · Partial reset (capped growth)
- Current annual tax
- $525 · $44/mo
- Projected year-2 tax
- $568 · $47/mo
- Expected delta
- +$42/yr (+$4/mo · 8.0%)
ⓘ Screening estimate from a state-policy table — verify with the county assessor before closing.
Climate risk First Street
- Flood 7/10 Severe FEMA zone X (unshaded) · 77% chance over 30 yrs
- Wildfire 1/10 Low
- Heat 7/10 Severe 7 d/yr ≥104°F today · 15 d/yr by 30 yrs out
- Wind 4/10 Moderate 20% chance of damaging wind over 30 yrs
- Air quality 4/10 Moderate 4 unhealthy d/yr today · 5 by 30 yrs out
Nearby sold comps map
Loading sold comps map…
Walkable amenities ~0.75 mi
Loading nearby amenities…
Taxation est. · year 1
- Rental income
- $22,175
- − Mortgage interest
- −$5,599
- − Property taxes
- −$525
- − Insurance
- −$1,297
- − Repairs & maintenance
- −$1,774
- − Management
- −$1,774
- − HOA
- −$6,468
- − Depreciation
- −$2,908
- Taxable income
- $1,830
- Est. tax owed @ 24.0%
- −$439
- After-tax cash flow
- $2,498/yr
For passive investors: Depreciation is non-cash, so a rental often shows a tax loss while cash-flowing — sheltering income. Rental losses are passive: they offset passive income freely, and up to $25,000/yr can offset ordinary (W-2) income if you actively participate and your MAGI is under $100k (phasing out to $0 by $150k); unused losses carry forward. On sale, claimed depreciation is recaptured at up to 25%, and gains may owe capital-gains tax (a 1031 exchange can defer both). Figures are a year-1 estimate at your 24.0% rate — not tax advice; consult a CPA.
Schools (NCES district)
- District
- District Of Columbia Public Schools
- NCES district ID
- 1100030
- Math proficiency
- 33% ▲ 3.00%
- Reading proficiency
- 40% ▲ 5.00%
- Median HH income
- $67,671
- Composite
- 35.84/100
- National rank
- #9606
- State rank
- #8 of 32 in DC
Livability — Washington
- Score
- 73/100
- State rank
- #1
- US rank
- #5327
Category grades
Schools grade is shown separately in the Schools card above.
Census & demographics
- Census place
- Washington, DC
- County
- District of Columbia · 671,873 people
- City population
- 671,873
- Metro
- Washington-Arlington-Alexandria, DC-VA-MD-WV
- Population (ZIP)
- 53,005
- Household income
- $54,032
- Rent vs Own
- Severe rent burden
- 5148.0
Population outlook (District of Columbia County) Hauer SSP2
- Today (2025)
- 821,926 people
- By 2030
- 899,517 · +9.4%
- By 2040
- 1,061,162 · +29.1%
- By 2050
- 1,231,493 · +49.8%
- By 2075
- 1,603,312 · +95.1%
- By 2100
- 1,847,141 · +124.7%
Race, ethnicity, and origin ACS 2023
- Neighborhood character
- Predominantly Black (90%)
- Race & ethnicity
- Black 90% Two or more races 3% Hispanic / Latino 3% White 3%
- Common ancestry
- Lithuanian 1%
- Foreign-born
- 3% · Canada
- Languages at home
- 95% English-only · Spanish 2% French/Haitian/Cajun 1%
Political lean MEDSL · District of Columbia
- 2024 margin
- Solid D (+86.1) · D 91.2% · R 5.1% · Other 3.8%
- 2008→2024 swing
- +0.1pp no change · 2008: 85.9pp · 2024: 86.1pp
- All cycles
- 2024: D+86.1 2020: D+86.8 2016: D+88.7 2012: D+84.2 2008: D+85.9
Not yet ingested
- Civics
- —
Market trends
- HPI YoY
- ▼ -415.44%
- Current HPI
- 306.5068
- Rent YoY
- ▲ 3.86%
- Metro
- Washington-Arlington-Alexandria, DC-VA-MD-WV
- State GDP YoY
- ▲ 1.33%
- F500 in state
- 6
Industry mix (Fortune 500 HQ in DC)
| Industry | F500 HQs | Revenue |
|---|---|---|
| Financial Services | 1 | $153B |
|
||
| Life Sciences / Industrials | 1 | $25B |
|
||
| Industrial Machinery | 1 | $8B |
|
||
Price history
-25.0% since first listed4 events — show timeline
- 2026-05-14 Price Changed $104,950 BRIGHT MLS
- 2026-04-14 Price Changed $114,950 BRIGHT MLS
- 2026-03-10 Price Changed $129,950 BRIGHT MLS
- 2026-01-31 Listed $139,950 BRIGHT MLS
Property tax history
-4.6%/yrLatest (2025): $525 · +7.0% YoY. Source: county tax records.
Cash-flow waterfall
monthlySold comps — $/sqft
last 12 mo · ≤1 miLoading sold comps…