 Duplex
5027 28th Ave S · Gulfport, FL
Flood risk 4/10 · Minor
- FEMA flood zone
- X (shaded)
- Chance of flooding over 30 yrs
- 0.22%
- Est. flood insurance / yr
- $507 – $1,088
Fire risk 1/10 · Minimal
- Est. fire insurance / yr
- $947 – $1,759
Heat risk 10/10 · Severe
- Hot days now (above 106°F)
- 7 days/yr
- Hot days in 30 yrs
- 26 days/yr
Wind risk 10/10 · Severe
- Chance of severe wind over 30 yrs
- 99.0%
Air-quality risk 3/10 · Minor
- Unhealthy air days now
- 3 days/yr
- Unhealthy air days in 30 yrs
- 3 days/yr
Risk factors via First Street. Map © Google.
Why this score? — see what drove the D grade
The composite is a weighted blend of 9 inputs, each scored 0–100. Each bar is that input's sub-score; the figure is the points it added to the 100-point composite (weight × sub-score).
- Cash flow +12.1/30.0
- ARV discount +7.5/15.0
- Schools +4.3/10.0
- Livability +4.0/5.0
- Condition / age +3.8/5.0
- DSCR +3.6/10.0
- 1% rule +3.5/10.0
- Rent growth +2.3/5.0
- Appreciation +0.0/10.0
$389,000
🖨 Deal sheet (PDF) 📄 Offer letter ✓ Due diligence
Multi-family units
County records classify this as Multi-Family (2-4 Unit). Listing-text estimate: 2 units. confirmed
Listing remarks
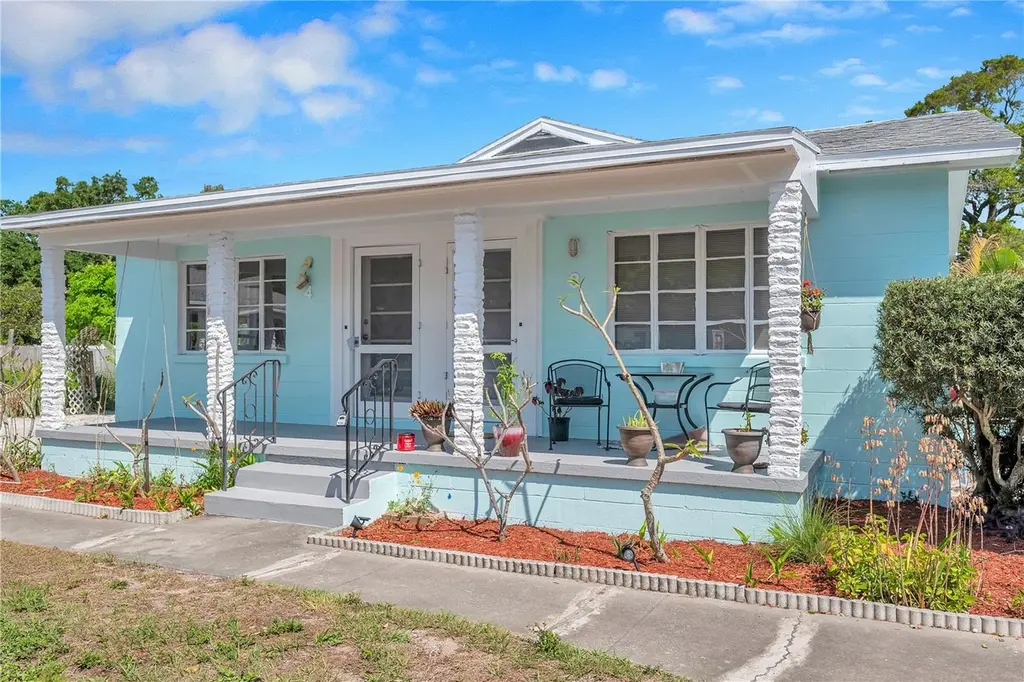
Tucked into the heart of Gulfport, just blocks from the Beach Boulevard arts district, the waterfront, and the weekly Tuesday Fresh Market, this 1949 concrete-block duplex offers two cozy 1-bedroom, 1-bath homes, each refreshed with new paint, luxury vinyl flooring, and updated fixtures, and available furnished or unfurnished. On-site laundry and storage, off-street parking, and a location in Flood Zone X, outside the high-risk flood area. This is one of three neighboring Gulfport properties — seven rental homes in all — offered together as a single portfolio, a rare opportunity to own three side-by-side lots in one of Florida's most walkable, art-filled beach towns. All informa
Key facts
- Storage
- Flood zone x
- Off-street parking
Tags
Property features AI
Finance
- Other: Property type: Residential Income (Duplex); Total buildings: 1; Number of lots: 3; Lot features: City limits, level, sidewalk, paved; Lot dimensions: 50 x 172; Lot acreage: 0.19 acres; Road surface: Paved on public maintained road; Number of separate water meters: 1; Living area reported as 1,360 sq ft (building area total 1,528 sq ft)
- Financial info: Gross income listed at $46,800; Annual net income listed as $0.00; Tenant pays electricity; Terms of lease: Other
- HOA & community: No association fees
Exterior
- Parking: Street parking available
- Security: Closed-circuit camera system; Smoke detectors
- Utilities: Public water; Public sewer; Electricity connected; Water connected; Sewer connected; Broadband/high-speed internet available
- Home design: Residential income duplex; One-story; Completed condition; Has additional parcels; Zoning: H4
- Construction: Block construction; Shingle roof; Pillar/post/pier foundation; Built/Pro forma year listed as 1950 (unit-level)
- Exterior features: Front porch; Fenced yard; Exterior lighting; Sliding doors; Shed(s)
Interior
- Bedrooms: Two bedrooms total; Each unit is a 1-bedroom (2 total units)
- Flooring: Carpet; Tile; Wood
- Bathrooms: One bathroom per unit (2 total)
- Heating & cooling: Central heating; Central air conditioning
- Interior features: Ceiling fans; Closed-circuit cameras; Smoke detectors
- Laundry & utility: Common area laundry
Neighborhood map
What this means for you Summary
Snapshot
- This is a 2 × 1-bed/1.0-bath units multifamily listed at $389k. Condition is rated good.
Deal economics
- At list price, monthly cash flow is $-88 ($-1k/yr) — negative. Per door: $-44/mo.
- To cash-flow at today's rent, offer at most $376k (3.3% below list).
- To meet the 1% rule (rent ≥ 1% of price), the offer needs to be $329k (15.4% below list).
- Recommended offer: $329k (15.4% below list) — sets the bar for 1% rule.
- Cap rate 6.0% vs local median 2.0% in Gulfport — top-decile yield for the area; either an underpriced asset or a hidden risk that comps aren't pricing in. Stress-test before assuming the spread holds.
Location & tenants
- Location reads 79/100 on livability (#151 in FL, #2,285 nationally) — a middle-class / working-renter tenant base. Strengths: commute A+, housing A+, health & safety A+; Watch: crime C-, amenities D.
- Pinellas (suburban): math 51% / reading 51% proficiency, ranked #31 of 73 in FL (top 42%) — acceptable for families but not a draw, mixed tenant base, ~2y average lease.
- Zoned schools: Bear Creek Elementary School (math 47% / reading 42%, grade F, #1,288 of 2,144 statewide, top 62%, 286 students, 82% FRL); Azalea Middle School (math 26% / reading 27%, grade F, #503 of 571 statewide, top 88%, 678 students, 74% FRL); Boca Ciega High School (math 24% / reading 33%, grade F, #458 of 667 statewide, top 69%, 1,423 students, 64% FRL) — zoned schools average 73% FRL vs 48% district-wide (25 pts higher); higher-poverty schools than district average — tighter screening recommended.
- Zoned-school proficiency averages 33% at this address vs 51% district-wide (-18 pts) — the specific schools serving this property underperform the Pinellas average; the district grade overstates school quality for this exact location.
- Market conditions: Rents soft (-0.6%/yr); 462 active listings in the ZIP; 35 comparable units currently listed for rent nearby; rentals leasing fast (median 13d on market — plan ~1-2 weeks tenant-placement turnaround); 2,676 units permitted in Pinellas County in 2024 (1,422 in 5+ unit buildings).
- At $3,291/mo this rent would consume 56% of the median local household income ($70k/yr) (locally 1371% of renters already pay >50% of income on rent) — very limited rent-growth headroom before tenants either downsize or default.
Forward outlook
- Local home prices are declining (-3.0%/yr); year-one equity from $3k of loan paydown is wiped out by about $12k of value loss. Plan a longer hold.
- Pinellas County population projected at +14% by 2050 — modest demand growth; plan on rents tracking national, not racing it.
Negotiation context
- It's been on market 18 days — a 2% lower offer ($383k) is reasonable based on typical stale-listing flexibility.
Risks & watch-outs
- Watch-outs: built in 1949 — expect roof / HVAC / electrical / plumbing capex.
- Climate carrying-cost: severe wind risk, 99% chance of damaging wind over 30y; extreme-heat days projected 7→26/yr by 2055 (HVAC capex compounding) — expect insurance premiums to compound above CPI over the hold.
Questions for the listing agent
- What do current leases actually rent for vs. the listed asking? Can we see a recent rent roll and the last 12 months of T-12 income?
- Can we see the unit-by-unit rent roll, current vacancy, and any below-market leases? What's the average tenancy length?
- What capital expenditures (roof, boiler, parking lot, exteriors) have been made in the last 5 years, and what's planned in the next 2?
- Built in 1949 — when were the roof, HVAC, electrical panel, plumbing, and water heater last replaced?
- Is there a deadline driving the sale (1031 exchange, divorce, estate, relocation)? That informs how much negotiation room exists.
- Schools are D-rated, which usually means shorter tenancies and higher turnover. Who's the typical renter profile here, and what's been the actual vacancy rate?
- The area grade is low — what's the realistic commute time and amenity access for the typical tenant pool here? Any planned neighborhood developments (good or bad) we should know about?
- What's the average days-on-market for RENTAL listings here right now (not sales)? A rising rental-DOM trend means longer vacancies and softer asking-rent achievability than the comps imply.
- What's the recent tenant-quality profile in this submarket — average credit score on applications, eviction rate, late-payment / NSF rate, and stable-employment percentage? A property-management company in the area should have these aggregated.
- How much new apartment / multifamily construction is in the pipeline within 1–3 miles? Heavy new supply (>2% of stock underway) typically softens rents 12–24 months out; light construction supports rent growth.
Investment metrics
- 1% rule
- 0.85% ✗
- Cap rate
- 6.02%
- Cash-on-cash
- -0.97%
- DSCR
- 0.96
- GRM
- 9.9
CMA / ARV
- ARV (on-the-fly)
- $867,680
- Comps found
- 1
Show comp detail 1 sale within ~0.75 mi
| Address | Dist | Beds/Ba | Sqft | Sold | Price | $/sf | Match |
|---|---|---|---|---|---|---|---|
| 5325 31st Ave S | 0.35mi | 3/3.0 (-1) | 1,488 (+9%) | 12mo | $949,000 | $638 | 49 |
Match score weights: distance 35% · size 25% · config 20% · recency 20%. Top-matched comps best support the ARV.
Projected returns pro-forma
-3.0% appreciation · 0.0% rent growth · sell at horizon
- IRR
- -21.3%
- Equity multiple
- 0.28×
- Total profit
- $-78,260
- Equity at exit
- $58,001
- IRR
- -24.1%
- Equity multiple
- -0.03×
- Total profit
- $-112,468
- Equity at exit
- $33,634
Cash invested: $108,920 (down + closing). Projections, not guarantees.
Landlord ↔ Tenant lean methodology
- Overall (STATE)
- 87 Strongly Landlord-Friendly
- State Florida
- 87 Strongly Landlord-Friendly · R+3
- County
- — inherits STATE
- City
- — inherits STATE
ZIP-level market 33707
- Rents YoY
- -0.6%
- Active inventory
- 462
- Price-to-rent
- 19.7×
Monthly cashflow live
- Estimated rent
- $3,291 high interval (Pro) →
- Mortgage (P&I)
- −$2,040
- Tax est. 1.5%
- −$486 /mo · $5,835/yr
- Insurance
- −$162
- HOA
- −$0
- Vacancy / Maint / Mgmt
- −$691
- Net cashflow
- $-88
Break-even live
Sensitivity live
| Price | -10% $180 | -5% $46 | +0% $-88 | +5% $-223 | +10% $-357 |
|---|---|---|---|---|---|
| Rent | -10% $-348 | -5% $-218 | +0% $-88 | +5% $42 | +10% $172 |
| Rate | -1.0pp $107 | -0.5pp $11 | base $-88 | +0.5pp $-189 | +1.0pp $-292 |
2-unit breakdown (identical units grouped — click to expand)
| Units | Beds | Baths | Est. rent |
|---|---|---|---|
| 2× units | 1 | 1 | $3,292 |
| #1 | 1 | 1 | $1,646 |
| #2 | 1 | 1 | $1,646 |
| Total (2 units) | $3,291 | ||
UW: 25.0% down · 7.5% · 30yr · 1.5% tax · 5.0% vac · 8.0% maint · 8.0% mgmt
Financing live
Cash to close
- Down payment
- $97,250
- Closing costs
- $11,670
- Reserves months
- —
- Total cash needed
- —
Loan-product check · same deal, 3 products live
Conventional
25% down · 7.5% · 30yr
- Down + closing
- —
- Monthly P&I
- —
- Monthly cashflow
- —
- DSCR
- —
- Eligible?
- —
Personal DTI + credit; lowest rate.
DSCR
20% down · 8.5% · 30yr
- Down + closing
- —
- Monthly P&I
- —
- Monthly cashflow
- —
- DSCR
- —
- Eligible?
- —
No personal income docs; deal must DSCR.
Hard money
10% down · 12.0% · 12mo
- Down + closing
- —
- Monthly P&I
- —
- Monthly cashflow
- —
- DSCR
- —
- Eligible?
- —
Short-term bridge; refi at stabilization.
Rent comps 35 comps
| Address | Beds | Baths | Sqft | Rent | $/sqft | DOM | Units | Dist |
|---|---|---|---|---|---|---|---|---|
| 2800 Tifton St S Gulfport, FL | 3.0 | 2.0 | 1472 | $3,500 | $2.38 | 26d | 1 | 0.36mi |
| 5702 27th Ave S Gulfport, FL | 3.0 | 2.0 | 1407 | $3,300 | $2.35 | 26d | 1 | 0.55mi |
| 5105 Tangerine Ave S Gulfport, FL | 4.0 | 2.0 | 1860 | $3,750 | $2.02 | 6d | 1 | 0.71mi |
| 5618 20th Ave S Gulfport, FL | 3.0 | 2.0 | 1289 | $3,000 | $2.33 | 26d | 1 | 0.74mi |
| 2044 44th St S Saint Petersburg, FL | 3.0 | 2.0 | 1384 | $2,600 | $1.88 | 23d | 1 | 0.76mi |
| 5850 24th Ave S Gulfport, FL | 3.0 | 2.0 | 1410 | $3,000 | $2.13 | 26d | 1 | 0.76mi |
| 1910 45th St S St Petersburg, FL | 3.0 | 2.0 | 1200 | $1,820 | $1.52 | 0d | 1 | 0.79mi |
| 1701 53rd St S Gulfport, FL | 3.0 | 1.0 | 994 | $2,800 | $2.82 | 6d | 1 | 0.83mi |
| 3585 41st Way S Unit 46E St. Petersburg, FL | 3.0 | 2.0 | 1000 | $2,550 | $2.55 | 6d | 1 | 0.83mi |
| 4631 Queensboro Ave S Unit 4631 St. Petersburg, FL | 3.0 | 2.0 | 1094 | $2,600 | $2.38 | 9d | 1 | 0.84mi |
| 4631 Queensboro Ave S St Petersburg, FL | 3.0 | 2.0 | 1094 | $2,600 | $2.38 | 12d | 1 | 0.84mi |
| 6020 Shore Blvd S #701 Gulfport, FL | 3.0 | 2.5 | 1700 | $2,700 | $1.59 | 6d | 1 | 0.91mi |
| 1721 58th St S Gulfport, FL | 3.0 | 2.0 | 1412 | $2,400 | $1.70 | 5d | 1 | 0.99mi |
| 3775 40th Ln S Unit L Saint Petersburg, FL | 3.0 | 2.0 | 1375 | $2,500 | $1.82 | 26d | 1 | 0.99mi |
| 4721 14th Ave S Saint Petersburg, FL | 5.0 | 3.0 | 1788 | $3,700 | $2.07 | 26d | 1 | 1.04mi |
| 5609 15th Ave S Gulfport, FL | 3.0 | 2.0 | 1453 | $2,925 | $2.01 | 26d | 1 | 1.06mi |
| 2510 38th St S Saint Petersburg, FL | 3.0 | 1.5 | 1104 | $2,340 | $2.12 | 25d | 1 | 1.06mi |
| 2510 38th St S Saint Petersburg, FL | 3.0 | 1.5 | 1104 | $2,340 | $2.12 | 6d | 1 | 1.06mi |
| 4718 13th Ave S Saint Petersburg, FL | 4.0 | 1.5 | 1520 | $2,881 | $1.90 | 14d | 1 | 1.06mi |
| 3901 38th Ave S Saint Petersburg, FL | 1.0–3.0 | 1.0–2.5 | 1070 | $1,675 | $1.57 | 0d | 10 | 1.07mi |
| 1628 43rd St S Saint Petersburg, FL | 3.0 | 2.0 | 1045 | $2,100 | $2.01 | 26d | 1 | 1.09mi |
| 1543 43rd St S Saint Petersburg, FL | 4.0 | 2.0 | 1198 | $3,495 | $2.92 | 6d | 1 | 1.10mi |
| 4938 12th Ave S Gulfport, FL | 3.0 | 2.0 | 990 | $1,795 | $1.81 | 0d | 1 | 1.12mi |
| 1327 43rd St S Saint Petersburg, FL | 3.0 | 1.5 | 959 | $2,250 | $2.35 | 6d | 1 | 1.19mi |
| 1734 39th St S Saint Petersburg, FL | 4.0 | 2.0 | 1152 | $2,000 | $1.74 | 26d | 1 | 1.26mi |
| 4700 10th Ave S Unit 1 St. Petersburg, FL | 4.0 | 2.0 | 1300 | $2,650 | $2.04 | 26d | 1 | 1.26mi |
| 4700 10th Ave S Saint Petersburg, FL | 3.0 | 2.0 | 1300 | $2,500 | $1.92 | 22d | 1 | 1.26mi |
| 4801 10th Ave S Unit 1 St. Petersburg, FL | 3.0 | 1.0 | 1100 | $2,200 | $2.00 | 26d | 1 | 1.27mi |
| 1642 39th St S Saint Petersburg, FL | 3.0 | 1.0 | 975 | $1,995 | $2.05 | 22d | 1 | 1.29mi |
| 4421 11th Ave S Saint Petersburg, FL | 3.0 | 2.0 | 945 | $2,000 | $2.12 | 6d | 1 | 1.29mi |
| 4537 10th Ave S Saint Petersburg, FL | 4.0 | 2.0 | 1046 | $2,690 | $2.57 | 6d | 1 | 1.32mi |
| 4029 13th Ave S St Petersburg, FL | 3.0 | 2.0 | 1152 | $2,650 | $2.30 | 26d | 1 | 1.36mi |
| 1119 59th St S Gulfport, FL | 3.0 | 2.0 | 1208 | $2,415 | $2.00 | 6d | 1 | 1.37mi |
| 800 51st St S Gulfport, FL | 3.0 | 2.0 | 1258 | $3,200 | $2.54 | 6d | 1 | 1.38mi |
| 3603 16th Ave S Saint Petersburg, FL | 4.0 | 2.0 | 1235 | $3,000 | $2.43 | 6d | 1 | 1.49mi |
Listing history 11 events
-
2026-06-22days on market $389,000 Active 18 DOM
-
2026-06-18days on market $389,000 Active 15 DOM
-
2026-06-17days on market $389,000 Active 14 DOM
-
2026-06-16days on market $389,000 Active 13 DOM
-
2026-06-15days on market $389,000 Active 12 DOM
-
2026-06-13days on market $389,000 Active 10 DOM
-
2026-06-09days on market $389,000 Active 6 DOM
-
2026-06-08days on market $389,000 Active 5 DOM
-
2026-06-07days on market $389,000 Active 4 DOM
-
2026-06-04remarks 687-char remark
-
2026-06-04$389,000 Active 1 DOM
ⓘ Source: listings_history table (triggers on properties + properties_extension) + one-shot
backfill from property_details.listing_events for pre-trigger history.
Climate risk First Street
- Flood 4/10 Moderate FEMA zone X (shaded) · 22% chance over 30 yrs
- Wildfire 1/10 Low
- Heat 10/10 Extreme 7 d/yr ≥106°F today · 26 d/yr by 30 yrs out
- Wind 10/10 Extreme 99% chance of damaging wind over 30 yrs
- Air quality 3/10 Moderate 3 unhealthy d/yr today · 3 by 30 yrs out
Nearby sold comps map
Loading sold comps map…
Walkable amenities ~0.75 mi
Loading nearby amenities…
Taxation est. · year 1
- Rental income
- $39,492
- − Mortgage interest
- −$21,790
- − Property taxes
- −$5,835
- − Insurance
- −$1,945
- − Repairs & maintenance
- −$3,159
- − Management
- −$3,159
- − Depreciation
- −$11,316
- Taxable loss
- −$7,713
- Est. tax savings @ 24.0%
- +$1,851
- After-tax cash flow
- $790/yr
For passive investors: Depreciation is non-cash, so a rental often shows a tax loss while cash-flowing — sheltering income. Rental losses are passive: they offset passive income freely, and up to $25,000/yr can offset ordinary (W-2) income if you actively participate and your MAGI is under $100k (phasing out to $0 by $150k); unused losses carry forward. On sale, claimed depreciation is recaptured at up to 25%, and gains may owe capital-gains tax (a 1031 exchange can defer both). Figures are a year-1 estimate at your 24.0% rate — not tax advice; consult a CPA.
Condition & rehab AI · 14 photos
This 1949 concrete-block duplex is in good condition with a good exterior, roof, and interior. It has a good location and is ready for a new owner to move in and enjoy.
Value-add opportunities
- Both Paint the exterior walls — Painting the exterior walls can improve the curb appeal and increase the home's value for both resale and rental.
- Both Trim the landscaping — Trimming the landscaping can improve the curb appeal and increase the home's value for both resale and rental.
- Both Service the HVAC system — Servicing the HVAC system can improve the home's comfort and energy efficiency, which can increase the home's value for both resale and rental.
Renovation cost estimate screening
Value-add ROI direction
- Both Paint the exterior walls — Painting the exterior walls can improve the curb appeal and increase the home's value for both resale and rental. ↑
- Both Trim the landscaping — Trimming the landscaping can improve the curb appeal and increase the home's value for both resale and rental. ↑
- Both Service the HVAC system — Servicing the HVAC system can improve the home's comfort and energy efficiency, which can increase the home's value for both resale and rental. ↑
ⓘ Cost ranges are severity-bucket heuristics (US national rule-of-thumb). Get contractor quotes + a written scope before underwriting a rehab budget.
Schools (NCES district)
- District
- Pinellas
- NCES district ID
- 1201560
- Math proficiency
- 51% ▼ -5.00%
- Reading proficiency
- 51% ▼ -3.00%
- Median HH income
- $46,270
- Composite
- 43.27/100
- National rank
- #3046
- State rank
- #31 of 73 in FL
Livability — Gulfport
- Score
- 79/100
- State rank
- #151
- US rank
- #2285
Category grades
Schools grade is shown separately in the Schools card above.
Census & demographics
- Census place
- Gulfport, FL
- County
- Pinellas County · 939,478 people
- City population
- 24,324
- Metro
- Tampa-St. Petersburg-Clearwater, FL
- Population (ZIP)
- 24,324
- Household income
- $69,951
- Rent vs Own
- Severe rent burden
- 1371.0
Population outlook (Pinellas County) Hauer SSP2
- Today (2025)
- 1,027,532 people
- By 2030
- 1,063,586 · +3.5%
- By 2040
- 1,125,020 · +9.5%
- By 2050
- 1,168,637 · +13.7%
- By 2075
- 1,265,188 · +23.1%
- By 2100
- 1,260,357 · +22.7%
Race, ethnicity, and origin ACS 2023
- Neighborhood character
- Predominantly White (81%)
- Race & ethnicity
- White 81% Two or more races 7% Hispanic / Latino 7% Black 6% Asian 2%
- Hispanic origin (detail)
- Mexican 2% Puerto Rican 1% Cuban 1%
- Common ancestry
- Romanian 5% Lithuanian 3% Slovak 3%
- Foreign-born
- 11% · Canada, Vietnam
- Languages at home
- 89% English-only · Spanish 5% Russian/Polish/Slavic 1% French/Haitian/Cajun 1%
Political lean MEDSL · Pinellas
- 2024 margin
- Lean R (+5.2) · D 46.9% · R 52.1%
- 2008→2024 swing
- -13.5pp toward R · 2008: 8.3pp · 2024: -5.2pp
- All cycles
- 2024: R+5.2 2020: D+0.2 2016: R+1.1 2012: D+5.6 2008: D+8.3
Not yet ingested
- Civics
- —
Market trends
- HPI YoY
- ▼ -555.96%
- Current HPI
- 359.4858
- Rent YoY
- ▼ -0.61%
- Metro
- Tampa-St. Petersburg-Clearwater, FL
- State GDP YoY
- ▲ 3.28%
- F500 in state
- 36
Industry mix (Fortune 500 HQ in FL)
| Industry | F500 HQs | Revenue |
|---|---|---|
| Industrial Technology | 2 | $29B |
|
||
| Insurance | 2 | $17B |
|
||
| Retail | 1 | $60B |
|
||
| Technology Distribution | 1 | $58B |
|
||
| Homebuilding | 1 | $35B |
|
||
| Technology Manufacturing | 1 | $35B |
|
||
Price history
1 event — show timeline
- 2026-06-03 Listed $389,000 Stellar MLS as Distributed by MLS Grid
Cash-flow waterfall
monthlySold comps — $/sqft
last 12 mo · ≤1 miLoading sold comps…