1329 Capecastle Ln · Forney, TX
Flood risk No data
- FEMA flood zone
- —
- Chance of flooding over 30 yrs
- —
- Est. flood insurance / yr
- —
Fire risk No data
- Est. fire insurance / yr
- —
Heat risk No data
- Hot days now (above threshold)
- —
- Hot days in 30 yrs
- —
Wind risk No data
- Chance of severe wind over 30 yrs
- —
Air-quality risk No data
- Unhealthy air days now
- —
- Unhealthy air days in 30 yrs
- —
Risk factors via First Street. Map © Google.
Why this score? — see what drove the D- grade
The composite is a weighted blend of 9 inputs, each scored 0–100. Each bar is that input's sub-score; the figure is the points it added to the 100-point composite (weight × sub-score).
- Cash flow +11.0/30.0
- ARV discount +6.8/15.0
- Schools +4.0/10.0
- Livability +3.8/5.0
- Condition / age +3.8/5.0
- 1% rule +3.5/10.0
- DSCR +3.2/10.0
- Rent growth +2.9/5.0
- Appreciation +0.0/10.0
$306,990
🖨 Deal sheet 📄 Offer letter ✓ Due diligence
Listing remarks
It's crystal clear that the Quartz appeals to everyone. This popular single-story plan shines because of the great room. The layout allows you to simultaneously keep your eyes on architects constructing forts and others prepping for the big debate tournament. While they work, you can play in your extravagant open kitchen. There's plenty of counterspace for rolling out pizza dough. Set the toppings on the island and let the chefs get to work. The spacious primary suite can be your personal haven. Set up the adjacent study nook as a drop zone for everyone. The guest suite is nestled next to a full bath with dual sinks perfect for weekend guests!
Key facts
- Counterspace
- Primary suite
- Great room
Tags
Property features AI
Finance
- Other: List price $306,990; Listing status: Active
- HOA & community: Association fee of $65
Exterior
- Parking: 2 garage spaces; 2 total parking spaces
- Home design: Single-family property (spec plan named "1329 Capecastle Lane")
- Exterior features: Living area of 1,866 (listed)
Interior
- Bedrooms: 4 bedrooms
- Bathrooms: 2 full bathrooms
- Interior features: Spec home (new construction inventory)
Neighborhood map
What this means for you Summary
Snapshot
- This is a 4-bed/2.0-bath single-family listed at $307k. Condition is rated good.
Deal economics
- At list price, monthly cash flow is $-132 ($-2k/yr) — negative.
- To cash-flow at today's rent, offer at most $288k (6.2% below list).
- To meet the 1% rule (rent ≥ 1% of price), the offer needs to be $260k (15.3% below list).
- Recommended offer: $260k (15.3% below list) — sets the bar for 1% rule.
- Cap rate 5.8% vs local median 4.1% in Forney — top-decile yield for the area; either an underpriced asset or a hidden risk that comps aren't pricing in. Stress-test before assuming the spread holds.
Location & tenants
- Location reads 76/100 on livability (#98 in TX, #3,339 nationally) — a middle-class / working-renter tenant base. Strengths: crime A+, employment A+, cost of living A+; Watch: amenities C-, commute F.
- Forney ISD (rural): math 41% / reading 44% proficiency, ranked #234 of 826 in TX (top 28%) — families likely to look elsewhere, expect single-tenant / working-renter base with shorter leases.
- Market conditions: Rents rising (+1.4%/yr); 2179 active listings in the ZIP; 40 comparable units currently listed for rent nearby; rentals at typical pace (median 24d on market — plan ~3-4 weeks tenant-placement turnaround); 40% of comp listings sitting > 30 days — soft ceiling on asking rent; solid renter incomes; 1,747 units permitted in Kaufman County in 2024 (180 in 5+ unit buildings).
- This rent runs 30% of the median local income ($104k/yr) — at the standard rent-burdened threshold; future hikes will face affordability resistance.
Forward outlook
- Local home prices are declining (-3.0%/yr); year-one equity from $2k of loan paydown is wiped out by about $9k of value loss. Plan a longer hold.
- Kaufman County population projected at +43% by 2050 — long-run rental-demand tailwind backs the buy-and-hold thesis.
Negotiation context
- Only 3 days on market — expect competitive offers; lowballing is unlikely to land.
Questions for the listing agent
- What do current leases actually rent for vs. the listed asking? Can we see a recent rent roll and the last 12 months of T-12 income?
- What does the HOA fee cover, when was the last increase, and are there any pending special assessments or reserve-fund shortfalls?
- Is there a deadline driving the sale (1031 exchange, divorce, estate, relocation)? That informs how much negotiation room exists.
- Schools are B-rated — typically a magnet for longer-tenancy family renters. What's the average tenant stay here, and is there a school-zone premium baked into asking?
- The area grade is low — what's the realistic commute time and amenity access for the typical tenant pool here? Any planned neighborhood developments (good or bad) we should know about?
- What's the average days-on-market for RENTAL listings here right now (not sales)? A rising rental-DOM trend means longer vacancies and softer asking-rent achievability than the comps imply.
- What's the recent tenant-quality profile in this submarket — average credit score on applications, eviction rate, late-payment / NSF rate, and stable-employment percentage? A property-management company in the area should have these aggregated.
- How much new for-sale + rental construction is in the pipeline within 1–3 miles? Heavy new supply typically softens prices + rents 12–24 months out; constrained supply supports both.
Investment metrics
- 1% rule
- 0.85% ✗
- Cap rate
- 5.78%
- Cash-on-cash
- -1.84%
- DSCR
- 0.92
- GRM
- 9.8
CMA / ARV
- ARV (on-the-fly)
- $302,292
- Comps found
- 12
Show comp detail 12 sales within ~0.75 mi
| Address | Dist | Beds/Ba | Sqft | Sold | Price | $/sf | Match |
|---|---|---|---|---|---|---|---|
| 1859 Balfour Bnd | 0.08mi | 4/2.0 | 1,866 (0%) | 0mo | $304,990 | $163 | 96 |
| 1932 Callington Way | 0.06mi | 4/2.0 | 1,800 (-4%) | 2mo | $299,990 | $167 | 90 |
| 1861 Balfour Bnd | 0.08mi | 3/2.0 (-1) | 1,909 (+2%) | 1mo | $309,990 | $162 | 87 |
| 1184 Nora Ln | 0.13mi | 4/2.0 | 1,791 (-4%) | 0mo | $312,990 | $175 | 87 |
| 2235 Willowbank Dr | 0.11mi | 3/2.0 (-1) | 1,986 (+6%) | 0mo | $317,990 | $160 | 79 |
| 1887 Balfour Bnd | 0.11mi | 4/2.5 | 2,084 (+12%) | 2mo | $319,990 | $154 | 72 |
| 2931 Soaring Hills Dr | 0.34mi | 4/3.0 | 1,942 (+4%) | 2mo | $374,900 | $193 | 72 |
| 1899 Balfour Bnd | 0.15mi | 4/2.5 | 2,084 (+12%) | 2mo | $319,990 | $154 | 70 |
| 1290 Binfield Dr | 0.51mi | 3/2.0 (-1) | 1,901 (+2%) | 0mo | $294,990 | $155 | 68 |
| 2122 Winsbury Way | 0.43mi | 3/2.0 (-1) | 1,771 (-5%) | 0mo | $285,000 | $161 | 66 |
| 2019 Brewers Ln | 0.40mi | 3/2.0 (-1) | 1,984 (+6%) | 1mo | $352,900 | $178 | 65 |
| 2078 Rosebury Ln | 0.51mi | 3/2.0 (-1) | 1,643 (-12%) | 1mo | $250,000 | $152 | 51 |
Match score weights: distance 35% · size 25% · config 20% · recency 20%. Top-matched comps best support the ARV.
Projected returns pro-forma
-3.0% appreciation · 1.42% rent growth · sell at horizon
- IRR
- -21.2%
- Equity multiple
- 0.28×
- Total profit
- $-62,139
- Equity at exit
- $45,773
- IRR
- -18.8%
- Equity multiple
- 0.06×
- Total profit
- $-80,788
- Equity at exit
- $26,543
Cash invested: $85,957 (down + closing). Projections, not guarantees.
Landlord ↔ Tenant lean methodology
- Overall (STATE)
- 87 Strongly Landlord-Friendly
- State Texas
- 87 Strongly Landlord-Friendly · R+5
- County
- — inherits STATE
- City
- — inherits STATE
ZIP-level market 75126
- Rents YoY
- 1.4%
- Active inventory
- 2179
- Price-to-rent
- 9.8×
Monthly cashflow live
- Estimated rent
- $2,601 high interval (Pro) →
- Mortgage (P&I)
- −$1,610
- Tax est. 1.5%
- −$384 /mo · $4,605/yr
- Insurance
- −$128
- HOA
- −$65
- Vacancy / Maint / Mgmt
- −$546
- Net cashflow
- $-132
Break-even live
UW: 25.0% down · 7.5% · 30yr · 1.5% tax · 5.0% vac · 8.0% maint · 8.0% mgmt
Financing live
Cash to close
- Down payment
- $76,748
- Closing costs
- $9,210
- Reserves months
- —
- Total cash needed
- —
Loan-product check · same deal, 3 products live
Conventional
25% down · 7.5% · 30yr
- Down + closing
- —
- Monthly P&I
- —
- Monthly cashflow
- —
- DSCR
- —
- Eligible?
- —
Personal DTI + credit; lowest rate.
DSCR
20% down · 8.5% · 30yr
- Down + closing
- —
- Monthly P&I
- —
- Monthly cashflow
- —
- DSCR
- —
- Eligible?
- —
No personal income docs; deal must DSCR.
Hard money
10% down · 12.0% · 12mo
- Down + closing
- —
- Monthly P&I
- —
- Monthly cashflow
- —
- DSCR
- —
- Eligible?
- —
Short-term bridge; refi at stabilization.
Rent comps 40 comps
| Address | Beds | Baths | Sqft | Rent | $/sqft | DOM | Units | Dist |
|---|---|---|---|---|---|---|---|---|
| 2029 Dovedale Dr Forney, TX | 4.0 | 3.0 | 2426 | $3,200 | $1.32 | 43d | 1 | 0.17mi |
| 1806 Balfour Bnd Forney, TX | 3.0 | 2.0 | 1981 | $2,600 | $1.31 | 24d | 1 | 0.23mi |
| 635 Brockwell Bnd Forney, TX | 4.0 | 3.0 | 2506 | $3,300 | $1.32 | 19d | 1 | 0.38mi |
| 1448 Kingswell Ln Forney, TX | 4.0 | 3.0 | 2208 | $2,950 | $1.34 | 24d | 1 | 0.52mi |
| 2023 Avondown Rd Forney, TX | 3.0 | 2.0 | 1640 | $2,296 | $1.40 | 4d | 1 | 0.53mi |
| 1128 Queensdown Way Forney, TX | 4.0 | 3.0 | 2097 | $2,999 | $1.43 | 43d | 1 | 0.53mi |
| 1120 Canterbury Ln Forney, TX | 4.0 | 3.0 | 2450 | $2,950 | $1.20 | 12d | 1 | 0.65mi |
| 1421 Kirkhill Ln Unit 1421 Heath, TX | 4.0 | 3.0 | 2545 | $3,500 | $1.38 | 20d | 1 | 0.74mi |
| 1421 Kirkhill Ln Forney, TX | 4.0 | 3.0 | 2545 | $3,600 | $1.41 | 24d | 1 | 0.74mi |
| 2217 Perrymead Dr Forney, TX | 3.0 | 2.0 | 1423 | $2,360 | $1.66 | 4d | 1 | 0.76mi |
| 2225 Heaton Forney, TX | 3.0 | 2.0 | 1909 | $2,150 | $1.13 | 43d | 1 | 0.80mi |
| 2287 Cliff Springs Dr Forney, TX | 4.0 | 2.0 | 2000 | $2,195 | $1.10 | 43d | 1 | 0.81mi |
| 2003 Pine Stone Ln Forney, TX | 3.0 | 2.0 | 1488 | $2,000 | $1.34 | 43d | 1 | 0.81mi |
| 1728 High Perch Ln Forney, TX | 3.0 | 2.0 | 1474 | $1,800 | $1.22 | 18d | 1 | 0.82mi |
| 1729 High Perch Ln Forney, TX | 4.0 | 2.0 | 1720 | $2,350 | $1.37 | 43d | 1 | 0.83mi |
| 2213 Heaton Forney, TX | 3.0 | 2.0 | 2146 | $2,395 | $1.12 | 7d | 1 | 0.83mi |
| 2213 Heaton Forney, TX | 3.0 | 2.0 | 2146 | $2,395 | $1.12 | 16d | 1 | 0.83mi |
| 2207 Heaton Forney, TX | 3.0 | 2.0 | 1423 | $2,100 | $1.48 | 43d | 1 | 0.84mi |
| 1158 Barbary Fields St Forney, TX | 4.0 | 2.0 | 1780 | $2,300 | $1.29 | 43d | 1 | 0.84mi |
| 1147 Barbary Fields St Forney, TX | 3.0 | 2.0 | 1522 | $2,100 | $1.38 | 2d | 1 | 0.85mi |
| 1947 Aves Glen Ln Forney, TX | 3.0 | 2.0 | 1411 | $2,195 | $1.56 | 24d | 1 | 0.86mi |
| 1355 Wedgeleaf Ln Forney, TX | 3.0 | 2.0 | 1461 | $2,200 | $1.51 | 43d | 1 | 0.89mi |
| 1017 Somerset Cir Forney, TX | 3.0 | 2.0 | 2185 | $2,375 | $1.09 | 7d | 1 | 0.90mi |
| 1633 Briar Hunt Dr Forney, TX | 5.0 | 2.5 | 2470 | $2,500 | $1.01 | 20d | 1 | 0.91mi |
| 1025 Dunhill Ln Forney, TX | 4.0 | 2.0 | 2273 | $2,450 | $1.08 | 2d | 1 | 0.92mi |
| 1636 Briar Hunt Dr Forney, TX | 4.0 | 2.5 | 2000 | $2,250 | $1.12 | 43d | 1 | 0.94mi |
| 1650 Briar Hunt Dr Forney, TX | 3.0 | 2.0 | 1559 | $1,995 | $1.28 | 24d | 1 | 0.94mi |
| 1718 Cecil Crest Ln Forney, TX | 4.0 | 2.5 | 2147 | $2,395 | $1.12 | 43d | 1 | 0.98mi |
| 1631 Rosy Finch Dr Heath, TX | 4.0 | 2.0 | 1665 | $2,600 | $1.56 | 16d | 1 | 0.99mi |
| 2330 Aspen Hill Dr Forney, TX | 3.0 | 2.0 | 1498 | $1,795 | $1.20 | 18d | 1 | 1.00mi |
| 1429 Dovekie Dr Forney, TX | 3.0 | 2.0 | 1311 | $2,500 | $1.91 | 2d | 1 | 1.00mi |
| 1405 Merlin Bluff St Forney, TX | 3.0 | 2.0 | 1500 | $2,400 | $1.60 | 6d | 1 | 1.00mi |
| 1625 Rosy Finch Dr Forney, TX | 4.0 | 2.0 | 1667 | $2,095 | $1.26 | 43d | 1 | 1.01mi |
| 2111 River Pine Rd Forney, TX | 3.0 | 2.0 | 1496 | $1,950 | $1.30 | 43d | 1 | 1.02mi |
| 1622 Rosy Finch Dr Forney, TX | 4.0 | 2.0 | 1665 | $2,195 | $1.32 | 43d | 1 | 1.03mi |
| 1727 Crossbill St Forney, TX | 3.0 | 2.0 | 1311 | $1,750 | $1.33 | 18d | 1 | 1.03mi |
| 1725 Crossbill St Forney, TX | 3.0 | 2.0 | 1451 | $1,785 | $1.23 | 43d | 1 | 1.03mi |
| 1723 Crossbill St Forney, TX | 3.0 | 2.0 | 1461 | $1,785 | $1.22 | 43d | 1 | 1.03mi |
| 1719 Crossbill St Forney, TX | 3.0 | 2.0 | 1474 | $1,795 | $1.22 | 22d | 1 | 1.04mi |
| 1289 Wedgeleaf Ln Forney, TX | 3.0 | 2.0 | 1522 | $1,785 | $1.17 | 22d | 1 | 1.04mi |
HOA detail
- Monthly dues
- $65 · $780/yr
Listing history 4 events
-
2026-06-18days on market $306,990 Active 3 DOM
-
2026-06-17days on market $306,990 Active 2 DOM
-
2026-06-16remarks 651-char remark
-
2026-06-16$306,990 Active 1 DOM
ⓘ Source: listings_history table (triggers on properties + properties_extension) + one-shot
backfill from property_details.listing_events for pre-trigger history.
Nearby sold comps map
Loading sold comps map…
Walkable amenities ~0.75 mi
Loading nearby amenities…
Taxation est. · year 1
- Rental income
- $31,209
- − Mortgage interest
- −$17,196
- − Property taxes
- −$4,605
- − Insurance
- −$1,535
- − Repairs & maintenance
- −$2,497
- − Management
- −$2,497
- − HOA
- −$780
- − Depreciation
- −$8,931
- Taxable loss
- −$6,831
- Est. tax savings @ 24.0%
- +$1,639
- After-tax cash flow
- $56/yr
For passive investors: Depreciation is non-cash, so a rental often shows a tax loss while cash-flowing — sheltering income. Rental losses are passive: they offset passive income freely, and up to $25,000/yr can offset ordinary (W-2) income if you actively participate and your MAGI is under $100k (phasing out to $0 by $150k); unused losses carry forward. On sale, claimed depreciation is recaptured at up to 25%, and gains may owe capital-gains tax (a 1031 exchange can defer both). Figures are a year-1 estimate at your 24.0% rate — not tax advice; consult a CPA.
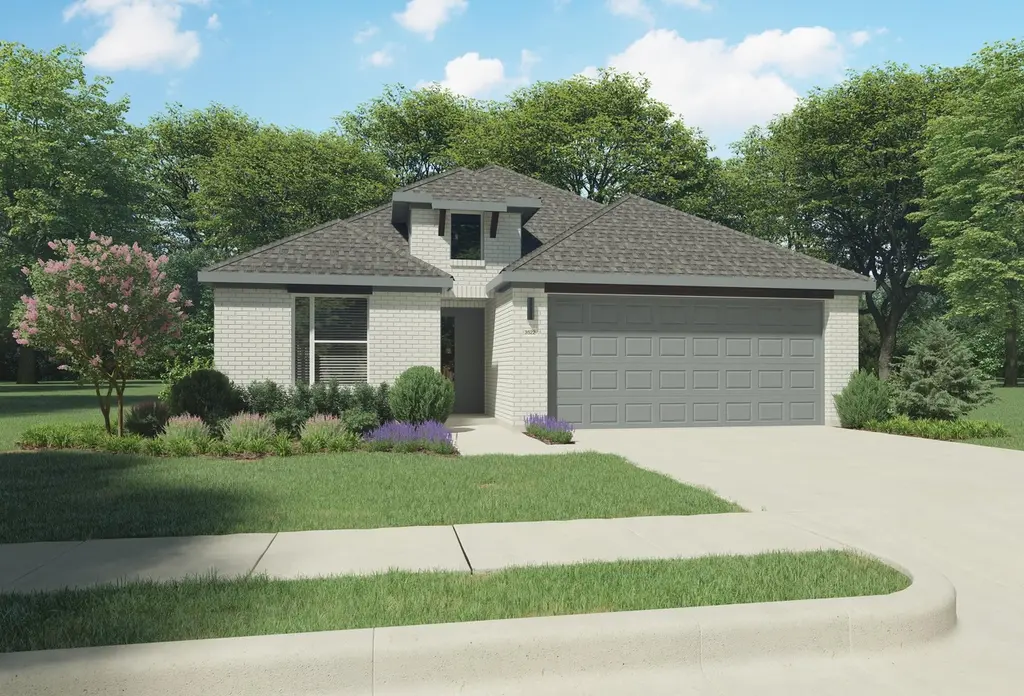
Condition & rehab AI · 1 photo
This single-story home is in good condition with a good layout and ample space. It's ready for a fresh coat of paint and some landscaping improvements to enhance its curb appeal and overall value.
Value-add opportunities
- Both Painting the exterior and interior — Fresh paint enhances curb appeal and interior aesthetics.
- Both Landscaping improvements — Enhances curb appeal and adds value to the property.
- Both New flooring in high-traffic areas — Improves the overall look and feel of the home, attracting more buyers and renters.
- Both HVAC system maintenance or replacement — Ensures the HVAC system is functioning efficiently, which is crucial for both resale and rental value.
- Both Kitchen and bathroom updates — Modernizing these spaces can significantly increase the home's appeal and value, especially for potential buyers and renters.
Renovation cost estimate screening
Value-add ROI direction
- Both Painting the exterior and interior — Fresh paint enhances curb appeal and interior aesthetics. ↑
- Both Landscaping improvements — Enhances curb appeal and adds value to the property. ↑
- Both New flooring in high-traffic areas — Improves the overall look and feel of the home, attracting more buyers and renters. ↑
- Both HVAC system maintenance or replacement — Ensures the HVAC system is functioning efficiently, which is crucial for both resale and rental value. ↑
- Both Kitchen and bathroom updates — Modernizing these spaces can significantly increase the home's appeal and value, especially for potential buyers and renters. ↑
ⓘ Cost ranges are severity-bucket heuristics (US national rule-of-thumb). Get contractor quotes + a written scope before underwriting a rehab budget.
Schools (NCES district)
- District
- Forney ISD
- NCES district ID
- 4819560
- Math proficiency
- 41% ▼ -20.00%
- Reading proficiency
- 44% ▼ -12.00%
- Median HH income
- $86,679
- Composite
- 40.07/100
- National rank
- #3812
- State rank
- #234 of 826 in TX
Livability — Forney
- Score
- 76/100
- State rank
- #98
- US rank
- #3339
Category grades
Schools grade is shown separately in the Schools card above.
Census & demographics
- County
- Kaufman County · 122,338 people
- City population
- 84,799
- Metro
- Dallas-Fort Worth-Arlington, TX
- Population (ZIP)
- 84,799
- Household income
- $103,673
- Rent vs Own
- Severe rent burden
- 1306.0
Population outlook (Kaufman County) Hauer SSP2
- Today (2025)
- 138,716 people
- By 2030
- 150,815 · +8.7%
- By 2040
- 174,877 · +26.1%
- By 2050
- 198,020 · +42.8%
- By 2075
- 251,908 · +81.6%
- By 2100
- 285,325 · +105.7%
Race, ethnicity, and origin ACS 2023
- Neighborhood character
- Diverse neighborhood (Simpson 0.68)
- Race & ethnicity
- White 45% Black 25% Hispanic / Latino 23% Two or more races 14% Asian 3%
- Hispanic origin (detail)
- Mexican 18% Puerto Rican 1%
- Common ancestry
- Italian 2% Slovak 1% Portuguese 1%
- Foreign-born
- 12% · Canada, Vietnam
- Languages at home
- 79% English-only · Spanish 14% Arabic 1% Vietnamese 1%
Political lean MEDSL · Kaufman
- 2024 margin
- Strong R (+27.9) · D 35.6% · R 63.5%
- 2008→2024 swing
- +7.9pp toward D · 2008: -35.8pp · 2024: -27.9pp
- All cycles
- 2024: R+27.9 2020: R+33.9 2016: R+47.0 2012: R+44.4 2008: R+35.8
Not yet ingested
- Civics
- —
Market trends
- HPI YoY
- ▼ -102.93%
- Current HPI
- 148.5749
- Rent YoY
- ▲ 1.42%
- Metro
- Dallas-Fort Worth-Arlington, TX
- State GDP YoY
- ▲ 3.95%
- F500 in state
- 110
Industry mix (Fortune 500 HQ in TX)
| Industry | F500 HQs | Revenue |
|---|---|---|
| Energy | 16 | $1,198B |
|
||
| Technology | 5 | $198B |
|
||
| Engineering / Construction | 4 | $72B |
|
||
| Energy Services | 3 | $60B |
|
||
| Utilities | 3 | $41B |
|
||
| Healthcare | 2 | $330B |
|
||
Cash-flow waterfall
monthlySold comps — $/sqft
last 12 mo · ≤1 miLoading sold comps…