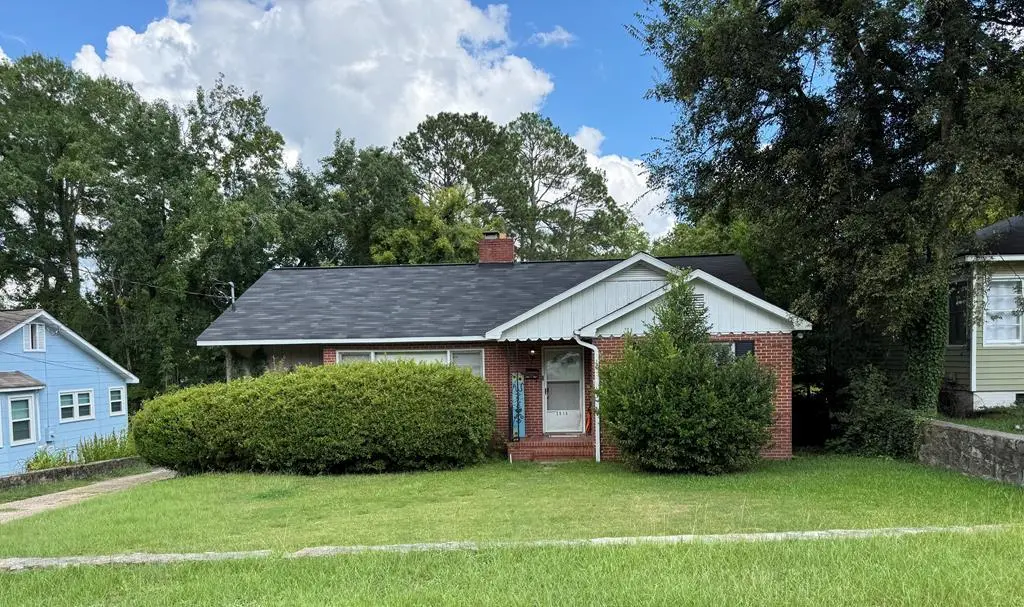
2916 Gardenia St · Columbus, GA
Flood risk 1/10 · Minimal
- FEMA flood zone
- X (unshaded)
- Chance of flooding over 30 yrs
- 0.0%
- Est. flood insurance / yr
- $473 – $860
Fire risk 1/10 · Minimal
- Est. fire insurance / yr
- $963 – $1,789
Heat risk 7/10 · Major
- Hot days now (above 107°F)
- 7 days/yr
- Hot days in 30 yrs
- 18 days/yr
Wind risk 6/10 · Moderate
- Chance of severe wind over 30 yrs
- 76.0%
Air-quality risk 4/10 · Minor
- Unhealthy air days now
- 5 days/yr
- Unhealthy air days in 30 yrs
- 6 days/yr
Risk factors via First Street. Map © Google.
Why this score? — see what drove the B grade
The composite is a weighted blend of 9 inputs, each scored 0–100. Each bar is that input's sub-score; the figure is the points it added to the 100-point composite (weight × sub-score).
- Cash flow +27.9/30.0
- ARV discount +15.0/15.0
- DSCR +9.9/10.0
- 1% rule +7.3/10.0
- Rent growth +3.7/5.0
- Livability +3.2/5.0
- Condition / age +2.5/5.0
- Schools +2.2/10.0
- Appreciation +0.0/10.0
$110,000
🖨 Deal sheet 📄 Offer letter ✓ Due diligence
Listing remarks MLS
Investor Opportunity! Please see property facts for more information. 3-houses portfolio to be sold together.
Key facts
- 8,276 sq ft lot
- Listed 307 days
Neighborhood map
What this means for you Summary
Snapshot
- This is a 3-bed/1.5-bath single-family listed at $110k.
Deal economics
- At list price, monthly cash flow is $339 ($4k/yr) — positive.
- The deal already cash-flows at list — no discount required.
- Meets the 1% rule at list price ($1k rent vs $110k).
- Recommended offer: $97k (12.0% below list) — sets the bar for market timing.
- Cap rate 10.0% vs local median 4.7% in Columbus — top-decile yield for the area; either an underpriced asset or a hidden risk that comps aren't pricing in. Stress-test before assuming the spread holds.
Location & tenants
- Location reads 64/100 on livability (#254 in GA) — a middle-class / working-renter tenant base. Strengths: cost of living A+, housing A+, health & safety B; Watch: amenities D+, schools F, crime F.
- Muscogee County (urban): math 21% / reading 30% proficiency, ranked #120 of 174 in GA (top 69%) — low school quality limits family demand, transient renter base, plan for 1-2y turnover; 61% free/reduced lunch — lower-income household profile, screen leases tightly.
- Market conditions: Rents rising fast (+4.8%/yr); 118 active listings in the ZIP; 15 comparable units currently listed for rent nearby; rentals at typical pace (median 21d on market — plan ~3-4 weeks tenant-placement turnaround); lower-income renter base — watch delinquency; 291 units permitted in Muscogee County in 2024 (30 in 5+ unit buildings).
- This rent runs 36% of the median local income ($45k/yr) — at the standard rent-burdened threshold; future hikes will face affordability resistance.
Forward outlook
- Local home prices are declining (-3.0%/yr); year-one equity from $761 of loan paydown is wiped out by about $3k of value loss. Plan a longer hold.
- Muscogee County population projected at +15% by 2050 — modest demand growth; plan on rents tracking national, not racing it.
- At projected returns (-3.0% appreciation + 4.8% rent growth), your $31k cash investment doubles in ~8 years — after that, you're playing with house money.
Negotiation context
- It's been on market 307 days — a 12% lower offer ($97k) is reasonable based on typical stale-listing flexibility.
- 2 sale attempts with the ask held roughly flat each time — persistent listings suggest the price (not the market) is what's stuck; bring a comps-based counter.
- Current owner paid $60k; list at $110k implies a 82% gain — meaningful room to come down on a strong offer.
Risks & watch-outs
- Watch-outs: built in 1953 — expect roof / HVAC / electrical / plumbing capex.
- Climate carrying-cost: major wind risk, 76% chance of damaging wind over 30y; extreme-heat days projected 7→18/yr by 2055 (HVAC capex compounding) — expect insurance premiums to compound above CPI over the hold.
Questions for the listing agent
- It's been on market 307 days. Have you received any prior offers? Is the seller open to a 12% concession, seller financing, or rate buy-down credit?
- Built in 1953 — when were the roof, HVAC, electrical panel, plumbing, and water heater last replaced?
- Why hasn't it sold? Are there any deal-killer items the seller is aware of (foundation, flood, title, zoning, code violations)?
- Is there a deadline driving the sale (1031 exchange, divorce, estate, relocation)? That informs how much negotiation room exists.
- Schools are F-rated, which usually means shorter tenancies and higher turnover. Who's the typical renter profile here, and what's been the actual vacancy rate?
- Crime grade is F in this area — have there been break-ins, vandalism, or insurance claims at this property in the last 3 years? What carrier currently insures it and at what premium?
- What's the average days-on-market for RENTAL listings here right now (not sales)? A rising rental-DOM trend means longer vacancies and softer asking-rent achievability than the comps imply.
- What's the recent tenant-quality profile in this submarket — average credit score on applications, eviction rate, late-payment / NSF rate, and stable-employment percentage? A property-management company in the area should have these aggregated.
- How much new for-sale + rental construction is in the pipeline within 1–3 miles? Heavy new supply typically softens prices + rents 12–24 months out; constrained supply supports both.
Investment metrics
- 1% rule
- 1.23% ✓
- Cap rate
- 9.99%
- Cash-on-cash
- 13.20%
- DSCR
- 1.59
- GRM
- 6.8
CMA / ARV
- ARV (median comp)
- $139,223
- List price
- $110,000
- Delta
- -20.99%
- Verdict
- UNDERPRICED
- Comps
- 20 within 1.0 mi
Show comp detail 12 sales within ~0.75 mi
| Address | Dist | Beds/Ba | Sqft | Sold | Price | $/sf | Match |
|---|---|---|---|---|---|---|---|
| 2917 Gardenia St | 0.03mi | 3/2.0 | 1,701 (-8%) | 3mo | $156,000 | $92 | 80 |
| 1532 Wells Dr | 0.16mi | 3/2.0 | 1,737 (-6%) | 1mo | $297,000 | $171 | 79 |
| 1916 Iris Dr | 0.40mi | 3/2.5 | 1,933 (+4%) | 1mo | $337,000 | $174 | 70 |
| 1700 N Dixon Dr | 0.36mi | 3/2.0 | 2,001 (+8%) | 0mo | $210,000 | $105 | 68 |
| 2904 Iris Ct | 0.17mi | 3/2.0 | 2,104 (+14%) | 2mo | $289,900 | $138 | 66 |
| 1534 Dixon Dr | 0.24mi | 3/2.0 | 1,631 (-12%) | 3mo | $289,900 | $178 | 64 |
| 2533 15th St | 0.27mi | 2/2.5 (-1) | 1,991 (+7%) | 5mo | $284,800 | $143 | 62 |
| 2940 Birchfield Dr | 0.65mi | 3/2.5 | 1,872 (+1%) | 6mo | $329,000 | $176 | 59 |
| 1903 Marilon Dr | 0.37mi | 3/2.0 | 1,658 (-11%) | 7mo | $232,400 | $140 | 57 |
| 1717 Stark Ave | 0.61mi | 3/2.5 | 1,974 (+6%) | 4mo | $435,000 | $220 | 54 |
| 2222 13th St | 0.62mi | 3/2.0 | 1,632 (-12%) | 2mo | $125,000 | $77 | 48 |
| 1615 Summit Dr | 0.73mi | 2/2.0 (-1) | 1,982 (+7%) | 1mo | $325,000 | $164 | 47 |
Match score weights: distance 35% · size 25% · config 20% · recency 20%. Top-matched comps best support the ARV.
Projected returns pro-forma
-3.0% appreciation · 4.82% rent growth · sell at horizon
- IRR
- 5.2%
- Equity multiple
- 1.20×
- Total profit
- $6,279
- Equity at exit
- $16,401
- IRR
- 16.2%
- Equity multiple
- 2.43×
- Total profit
- $44,024
- Equity at exit
- $9,511
Cash invested: $30,800 (down + closing). Projections, not guarantees.
Landlord ↔ Tenant lean methodology
- Overall (STATE)
- 90 Strongly Landlord-Friendly
- State Georgia
- 90 Strongly Landlord-Friendly · R+3
- County
- — inherits STATE
- City
- — inherits STATE
ZIP-level market 31906
- Rents YoY
- 4.8%
- Active inventory
- 118
- Price-to-rent
- 6.8×
Monthly cashflow live
- Estimated rent
- $1,356 high interval (Pro) →
- Mortgage (P&I)
- −$577
- Tax from tax record
- −$110 /mo · $1,315/yr
- Insurance
- −$46
- HOA
- −$0
- Vacancy / Maint / Mgmt
- −$285
- Net cashflow
- $339
Break-even live
UW: 25.0% down · 7.5% · 30yr · 1.5% tax · 5.0% vac · 8.0% maint · 8.0% mgmt
Financing live
Cash to close
- Down payment
- $27,500
- Closing costs
- $3,300
- Reserves months
- —
- Total cash needed
- —
Loan-product check · same deal, 3 products live
Conventional
25% down · 7.5% · 30yr
- Down + closing
- —
- Monthly P&I
- —
- Monthly cashflow
- —
- DSCR
- —
- Eligible?
- —
Personal DTI + credit; lowest rate.
DSCR
20% down · 8.5% · 30yr
- Down + closing
- —
- Monthly P&I
- —
- Monthly cashflow
- —
- DSCR
- —
- Eligible?
- —
No personal income docs; deal must DSCR.
Hard money
10% down · 12.0% · 12mo
- Down + closing
- —
- Monthly P&I
- —
- Monthly cashflow
- —
- DSCR
- —
- Eligible?
- —
Short-term bridge; refi at stabilization.
Rent comps 15 comps
| Address | Beds | Baths | Sqft | Rent | $/sqft | DOM | Units | Dist |
|---|---|---|---|---|---|---|---|---|
| 2834 Mimosa St Columbus, GA | 3.0 | 1.5 | 1257 | $1,100 | $0.88 | 43d | 1 | 0.12mi |
| 2750 Mimosa St Columbus, GA | 3.0 | 1.5 | 1357 | $1,250 | $0.92 | 13d | 1 | 0.19mi |
| 1521 Dixon Dr Columbus, GA | 2.0 | 2.0 | 1400 | $1,400 | $1.00 | 13d | 1 | 0.23mi |
| 1706 Wells Dr Columbus, GA | 3.0 | 2.0 | 1990 | $1,850 | $0.93 | 13d | 1 | 0.31mi |
| 1097 Bolton Ct Columbus, GA | 3.0 | 2.5 | 2127 | $1,350 | $0.63 | 20d | 1 | 0.47mi |
| 1400 Boxwood Blvd Columbus, GA | 2.0–3.0 | 2.0 | 1262 | $1,355 | $1.07 | 13d | 6 | 0.64mi |
| 2944 10th St Columbus, GA | 3.0 | 1.0 | 1550 | $925 | $0.60 | 13d | 1 | 0.71mi |
| 1111 Henry Ave Columbus, GA | 3.0 | 2.0 | 1407 | $1,200 | $0.85 | 43d | 1 | 0.71mi |
| 3500 Ruben St Columbus, GA | 4.0 | 3.0 | 2045 | $1,295 | $0.63 | 13d | 1 | 0.84mi |
| 1192 Munro Ave Columbus, GA | 3.0 | 2.0 | 1711 | $1,750 | $1.02 | 43d | 1 | 0.98mi |
| 2309 Willard St Columbus, GA | 3.0 | 2.0 | 1803 | $1,700 | $0.94 | 13d | 1 | 1.01mi |
| 1908 Garrard St Columbus, GA | 4.0 | 2.0 | 1716 | $1,600 | $0.93 | 20d | 1 | 1.06mi |
| 2525 Norris Rd #37 Columbus, GA | 3.0 | 2.5 | 2094 | $1,750 | $0.84 | 43d | 1 | 1.06mi |
| 564 Chesterfield Ave Columbus, GA | 3.0 | 2.0 | 1230 | $1,100 | $0.89 | 20d | 1 | 1.23mi |
| 3110 College Ave Columbus, GA | 4.0 | 1.5 | 1604 | $1,875 | $1.17 | 20d | 1 | 1.43mi |
Listing history 20 events
-
2026-06-18days on market $110,000 Active 307 DOM
-
2026-06-17days on market $110,000 Active 306 DOM
-
2026-06-16days on market $110,000 Active 305 DOM
-
2026-06-15days on market $110,000 Active 304 DOM
-
2026-06-14days on market $110,000 Active 302 DOM
-
2026-06-13days on market $110,000 Active 301 DOM
-
2026-06-10days on market $110,000 Active 299 DOM
-
2026-06-09days on market $110,000 Active 298 DOM
-
2026-06-08days on market $110,000 Active 297 DOM
-
2026-06-07days on market $110,000 Active 296 DOM
-
2026-06-05days on market $110,000 Active 293 DOM
-
2026-06-03days on market $110,000 Active 292 DOM
-
2026-06-02days on market $110,000 Active 291 DOM
-
2026-06-01days on market $110,000 Active 290 DOM
-
2026-05-31days on market $110,000 Active 289 DOM
-
2026-05-30days on market $110,000 Active 288 DOM
-
2026-02-16status Active 110-char remark
Show marketing remark (110 chars)
Investor Opportunity! Please see property facts for more information. 3-houses portfolio to be sold together.
-
2026-02-16historical 110-char remark
Show marketing remark (110 chars)
Investor Opportunity! Please see property facts for more information. 3-houses portfolio to be sold together.
-
2025-08-15$110,000 Active 110-char remark
Show marketing remark (110 chars)
Investor Opportunity! Please see property facts for more information. 3-houses portfolio to be sold together.
-
2010-08-20soldstatus $60,500
ⓘ Source: listings_history table (triggers on properties + properties_extension) + one-shot
backfill from property_details.listing_events for pre-trigger history.
Tax reassessment forecast GA · Resets to sale price
- Current annual tax
- $1,315 · $110/mo
- Projected year-2 tax
- $1,315 · $110/mo
- Expected delta
- $0/yr ($0/mo · 0.0%)
ⓘ Screening estimate from a state-policy table — verify with the county assessor before closing.
Climate risk First Street
- Flood 1/10 Low FEMA zone X (unshaded) · 0% chance over 30 yrs
- Wildfire 1/10 Low
- Heat 7/10 Severe 7 d/yr ≥107°F today · 18 d/yr by 30 yrs out
- Wind 6/10 Major 76% chance of damaging wind over 30 yrs
- Air quality 4/10 Moderate 5 unhealthy d/yr today · 6 by 30 yrs out
Nearby sold comps map
Loading sold comps map…
Walkable amenities ~0.75 mi
Loading nearby amenities…
Taxation est. · year 1
- Rental income
- $16,268
- − Mortgage interest
- −$6,162
- − Property taxes
- −$1,315
- − Insurance
- −$550
- − Repairs & maintenance
- −$1,301
- − Management
- −$1,301
- − Depreciation
- −$3,200
- Taxable income
- $2,438
- Est. tax owed @ 24.0%
- −$585
- After-tax cash flow
- $3,479/yr
For passive investors: Depreciation is non-cash, so a rental often shows a tax loss while cash-flowing — sheltering income. Rental losses are passive: they offset passive income freely, and up to $25,000/yr can offset ordinary (W-2) income if you actively participate and your MAGI is under $100k (phasing out to $0 by $150k); unused losses carry forward. On sale, claimed depreciation is recaptured at up to 25%, and gains may owe capital-gains tax (a 1031 exchange can defer both). Figures are a year-1 estimate at your 24.0% rate — not tax advice; consult a CPA.
Schools (NCES district)
- District
- Muscogee County
- NCES district ID
- 1303870
- Math proficiency
- 21% ▼ -11.00%
- Reading proficiency
- 30% ▼ -7.00%
- Median HH income
- $41,176
- Composite
- 21.6/100
- National rank
- #8297
- State rank
- #120 of 174 in GA
Livability — Columbus
- Score
- 64/100
- State rank
- #254
- US rank
- #14102
Category grades
Schools grade is shown separately in the Schools card above.
Census & demographics
- Census place
- Columbus, GA
- County
- Muscogee County · 180,764 people
- City population
- 180,764
- Metro
- Columbus, GA-AL
- Population (ZIP)
- 20,400
- Household income
- $44,965
- Rent vs Own
- Severe rent burden
- 1003.0
Population outlook (Muscogee County) Hauer SSP2
- Today (2025)
- 216,729 people
- By 2030
- 224,504 · +3.6%
- By 2040
- 238,318 · +10.0%
- By 2050
- 249,027 · +14.9%
- By 2075
- 264,862 · +22.2%
- By 2100
- 254,786 · +17.6%
Race, ethnicity, and origin ACS 2023
- Neighborhood character
- Majority Black (64%)
- Race & ethnicity
- Black 64% White 28% Hispanic / Latino 4% Two or more races 3% Asian 1%
- Common ancestry
- Slovak 1% Lithuanian 1% Hispanic 1%
- Foreign-born
- 3% · Canada
- Languages at home
- 95% English-only · Spanish 3% Other Indo-European 1%
Political lean MEDSL · Muscogee
- 2024 margin
- Strong D (+23.4) · D 61.4% · R 38.0%
- 2008→2024 swing
- +3.7pp toward D · 2008: 19.7pp · 2024: 23.4pp
- All cycles
- 2024: D+23.4 2020: D+24.0 2016: D+18.6 2012: D+21.3 2008: D+19.7
Not yet ingested
- Civics
- —
Market trends
- HPI YoY
- ▼ -122.49%
- Current HPI
- 113.2749
- Rent YoY
- ▲ 4.82%
- Metro
- Columbus, GA-AL
- State GDP YoY
- ▲ 2.66%
- F500 in state
- 28
Industry mix (Fortune 500 HQ in GA)
| Industry | F500 HQs | Revenue |
|---|---|---|
| Paper / Packaging | 2 | $29B |
|
||
| Retail | 1 | $160B |
|
||
| Transportation / Logistics | 1 | $91B |
|
||
| Airlines | 1 | $62B |
|
||
| Consumer Goods | 1 | $47B |
|
||
| Utilities | 1 | $25B |
|
||
Price history
+81.8% since first listed4 events — show timeline
- 2026-02-16 Relisted — CBOR
- 2026-02-16 Delisted — CBOR
- 2025-08-15 Listed $110,000 CBOR
- 2010-08-20 Sold (Public Records) $60,500 Public Records
Property tax history
+7.0%/yrLatest (2025): $1,315 · +0.0% YoY. Source: county tax records.
Cash-flow waterfall
monthlySold comps — $/sqft
last 12 mo · ≤1 miLoading sold comps…