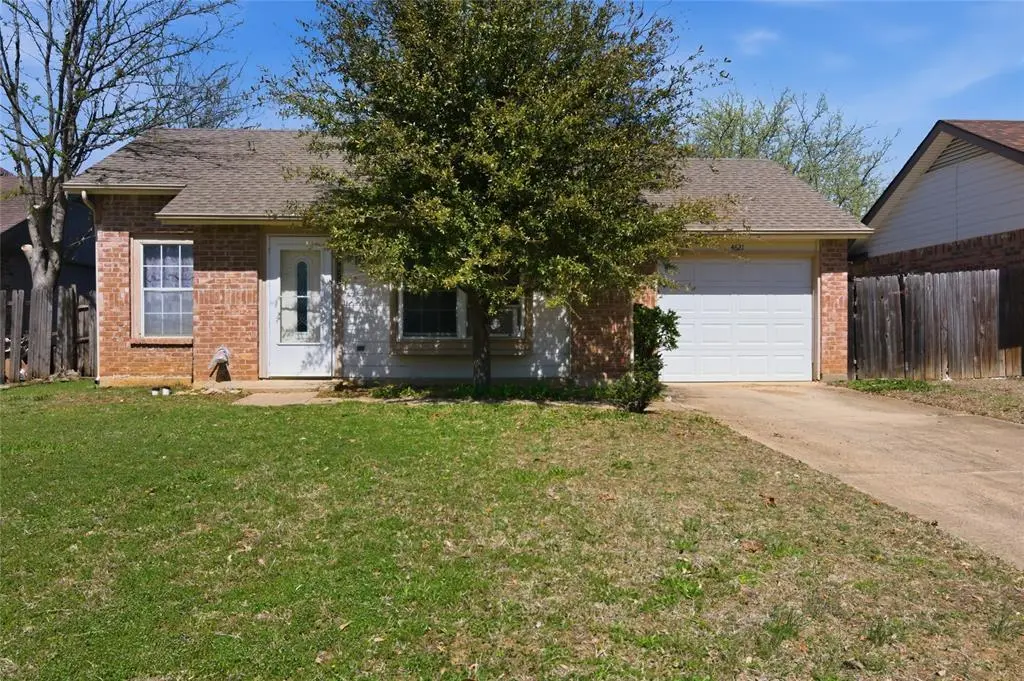
4621 Waterway Dr N · Fort Worth, TX
Flood risk 1/10 · Minimal
- FEMA flood zone
- X (unshaded)
- Chance of flooding over 30 yrs
- 0.0%
- Est. flood insurance / yr
- $507 – $1,088
Fire risk 3/10 · Minor
- Est. fire insurance / yr
- $1,222 – $2,270
Heat risk 8/10 · Major
- Hot days now (above 109°F)
- 7 days/yr
- Hot days in 30 yrs
- 24 days/yr
Wind risk 4/10 · Minor
- Chance of severe wind over 30 yrs
- 24.0%
Air-quality risk 4/10 · Minor
- Unhealthy air days now
- 4 days/yr
- Unhealthy air days in 30 yrs
- 5 days/yr
Risk factors via First Street. Map © Google.
Why this score? — see what drove the D grade
The composite is a weighted blend of 9 inputs, each scored 0–100. Each bar is that input's sub-score; the figure is the points it added to the 100-point composite (weight × sub-score).
- ARV discount +15.0/15.0
- Cash flow +8.0/30.0
- Schools +4.8/10.0
- Livability +4.0/5.0
- 1% rule +3.4/10.0
- Condition / age +2.5/5.0
- Rent growth +2.2/5.0
- DSCR +2.1/10.0
- Appreciation +0.0/10.0
$185,000
🖨 Deal sheet (PDF) 📄 Offer letter ✓ Due diligence
Listing remarks MLS
So much potential in this well laid out one story with 2 bedroom, 1 bath, open living - kitchen layout! One of the smallest homes in the neighborhood in desirable Keller ISD. Good resale vale at this price! Needs cosmetics, exterior siding in some areas and some fence repair. The HVAC is not functional at this time but have rough estimate for full replacement should it be required. Extra deep garage for storage. This is a great investment opportunity, potential flip or owner occupant to build equity quickly. Family's understanding is that the electrical panel has been upgraded, has newer garage door opener and newer water heater. PLEASE DO NOT ATTEMPT TO OPEN GARAGE DOOR WITH OPENER. Due to siding and fence repairs, will not go FHA-VA. Home is part of an estate. No sellers disclosure or survey.
Key facts
- 5,053 sq ft lot
- Garage
- Built 1984
Neighborhood map
What this means for you Summary
Snapshot
- This is a 2-bed/1.0-bath single-family listed at $185k.
Deal economics
- At list price, monthly cash flow is $-187 ($-2k/yr) — negative.
- To cash-flow at today's rent, offer at most $152k (17.9% below list).
- To meet the 1% rule (rent ≥ 1% of price), the offer needs to be $155k (16.0% below list).
- Recommended offer: $152k (17.9% below list) — sets the bar for cash-flow.
- Cap rate 5.1% vs local median 3.9% in Fort Worth — top-decile yield for the area; either an underpriced asset or a hidden risk that comps aren't pricing in. Stress-test before assuming the spread holds.
Location & tenants
- Location reads 80/100 on livability (#49 in TX, #1,954 nationally) — a professional / high-income tenant draw. Strengths: amenities A+, cost of living A+, housing A+; Watch: crime F.
- Keller ISD (urban): math 50% / reading 54% proficiency, ranked #91 of 826 in TX (top 11%) — acceptable for families but not a draw, mixed tenant base, ~2y average lease; only 19% free/reduced lunch — higher-income household profile.
- Zoned schools: Bluebonnet El (math 40% / reading 38%, grade F, #1,651 of 4,322 statewide, top 39%, 572 students, 47% FRL); Hillwood Middle (math 45% / reading 53%, grade C-, #378 of 1,662 statewide, top 23%, 1,228 students, 40% FRL); Fossil Ridge H S (math 41% / reading 55%, grade D, #571 of 1,632 statewide, top 36%, 2,329 students, 51% FRL) — zoned schools average 46% FRL vs 19% district-wide (27 pts higher); higher-poverty schools than district average — tighter screening recommended.
- Market conditions: Rents soft (-1.4%/yr); 212 active listings in the ZIP; 30 comparable units currently listed for rent nearby; rentals at typical pace (median 16d on market — plan ~3-4 weeks tenant-placement turnaround); solid renter incomes; 18,938 units permitted in Tarrant County in 2024 (8,336 in 5+ unit buildings).
Forward outlook
- Local home prices are declining (-3.0%/yr); year-one equity from $1k of loan paydown is wiped out by about $6k of value loss. Plan a longer hold.
- Tarrant County population projected at +41% by 2050 — long-run rental-demand tailwind backs the buy-and-hold thesis.
Negotiation context
- It's been on market 66 days — a 6% lower offer ($174k) is reasonable based on typical stale-listing flexibility.
- 2 sale attempts since 22y ago; this cycle's ask has dropped $10k (5%) from the opening price — seller is motivated, your offer sets the floor, not the list.
Risks & watch-outs
- Climate carrying-cost: extreme-heat days projected 7→24/yr by 2055 (HVAC capex compounding) — expect insurance premiums to compound above CPI over the hold.
Questions for the listing agent
- What do current leases actually rent for vs. the listed asking? Can we see a recent rent roll and the last 12 months of T-12 income?
- It's been on market 66 days. Have you received any prior offers? Is the seller open to a 18% concession, seller financing, or rate buy-down credit?
- Why hasn't it sold? Are there any deal-killer items the seller is aware of (foundation, flood, title, zoning, code violations)?
- Is there a deadline driving the sale (1031 exchange, divorce, estate, relocation)? That informs how much negotiation room exists.
- Schools are D-rated, which usually means shorter tenancies and higher turnover. Who's the typical renter profile here, and what's been the actual vacancy rate?
- Crime grade is F in this area — have there been break-ins, vandalism, or insurance claims at this property in the last 3 years? What carrier currently insures it and at what premium?
- The area grade is low — what's the realistic commute time and amenity access for the typical tenant pool here? Any planned neighborhood developments (good or bad) we should know about?
- What's the average days-on-market for RENTAL listings here right now (not sales)? A rising rental-DOM trend means longer vacancies and softer asking-rent achievability than the comps imply.
- What's the recent tenant-quality profile in this submarket — average credit score on applications, eviction rate, late-payment / NSF rate, and stable-employment percentage? A property-management company in the area should have these aggregated.
- How much new for-sale + rental construction is in the pipeline within 1–3 miles? Heavy new supply typically softens prices + rents 12–24 months out; constrained supply supports both.
Investment metrics
- 1% rule
- 0.84% ✗
- Cap rate
- 5.08%
- Cash-on-cash
- -4.34%
- DSCR
- 0.81
- GRM
- 9.9
CMA / ARV
- ARV (median comp)
- $229,244
- List price
- $185,000
- Delta
- -19.30%
- Verdict
- UNDERPRICED
- Comps
- 20 within 1.0 mi
Show comp detail 12 sales within ~0.75 mi
| Address | Dist | Beds/Ba | Sqft | Sold | Price | $/sf | Match |
|---|---|---|---|---|---|---|---|
| 4621 Waterway Dr N | 0.00mi | 2/1.0 | 942 (0%) | 0mo | $185,000 | $196 | 100 |
| 4710 Poppy Dr E | 0.62mi | 2/1.0 | 961 (+2%) | 1mo | $209,900 | $218 | 67 |
| 7005 Parkland Ct | 0.40mi | 2/1.0 | 1,022 (+8%) | 2mo | $215,000 | $210 | 66 |
| 4620 Baytree Dr | 0.08mi | 3/2.0 (+1) | 1,034 (+10%) | 8mo | $249,900 | $242 | 64 |
| 4677 Birchbend Ln | 0.14mi | 3/2.5 (+1) | 1,053 (+12%) | 0mo | $239,500 | $227 | 63 |
| 4752 Jasmine Dr | 0.34mi | 2/2.0 | 1,029 (+9%) | 3mo | $255,000 | $248 | 62 |
| 4849 Thistledown Dr | 0.71mi | 2/1.0 | 987 (+5%) | 3mo | $247,500 | $251 | 56 |
| 7340 Blackthorn Dr | 0.33mi | 2/2.0 | 1,054 (+12%) | 12mo | $240,000 | $228 | 51 |
| 7220 Blackthorn Dr | 0.39mi | 3/1.0 (+1) | 1,083 (+15%) | 4mo | $230,000 | $212 | 48 |
| 6908 Sunnybank Dr | 0.53mi | 3/2.0 (+1) | 1,052 (+12%) | 11mo | $229,900 | $219 | 38 |
| 4562 Wild Rose Ct | 0.52mi | 3/2.0 (+1) | 1,080 (+15%) | 10mo | $272,050 | $252 | 34 |
| 6737 Dandelion Dr | 0.70mi | 3/2.0 (+1) | 1,064 (+13%) | 11mo | $252,000 | $237 | 27 |
Match score weights: distance 35% · size 25% · config 20% · recency 20%. Top-matched comps best support the ARV.
Projected returns pro-forma
-3.0% appreciation · 0.0% rent growth · sell at horizon
- IRR
- -27.4%
- Equity multiple
- 0.11×
- Total profit
- $-46,357
- Equity at exit
- $27,584
- IRR
- -44.0%
- Equity multiple
- -0.41×
- Total profit
- $-72,900
- Equity at exit
- $15,995
Cash invested: $51,800 (down + closing). Projections, not guarantees.
Landlord ↔ Tenant lean methodology
- Overall (STATE)
- 87 Strongly Landlord-Friendly
- State Texas
- 87 Strongly Landlord-Friendly · R+5
- County
- — inherits STATE
- City
- — inherits STATE
ZIP-level market 76137
- Home prices YoY
- -28.8%
- Rents YoY
- -1.4%
- Active inventory
- 212
- Price-to-rent
- 9.9×
Monthly cashflow live
- Estimated rent
- $1,555 high interval (Pro) →
- Mortgage (P&I)
- −$970
- Tax from tax record
- −$368 /mo · $4,420/yr
- Insurance
- −$77
- HOA
- −$0
- Vacancy / Maint / Mgmt
- −$326
- Net cashflow
- $-187
Break-even live
Sensitivity live
| Price | -10% $-83 | -5% $-135 | +0% $-187 | +5% $-240 | +10% $-292 |
|---|---|---|---|---|---|
| Rent | -10% $-310 | -5% $-249 | +0% $-187 | +5% $-126 | +10% $-64 |
| Rate | -1.0pp $-94 | -0.5pp $-140 | base $-187 | +0.5pp $-235 | +1.0pp $-284 |
UW: 25.0% down · 7.5% · 30yr · 1.5% tax · 5.0% vac · 8.0% maint · 8.0% mgmt
Financing live
Cash to close
- Down payment
- $46,250
- Closing costs
- $5,550
- Reserves months
- —
- Total cash needed
- —
Loan-product check · same deal, 3 products live
Conventional
25% down · 7.5% · 30yr
- Down + closing
- —
- Monthly P&I
- —
- Monthly cashflow
- —
- DSCR
- —
- Eligible?
- —
Personal DTI + credit; lowest rate.
DSCR
20% down · 8.5% · 30yr
- Down + closing
- —
- Monthly P&I
- —
- Monthly cashflow
- —
- DSCR
- —
- Eligible?
- —
No personal income docs; deal must DSCR.
Hard money
10% down · 12.0% · 12mo
- Down + closing
- —
- Monthly P&I
- —
- Monthly cashflow
- —
- DSCR
- —
- Eligible?
- —
Short-term bridge; refi at stabilization.
Rent comps 30 comps
| Address | Beds | Baths | Sqft | Rent | $/sqft | DOM | Units | Dist |
|---|---|---|---|---|---|---|---|---|
| 7000 N Beach St Fort Worth, TX | 2.0 | 2.0 | 971 | $1,659 | $1.71 | 45d | 1 | 0.48mi |
| 7000 N Beach St Fort Worth, TX | 1.0 | 1.0 | 612 | $1,243 | $2.03 | 14d | 1 | 0.48mi |
| 7000 N Beach St Unit 7037 Fort Worth, TX | 2.0 | 2.0 | 1050 | $1,684 | $1.60 | 45d | 1 | 0.48mi |
| 7000 N Beach St Unit 7021 Fort Worth, TX | 1.0 | 1.0 | 612 | $1,279 | $2.09 | 15d | 1 | 0.48mi |
| 7000 N Beach St Unit 7057 Fort Worth, TX | 2.0 | 2.0 | 879 | $1,504 | $1.71 | 14d | 1 | 0.48mi |
| 7000 N Beach St Unit 7021 Fort Worth, TX | 1.0 | 1.0 | 612 | $1,243 | $2.03 | 0d | 1 | 0.48mi |
| 7000 N Beach St Unit 7037 Fort Worth, TX | 2.0 | 2.0 | 879 | $1,504 | $1.71 | 15d | 1 | 0.48mi |
| 7000 N Beach St Unit 7023 Fort Worth, TX | 2.0 | 2.0 | 1050 | $1,733 | $1.65 | 0d | 1 | 0.48mi |
| 4621 Rose of Sharon Ln Fort Worth, TX | 3.0 | 2.0 | 1118 | $1,800 | $1.61 | 19d | 1 | 0.49mi |
| 6960 N Beach St Fort Worth, TX | 1.0–3.0 | 1.0–2.0 | 908 | $1,529 | $1.68 | 1d | 29 | 0.61mi |
| 6901 N Beach St Fort Worth, TX | 1.0–3.0 | 1.0–2.0 | 855 | $1,380 | $1.61 | 45d | 1 | 0.69mi |
| 7204 Shadow Bend Dr Fort Worth, TX | 3.0 | 2.0 | 1013 | $1,650 | $1.63 | 15d | 1 | 0.84mi |
| 7204 Shadow Bend Dr Fort Worth, TX | 3.0 | 2.0 | 1013 | $1,940 | $1.92 | 45d | 1 | 0.84mi |
| 7009 Shadow Bend Dr Fort Worth, TX | 3.0 | 2.0 | 1044 | $1,900 | $1.82 | 16d | 1 | 0.86mi |
| 6713 Windwillow Dr Fort Worth, TX | 2.0 | 1.0 | 1009 | $1,850 | $1.83 | 13d | 1 | 0.87mi |
| 6701 Windwillow Dr Fort Worth, TX | 3.0 | 2.0 | 1007 | $1,695 | $1.68 | 26d | 1 | 0.90mi |
| 6701 Windwillow Dr Fort Worth, TX | 3.0 | 2.0 | 1007 | $1,695 | $1.68 | 20d | 1 | 0.90mi |
| 4740 Western Center Blvd Haltom City, TX | 2.0 | 2.0 | 1102 | $1,355 | $1.23 | 45d | 1 | 0.90mi |
| 3728 Flintwood Trl Fort Worth, TX | 2.0 | 1.0 | 1048 | $1,850 | $1.77 | 6d | 1 | 0.98mi |
| 3728 Staghorn Cir S Fort Worth, TX | 3.0 | 2.0 | 1104 | $1,700 | $1.54 | 5d | 1 | 1.01mi |
| 3600 Basswood Blvd Unit 3621 Fort Worth, TX | 1.0 | 1.0 | 637 | $1,249 | $1.96 | 45d | 1 | 1.11mi |
| 3600 Basswood Blvd Unit 3621 Fort Worth, TX | 1.0 | 1.0 | 757 | $1,266 | $1.67 | 0d | 1 | 1.11mi |
| 3600 Basswood Blvd Unit 3674 Fort Worth, TX | 1.0 | 1.0 | 637 | $1,184 | $1.86 | 15d | 1 | 1.11mi |
| 3600 Basswood Blvd Unit 3651 Fort Worth, TX | 1.0 | 1.0 | 637 | $1,179 | $1.85 | 14d | 1 | 1.11mi |
| 3600 Basswood Blvd Fort Worth, TX | 1.0 | 1.0 | 637 | $1,179 | $1.85 | 15d | 1 | 1.16mi |
| 6111 N Beach St Unit 6132 Fort Worth, TX | 1.0 | 1.0 | 698 | $1,259 | $1.80 | 15d | 1 | 1.19mi |
| 6111 N Beach St Unit 6126 Fort Worth, TX | 1.0 | 1.0 | 849 | $1,329 | $1.57 | 0d | 1 | 1.19mi |
| 6111 N Beach St Fort Worth, TX | 1.0 | 1.0 | 849 | $1,494 | $1.76 | 0d | 1 | 1.19mi |
| 6111 N Beach St Fort Worth, TX | 1.0 | 1.0 | 698 | $1,254 | $1.80 | 15d | 1 | 1.19mi |
| 6111 N Beach St Fort Worth, TX | 1.0 | 1.0 | 849 | $1,592 | $1.88 | 45d | 1 | 1.19mi |
Listing history 10 events
-
2026-05-18historical Active Option Contract 815-char remark
Show marketing remark (815 chars)
So much potential in this well laid out one story with 2 bedroom, 1 bath, open living - kitchen layout! One of the smallest homes in the neighborhood in desirable Keller ISD. Good resale vale at this price! Needs cosmetics, exterior siding in some areas and some fence repair. The HVAC is not functional at this time but have rough estimate for full replacement should it be required. Extra deep garage for storage. This is a great investment opportunity, potential flip or owner occupant to build equity quickly. Family's understanding is that the electrical panel has been upgraded, has newer garage door opener and newer water heater. PLEASE DO NOT ATTEMPT TO OPEN GARAGE DOOR WITH OPENER. Due to siding and fence repairs, will not go FHA-VA. Home is part of an estate. No sellers disclosure or survey.
-
2026-04-29price $185,000 815-char remark
Show marketing remark (815 chars)
So much potential in this well laid out one story with 2 bedroom, 1 bath, open living - kitchen layout! One of the smallest homes in the neighborhood in desirable Keller ISD. Good resale vale at this price! Needs cosmetics, exterior siding in some areas and some fence repair. The HVAC is not functional at this time but have rough estimate for full replacement should it be required. Extra deep garage for storage. This is a great investment opportunity, potential flip or owner occupant to build equity quickly. Family's understanding is that the electrical panel has been upgraded, has newer garage door opener and newer water heater. PLEASE DO NOT ATTEMPT TO OPEN GARAGE DOOR WITH OPENER. Due to siding and fence repairs, will not go FHA-VA. Home is part of an estate. No sellers disclosure or survey.
-
2026-04-13price $189,900 815-char remark
Show marketing remark (815 chars)
So much potential in this well laid out one story with 2 bedroom, 1 bath, open living - kitchen layout! One of the smallest homes in the neighborhood in desirable Keller ISD. Good resale vale at this price! Needs cosmetics, exterior siding in some areas and some fence repair. The HVAC is not functional at this time but have rough estimate for full replacement should it be required. Extra deep garage for storage. This is a great investment opportunity, potential flip or owner occupant to build equity quickly. Family's understanding is that the electrical panel has been upgraded, has newer garage door opener and newer water heater. PLEASE DO NOT ATTEMPT TO OPEN GARAGE DOOR WITH OPENER. Due to siding and fence repairs, will not go FHA-VA. Home is part of an estate. No sellers disclosure or survey.
-
2026-03-17$195,000 Active 815-char remark
Show marketing remark (815 chars)
So much potential in this well laid out one story with 2 bedroom, 1 bath, open living - kitchen layout! One of the smallest homes in the neighborhood in desirable Keller ISD. Good resale vale at this price! Needs cosmetics, exterior siding in some areas and some fence repair. The HVAC is not functional at this time but have rough estimate for full replacement should it be required. Extra deep garage for storage. This is a great investment opportunity, potential flip or owner occupant to build equity quickly. Family's understanding is that the electrical panel has been upgraded, has newer garage door opener and newer water heater. PLEASE DO NOT ATTEMPT TO OPEN GARAGE DOOR WITH OPENER. Due to siding and fence repairs, will not go FHA-VA. Home is part of an estate. No sellers disclosure or survey.
-
2004-06-23soldstatus
-
2004-04-01historical
-
2004-03-30$73,900
-
2000-05-24soldstatus
-
1990-10-15soldstatus
-
1990-01-02soldstatus
ⓘ Source: listings_history table (triggers on properties + properties_extension) + one-shot
backfill from property_details.listing_events for pre-trigger history.
Tax reassessment forecast TX · Resets to sale price
- Current annual tax
- $4,420 · $368/mo
- Projected year-2 tax
- $4,420 · $368/mo
- Expected delta
- $0/yr ($0/mo · 0.0%)
ⓘ Screening estimate from a state-policy table — verify with the county assessor before closing.
Climate risk First Street
- Flood 1/10 Low FEMA zone X (unshaded) · 0% chance over 30 yrs
- Wildfire 3/10 Moderate
- Heat 8/10 Severe 7 d/yr ≥109°F today · 24 d/yr by 30 yrs out
- Wind 4/10 Moderate 24% chance of damaging wind over 30 yrs
- Air quality 4/10 Moderate 4 unhealthy d/yr today · 5 by 30 yrs out
Nearby sold comps map
Loading sold comps map…
Walkable amenities ~0.75 mi
Loading nearby amenities…
Taxation est. · year 1
- Rental income
- $18,657
- − Mortgage interest
- −$10,363
- − Property taxes
- −$4,420
- − Insurance
- −$925
- − Repairs & maintenance
- −$1,493
- − Management
- −$1,493
- − Depreciation
- −$5,382
- Taxable loss
- −$5,418
- Est. tax savings @ 24.0%
- +$1,300
- After-tax cash flow
- $-948/yr
For passive investors: Depreciation is non-cash, so a rental often shows a tax loss while cash-flowing — sheltering income. Rental losses are passive: they offset passive income freely, and up to $25,000/yr can offset ordinary (W-2) income if you actively participate and your MAGI is under $100k (phasing out to $0 by $150k); unused losses carry forward. On sale, claimed depreciation is recaptured at up to 25%, and gains may owe capital-gains tax (a 1031 exchange can defer both). Figures are a year-1 estimate at your 24.0% rate — not tax advice; consult a CPA.
Schools (NCES district)
- District
- Keller ISD
- NCES district ID
- 4825260
- Math proficiency
- 50% ▼ -14.00%
- Reading proficiency
- 54% ▼ -9.00%
- Median HH income
- $92,106
- Composite
- 48.46/100
- National rank
- #2131
- State rank
- #91 of 826 in TX
Livability — Fort Worth
- Score
- 80/100
- State rank
- #49
- US rank
- #1954
Category grades
Schools grade is shown separately in the Schools card above.
Census & demographics
- Census place
- Fort Worth, TX
- County
- Tarrant County · 2,033,669 people
- City population
- 911,619
- Metro
- Dallas-Fort Worth-Arlington, TX
- Population (ZIP)
- 60,352
- Household income
- $90,718
- Rent vs Own
- Severe rent burden
- 1857.0
Population outlook (Tarrant County) Hauer SSP2
- Today (2025)
- 2,380,417 people
- By 2030
- 2,578,900 · +8.3%
- By 2040
- 2,974,995 · +25.0%
- By 2050
- 3,350,489 · +40.8%
- By 2075
- 4,216,909 · +77.2%
- By 2100
- 4,741,527 · +99.2%
Race, ethnicity, and origin ACS 2023
- Neighborhood character
- Highly diverse neighborhood (Simpson 0.70)
- Race & ethnicity
- White 46% Hispanic / Latino 24% Black 15% Two or more races 13% Asian 10%
- Hispanic origin (detail)
- Mexican 18% Puerto Rican 1%
- Common ancestry
- Italian 2% Lithuanian 1% Slovak 1%
- Foreign-born
- 16% · Canada, Vietnam, South Korea
- Languages at home
- 74% English-only · Spanish 15% Other Indo-European 4% Vietnamese 2%
Political lean MEDSL · Tarrant
- 2024 margin
- Lean R (+5.1) · D 46.7% · R 51.9% · Other 1.4%
- 2008→2024 swing
- +6.6pp toward D · 2008: -11.7pp · 2024: -5.1pp
- All cycles
- 2024: R+5.1 2020: D+0.2 2016: R+8.7 2012: R+15.7 2008: R+11.7
Not yet ingested
- Civics
- —
Market trends
- HPI YoY
- ▼ -108.62%
- Current HPI
- 268.8753
- Rent YoY
- ▼ -1.37%
- Metro
- Dallas-Fort Worth-Arlington, TX
- State GDP YoY
- ▲ 3.95%
- F500 in state
- 110
Industry mix (Fortune 500 HQ in TX)
| Industry | F500 HQs | Revenue |
|---|---|---|
| Energy | 16 | $1,198B |
|
||
| Technology | 5 | $198B |
|
||
| Engineering / Construction | 4 | $72B |
|
||
| Energy Services | 3 | $60B |
|
||
| Utilities | 3 | $41B |
|
||
| Healthcare | 2 | $330B |
|
||
Price history
+150.3% since first listed10 events — show timeline
- 2026-05-18 Contingent — NTREIS
- 2026-04-29 Price Changed $185,000 NTREIS
- 2026-04-13 Price Changed $189,900 NTREIS
- 2026-03-17 Listed $195,000 NTREIS
- 2004-06-23 Sold (Public Records) — Public Records
- 2004-04-01 Listing Removed — NTREIS
- 2004-03-30 Listed $73,900 NTREIS
- 2000-05-24 Sold (Public Records) — Public Records
- 1990-10-15 Sold (Public Records) — Public Records
- 1990-01-02 Sold (Public Records) — Public Records
Property tax history
+5.3%/yrLatest (2025): $4,420 · +9.0% YoY. Source: county tax records.
Cash-flow waterfall
monthlySold comps — $/sqft
last 12 mo · ≤1 miLoading sold comps…