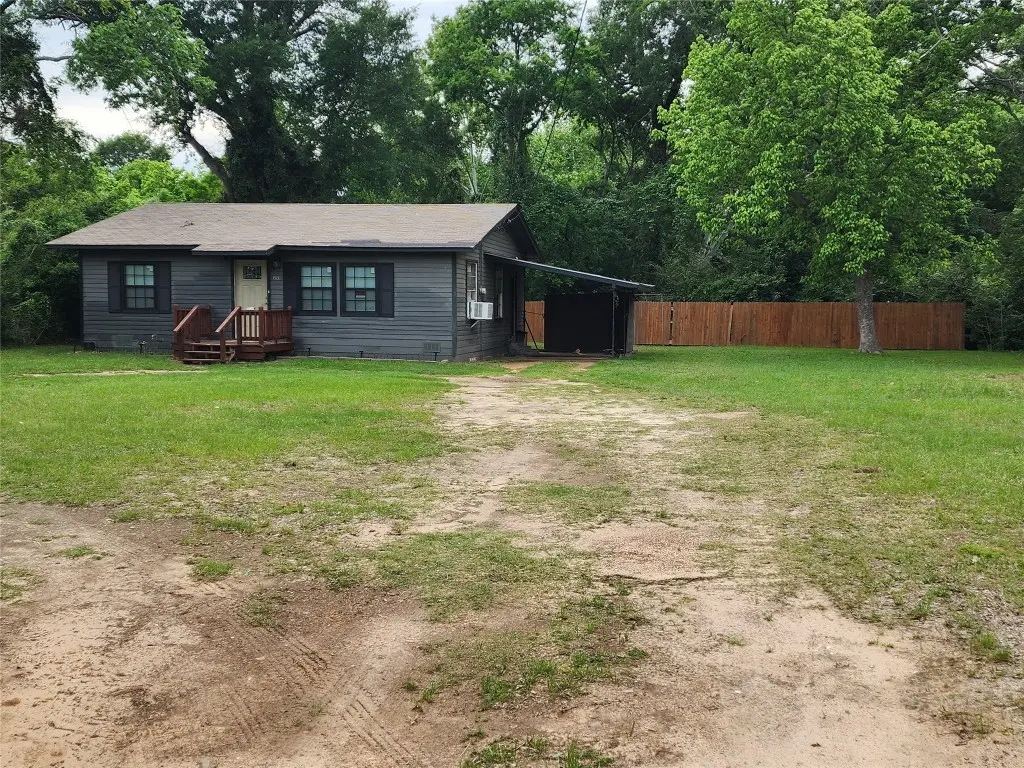
811 N Prairieville St · Athens, TX
Flood risk No data
- FEMA flood zone
- —
- Chance of flooding over 30 yrs
- —
- Est. flood insurance / yr
- —
Fire risk No data
- Est. fire insurance / yr
- —
Heat risk No data
- Hot days now (above threshold)
- —
- Hot days in 30 yrs
- —
Wind risk No data
- Chance of severe wind over 30 yrs
- —
Air-quality risk No data
- Unhealthy air days now
- —
- Unhealthy air days in 30 yrs
- —
Risk factors via First Street. Map © Google.
Why this score? — see what drove the B grade
The composite is a weighted blend of 9 inputs, each scored 0–100. Each bar is that input's sub-score; the figure is the points it added to the 100-point composite (weight × sub-score).
- Cash flow +30.0/30.0
- ARV discount +12.8/15.0
- 1% rule +10.0/10.0
- DSCR +10.0/10.0
- Livability +3.6/5.0
- Schools +2.9/10.0
- Rent growth +2.5/5.0
- Condition / age +2.5/5.0
- Appreciation +0.0/10.0
$75,000
🖨 Deal sheet 📄 Offer letter ✓ Due diligence
Listing remarks MLS
Discover the perfect blend of comfort and space with this charming property in Athens, TX! Situated on 1.38 acres, this inviting 3-bedroom, 1-bath home offers a peaceful setting with room to grow. Inside, you’ll find updated flooring that adds a fresh, modern touch, while the recently painted exterior enhances curb appeal and durability. The home comes move-in ready with a refrigerator, washer, and dryer included—making your transition seamless and convenient. Whether you're looking for a quiet retreat or a place with land to enjoy outdoor living, this property delivers both value and opportunity. Don’t miss your chance to own a slice of East Texas with space, updates, and essential appliances already in place!!
Key facts
- Dryer included
- 1.38 acres
- Updated flooring
Tags
Neighborhood map
What this means for you Summary
Snapshot
- This is a 3-bed/1.0-bath single-family listed at $75k.
Deal economics
- At list price, monthly cash flow is $451 ($5k/yr) — positive.
- The deal already cash-flows at list — no discount required.
- Meets the 1% rule at list price ($1k rent vs $75k).
- Cap rate 13.5% vs local median 2.5% in Athens — top-decile yield for the area; either an underpriced asset or a hidden risk that comps aren't pricing in. Stress-test before assuming the spread holds.
Location & tenants
- Location reads 72/100 on livability (#241 in TX) — a middle-class / working-renter tenant base. Strengths: cost of living A+, health & safety A+, housing A; Watch: crime D+, amenities F, commute F.
- Athens ISD (town): math 34% / reading 34% proficiency, ranked #548 of 826 in TX (top 66%) — families likely to look elsewhere, expect single-tenant / working-renter base with shorter leases; 62% free/reduced lunch — lower-income household profile, screen leases tightly.
- Zoned schools: South Athens El (math 33% / reading 32%, grade F, #2,234 of 4,322 statewide, top 52%, 449 students, 83% FRL); Athens Middle (math 35% / reading 33%, grade F, #892 of 1,662 statewide, top 55%, 682 students, 80% FRL); Athens H S (math 24% / reading 34%, grade F, #1,147 of 1,632 statewide, top 71%, 928 students, 75% FRL) — zoned schools average 80% FRL vs 62% district-wide (18 pts higher); higher-poverty schools than district average — tighter screening recommended.
- Market conditions: 188 active listings in the ZIP; 6 comparable units currently listed for rent nearby; rentals lingering (median 44d on market — plan ~5-8 weeks vacancy on turnover, expect pricing pressure); 50% of comp listings sitting > 30 days — soft ceiling on asking rent; 263 units permitted in Henderson County in 2024 (0 in 5+ unit buildings).
Forward outlook
- Local home prices are declining (-3.0%/yr); year-one equity from $519 of loan paydown is wiped out by about $2k of value loss. Plan a longer hold.
- At projected returns (-3.0% appreciation + 3.0% rent growth), your $21k cash investment doubles in ~5 years — after that, you're playing with house money.
Negotiation context
- Only 1 days on market — expect competitive offers; lowballing is unlikely to land.
- 2 sale attempts with the ask held roughly flat each time — persistent listings suggest the price (not the market) is what's stuck; bring a comps-based counter.
Risks & watch-outs
- Watch-outs: built in 1953 — expect roof / HVAC / electrical / plumbing capex.
Questions for the listing agent
- Built in 1953 — when were the roof, HVAC, electrical panel, plumbing, and water heater last replaced?
- Is there a deadline driving the sale (1031 exchange, divorce, estate, relocation)? That informs how much negotiation room exists.
- Schools are D-rated, which usually means shorter tenancies and higher turnover. Who's the typical renter profile here, and what's been the actual vacancy rate?
- Crime grade is D in this area — have there been break-ins, vandalism, or insurance claims at this property in the last 3 years? What carrier currently insures it and at what premium?
- What's the average days-on-market for RENTAL listings here right now (not sales)? A rising rental-DOM trend means longer vacancies and softer asking-rent achievability than the comps imply.
- What's the recent tenant-quality profile in this submarket — average credit score on applications, eviction rate, late-payment / NSF rate, and stable-employment percentage? A property-management company in the area should have these aggregated.
- How much new for-sale + rental construction is in the pipeline within 1–3 miles? Heavy new supply typically softens prices + rents 12–24 months out; constrained supply supports both.
Investment metrics
- 1% rule
- 1.65% ✓
- Cap rate
- 13.52%
- Cash-on-cash
- 25.80%
- DSCR
- 2.15
- GRM
- 5.1
CMA / ARV
- ARV (on-the-fly)
- $84,960
- Comps found
- 6
Show comp detail 6 sales within ~0.75 mi
| Address | Dist | Beds/Ba | Sqft | Sold | Price | $/sf | Match |
|---|---|---|---|---|---|---|---|
| 811 N Prairieville St | 0.00mi | 3/1.0 | 944 (0%) | 1mo | $75,000 | $79 | 100 |
| 306 Broadmore St | 0.18mi | 3/1.0 | 912 (-3%) | 15mo | $65,000 | $71 | 74 |
| 212 E Massey St | 0.37mi | 3/1.0 | 888 (-6%) | 20mo | $65,000 | $73 | 56 |
| 306 W Scott St | 0.45mi | 2/1.0 (-1) | 1,056 (+12%) | 2mo | $95,000 | $90 | 52 |
| 1013 S 3rd St | 0.33mi | 3/1.0 | 1,052 (+11%) | 22mo | $125,000 | $119 | 48 |
| 204 Barker St | 0.38mi | 3/2.0 | 1,056 (+12%) | 14mo | $175,000 | $166 | 47 |
Match score weights: distance 35% · size 25% · config 20% · recency 20%. Top-matched comps best support the ARV.
Projected returns pro-forma
-3.0% appreciation · 3.0% rent growth · sell at horizon
- IRR
- 19.5%
- Equity multiple
- 1.79×
- Total profit
- $16,625
- Equity at exit
- $11,183
- IRR
- 27.8%
- Equity multiple
- 3.46×
- Total profit
- $51,596
- Equity at exit
- $6,485
Cash invested: $21,000 (down + closing). Projections, not guarantees.
Landlord ↔ Tenant lean methodology
- Overall (STATE)
- 87 Strongly Landlord-Friendly
- State Texas
- 87 Strongly Landlord-Friendly · R+5
- County
- — inherits STATE
- City
- — inherits STATE
ZIP-level market 75751
- Home prices YoY
- -33.1%
- Active inventory
- 188
- Price-to-rent
- 5.1×
Monthly cashflow live
- Estimated rent
- $1,237 high interval (Pro) →
- Mortgage (P&I)
- −$393
- Tax from tax record
- −$101 /mo · $1,212/yr
- Insurance
- −$31
- HOA
- −$0
- Vacancy / Maint / Mgmt
- −$260
- Net cashflow
- $451
Break-even live
UW: 25.0% down · 7.5% · 30yr · 1.5% tax · 5.0% vac · 8.0% maint · 8.0% mgmt
Financing live
Cash to close
- Down payment
- $18,750
- Closing costs
- $2,250
- Reserves months
- —
- Total cash needed
- —
Loan-product check · same deal, 3 products live
Conventional
25% down · 7.5% · 30yr
- Down + closing
- —
- Monthly P&I
- —
- Monthly cashflow
- —
- DSCR
- —
- Eligible?
- —
Personal DTI + credit; lowest rate.
DSCR
20% down · 8.5% · 30yr
- Down + closing
- —
- Monthly P&I
- —
- Monthly cashflow
- —
- DSCR
- —
- Eligible?
- —
No personal income docs; deal must DSCR.
Hard money
10% down · 12.0% · 12mo
- Down + closing
- —
- Monthly P&I
- —
- Monthly cashflow
- —
- DSCR
- —
- Eligible?
- —
Short-term bridge; refi at stabilization.
Rent comps 6 comps
| Address | Beds | Baths | Sqft | Rent | $/sqft | DOM | Units | Dist |
|---|---|---|---|---|---|---|---|---|
| 207 W College St Unit 102 Athens, TX | 2.0 | 1.0 | 900 | $865 | $0.96 | 43d | 1 | 0.84mi |
| 625 York St Unit B Athens, TX | 2.0 | 1.0 | 700 | $795 | $1.14 | 43d | 1 | 0.90mi |
| 409 Royal St Apt 5 Athens, TX | 2.0 | 1.0 | 950 | $950 | $1.00 | 43d | 1 | 0.92mi |
| 401 S Carroll St Athens, TX | 2.0 | 1.0 | 780 | $1,020 | $1.31 | 20d | 12 | 0.93mi |
| 215 Wood St Athens, TX | 1.0–2.0 | 1.0–2.0 | 762 | $1,520 | $1.99 | 13d | 4 | 1.12mi |
| 900 E Corsicana St Athens, TX | 2.0 | 1.0–2.0 | 767 | $1,339 | $1.74 | 13d | 6 | 1.23mi |
Listing history 5 events
-
2026-04-21status Pending
Show marketing remark (739 chars)
Discover the perfect blend of comfort and space with this charming property in Athens, TX! Situated on 1.38 acres, this inviting 3-bedroom, 1-bath home offers a peaceful setting with room to grow. Inside, you’ll find updated flooring that adds a fresh, modern touch, while the recently painted exterior enhances curb appeal and durability. The home comes move-in ready with a refrigerator, washer, and dryer included—making your transition seamless and convenient. Whether you're looking for a quiet retreat or a place with land to enjoy outdoor living, this property delivers both value and opportunity. Don’t miss your chance to own a slice of East Texas with space, updates, and essential appliances already in place!!
-
2026-04-21status Pending 739-char remark
Show marketing remark (739 chars)
Discover the perfect blend of comfort and space with this charming property in Athens, TX! Situated on 1.38 acres, this inviting 3-bedroom, 1-bath home offers a peaceful setting with room to grow. Inside, you’ll find updated flooring that adds a fresh, modern touch, while the recently painted exterior enhances curb appeal and durability. The home comes move-in ready with a refrigerator, washer, and dryer included—making your transition seamless and convenient. Whether you're looking for a quiet retreat or a place with land to enjoy outdoor living, this property delivers both value and opportunity. Don’t miss your chance to own a slice of East Texas with space, updates, and essential appliances already in place!!
-
2026-04-20$75,000 Active
-
2026-04-18$75,000 Active 739-char remark
Show marketing remark (739 chars)
Discover the perfect blend of comfort and space with this charming property in Athens, TX! Situated on 1.38 acres, this inviting 3-bedroom, 1-bath home offers a peaceful setting with room to grow. Inside, you’ll find updated flooring that adds a fresh, modern touch, while the recently painted exterior enhances curb appeal and durability. The home comes move-in ready with a refrigerator, washer, and dryer included—making your transition seamless and convenient. Whether you're looking for a quiet retreat or a place with land to enjoy outdoor living, this property delivers both value and opportunity. Don’t miss your chance to own a slice of East Texas with space, updates, and essential appliances already in place!!
-
1986-02-01soldstatus
ⓘ Source: listings_history table (triggers on properties + properties_extension) + one-shot
backfill from property_details.listing_events for pre-trigger history.
Tax reassessment forecast TX · Resets to sale price
- Current annual tax
- $1,212 · $101/mo
- Projected year-2 tax
- $1,372 · $114/mo
- Expected delta
- +$161/yr (+$13/mo · 13.3%)
ⓘ Screening estimate from a state-policy table — verify with the county assessor before closing.
Nearby sold comps map
Loading sold comps map…
Walkable amenities ~0.75 mi
Loading nearby amenities…
Taxation est. · year 1
- Rental income
- $14,841
- − Mortgage interest
- −$4,201
- − Property taxes
- −$1,212
- − Insurance
- −$375
- − Repairs & maintenance
- −$1,187
- − Management
- −$1,187
- − Depreciation
- −$2,182
- Taxable income
- $4,496
- Est. tax owed @ 24.0%
- −$1,079
- After-tax cash flow
- $4,339/yr
For passive investors: Depreciation is non-cash, so a rental often shows a tax loss while cash-flowing — sheltering income. Rental losses are passive: they offset passive income freely, and up to $25,000/yr can offset ordinary (W-2) income if you actively participate and your MAGI is under $100k (phasing out to $0 by $150k); unused losses carry forward. On sale, claimed depreciation is recaptured at up to 25%, and gains may owe capital-gains tax (a 1031 exchange can defer both). Figures are a year-1 estimate at your 24.0% rate — not tax advice; consult a CPA.
Schools (NCES district)
- District
- Athens ISD
- NCES district ID
- 4808870
- Math proficiency
- 34% ▼ -9.00%
- Reading proficiency
- 34% ▼ -4.00%
- Median HH income
- $41,617
- Composite
- 28.73/100
- National rank
- #6680
- State rank
- #548 of 826 in TX
Livability — Athens
- Score
- 72/100
- State rank
- #241
- US rank
- #5796
Category grades
Schools grade is shown separately in the Schools card above.
Census & demographics
- Census place
- Athens, TX
- County
- Henderson County · 34,977 people
- City population
- 18,644
- Metro
- Athens, TX
- Population (ZIP)
- 18,644
- Household income
- $70,620
- Rent vs Own
- Severe rent burden
- 535.0
Population outlook (Henderson County) Hauer SSP2
- Today (2025)
- 80,471 people
- By 2030
- 80,608 · +0.2%
- By 2040
- 80,087 · -0.5%
- By 2050
- 78,208 · -2.8%
- By 2075
- 72,423 · -10.0%
- By 2100
- 61,012 · -24.2%
Race, ethnicity, and origin ACS 2023
- Neighborhood character
- Diverse neighborhood (Simpson 0.56)
- Race & ethnicity
- White 60% Hispanic / Latino 24% Two or more races 18% Black 10% Asian 2%
- Hispanic origin (detail)
- Mexican 22%
- Common ancestry
- Slovak 2% Romanian 1% Italian 1%
- Foreign-born
- 8% · Canada
- Languages at home
- 79% English-only · Spanish 19% Other Asian/Pacific 1%
Political lean MEDSL · Henderson
- 2024 margin
- Solid R (+63.5) · D 18.0% · R 81.4%
- 2008→2024 swing
- -18.8pp toward R · 2008: -44.6pp · 2024: -63.5pp
- All cycles
- 2024: R+63.5 2020: R+60.2 2016: R+60.0 2012: R+54.8 2008: R+44.6
Not yet ingested
- Civics
- —
Market trends
- HPI YoY
- ▼ -95.19%
- Current HPI
- 192.3973
- Rent YoY
- —
- Metro
- Athens, TX
- State GDP YoY
- ▲ 3.95%
- F500 in state
- 110
Industry mix (Fortune 500 HQ in TX)
| Industry | F500 HQs | Revenue |
|---|---|---|
| Energy | 16 | $1,198B |
|
||
| Technology | 5 | $198B |
|
||
| Engineering / Construction | 4 | $72B |
|
||
| Energy Services | 3 | $60B |
|
||
| Utilities | 3 | $41B |
|
||
| Healthcare | 2 | $330B |
|
||
Price history
+0.0% since first listed5 events — show timeline
- 2026-04-21 Pending — HARMLS
- 2026-04-21 Pending — GTAR
- 2026-04-20 Listed $75,000 HARMLS
- 2026-04-18 Listed $75,000 GTAR
- 1986-02-01 Sold (Public Records) — Public Records
Property tax history
+6.3%/yrLatest (2025): $1,212 · +20.3% YoY. Source: county tax records.
Cash-flow waterfall
monthlySold comps — $/sqft
last 12 mo · ≤1 miLoading sold comps…