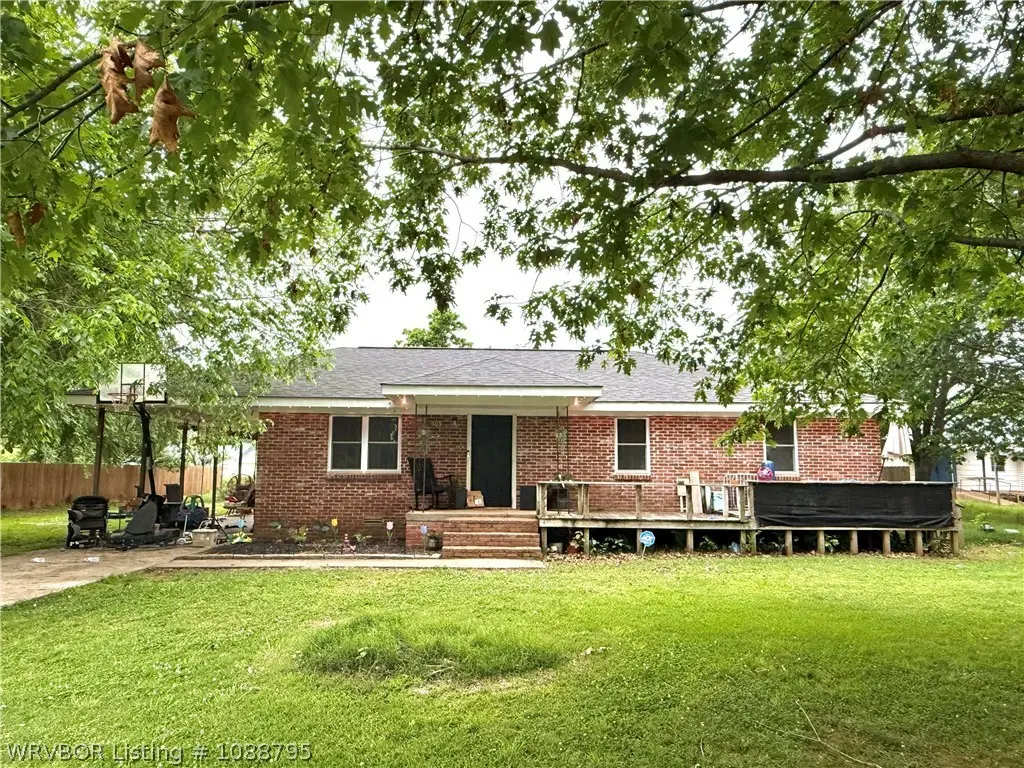
303 Central St · Wister, OK
Flood risk 1/10 · Minimal
- FEMA flood zone
- X (unshaded)
- Chance of flooding over 30 yrs
- 0.0%
- Est. flood insurance / yr
- $507 – $1,088
Fire risk 7/10 · Major
- Est. fire insurance / yr
- $2,463 – $4,575
Heat risk 6/10 · Moderate
- Hot days now (above 114°F)
- 7 days/yr
- Hot days in 30 yrs
- 21 days/yr
Wind risk 3/10 · Minor
- Chance of severe wind over 30 yrs
- 6.0%
Air-quality risk 1/10 · Minimal
- Unhealthy air days now
- 0 days/yr
- Unhealthy air days in 30 yrs
- 0 days/yr
Risk factors via First Street. Map © Google.
Why this score? — see what drove the D+ grade
The composite is a weighted blend of 9 inputs, each scored 0–100. Each bar is that input's sub-score; the figure is the points it added to the 100-point composite (weight × sub-score).
- Cash flow +11.8/30.0
- ARV discount +10.1/15.0
- Appreciation +8.7/10.0
- DSCR +3.5/10.0
- Livability +3.1/5.0
- Rent growth +2.5/5.0
- Condition / age +2.5/5.0
- 1% rule +2.4/10.0
- Schools +1.1/10.0
$149,900
🖨 Deal sheet (PDF) 📄 Offer letter ✓ Due diligence
Listing remarks MLS
Charming 3 bedroom, 2 bath brick home with NEW roof and Fresh exterior paint. Front deck to enjoy the evenings and attached carport for parking. Additional RV Covered Carport and 16'x24' hobby workshop with electric. A two car covered parking is attached to the workshop for vehicles or boats. Additional storage building on the property. Just minutes away from Wister Lake.
Key facts
- Front patio
- Attached carport
- Covered rv parking
Tags
Property features AI
Exterior
- Parking: 2 covered parking spaces; Carport; Gravel and concrete driveway
- Security: Smoke detector(s)
- Utilities: Public water; Public sewer; Natural gas available; Water available; Sewer available
- Home design: Single-family residence; One level; Single-story house; Brick construction
- Construction: Brick construction; Shingle roof
- Exterior features: Patio; Back yard fencing; Above-ground pool; Outbuilding; Level lot; Publicly maintained road
Interior
- Kitchen: Dishwasher; Oven; Refrigerator
- Flooring: Carpet; Laminate
- Bathrooms: 2 full bathrooms
- Heating & cooling: Central heating; Central air; Ceiling fan(s)
- Interior features: Ceiling fan(s); Smoke detector(s)
- Laundry & utility: Electric dryer hookup; Gas water heater
Neighborhood map
What this means for you Summary
Snapshot
- This is a 3-bed/2.0-bath single-family listed at $150k.
Deal economics
- At list price, monthly cash flow is $-40 ($-478/yr) — negative.
- To cash-flow at today's rent, offer at most $143k (4.7% below list).
- To meet the 1% rule (rent ≥ 1% of price), the offer needs to be $111k (25.6% below list).
- Recommended offer: $111k (25.6% below list) — sets the bar for 1% rule.
Location & tenants
- Location reads 61/100 on livability (#320 in OK) — a middle-class / working-renter tenant base. Strengths: cost of living A+, housing A+, crime B+; Watch: amenities F, commute F, employment F.
- Wister (rural): math 12% / reading 15% proficiency, ranked #240 of 270 in OK (top 89%) — low school quality limits family demand, transient renter base, plan for 1-2y turnover; 66% free/reduced lunch — lower-income household profile, screen leases tightly.
- Zoned schools: Wister Es (math 12% / reading 12%, grade F, #667 of 845 statewide, top 82%, 335 students, 0% FRL); Wister Hs (math 5% / reading 24%, grade F, #332 of 447 statewide, top 78%, 167 students, 0% FRL) — zoned schools average 0% FRL vs 66% district-wide (66 pts lower); this property's tenant base skews higher-income than the district average.
- Market conditions: 53 active listings in the ZIP; 73 units permitted in Le Flore County in 2024 (0 in 5+ unit buildings).
Forward outlook
- In year one you build about $12k of equity ($1k loan paydown + $11k appreciation (7.5% local appreciation)).
- Le Flore County population projected at -13% by 2050 — secular population decline; favor cash flow + early exit over multi-decade hold.
- At projected returns (7.5% appreciation + 3.0% rent growth), your $42k cash investment doubles in ~4 years — after that, you're playing with house money.
- By year 3, paydown + projected appreciation supports a ~$30k cash-out refi (75% LTV) — recoverable capital for the next deal without selling this one.
Negotiation context
- It's been on market 40 days — a 3% lower offer ($145k) is reasonable based on typical stale-listing flexibility.
- 3 sale attempts since 9y ago with the ask held roughly flat each time — persistent listings suggest the price (not the market) is what's stuck; bring a comps-based counter.
- Current owner paid $129k; 16% above their basis — modest negotiation headroom, anchor on the comps not their cost.
Risks & watch-outs
- Climate carrying-cost: major wildfire risk; extreme-heat days projected 7→21/yr by 2055 (HVAC capex compounding) — expect insurance premiums to compound above CPI over the hold.
Questions for the listing agent
- What do current leases actually rent for vs. the listed asking? Can we see a recent rent roll and the last 12 months of T-12 income?
- It's been on market 40 days. Have you received any prior offers? Is the seller open to a 26% concession, seller financing, or rate buy-down credit?
- Is there a deadline driving the sale (1031 exchange, divorce, estate, relocation)? That informs how much negotiation room exists.
- Schools are F-rated, which usually means shorter tenancies and higher turnover. Who's the typical renter profile here, and what's been the actual vacancy rate?
- The area grade is low — what's the realistic commute time and amenity access for the typical tenant pool here? Any planned neighborhood developments (good or bad) we should know about?
- What's the average days-on-market for RENTAL listings here right now (not sales)? A rising rental-DOM trend means longer vacancies and softer asking-rent achievability than the comps imply.
- What's the recent tenant-quality profile in this submarket — average credit score on applications, eviction rate, late-payment / NSF rate, and stable-employment percentage? A property-management company in the area should have these aggregated.
- How much new for-sale + rental construction is in the pipeline within 1–3 miles? Heavy new supply typically softens prices + rents 12–24 months out; constrained supply supports both.
Investment metrics
- 1% rule
- 0.74% ✗
- Cap rate
- 5.97%
- Cash-on-cash
- -1.14%
- DSCR
- 0.95
- GRM
- 11.2
CMA / ARV
- ARV (on-the-fly)
- $159,210
- Comps found
- 5
Show comp detail 5 sales within ~0.75 mi
| Address | Dist | Beds/Ba | Sqft | Sold | Price | $/sf | Match |
|---|---|---|---|---|---|---|---|
| 401 Mcpherson Ave | 0.67mi | 3/2.0 | 1,356 (+4%) | 12mo | $165,000 | $122 | 52 |
| 206 Logan St | 0.48mi | 3/1.0 | 1,144 (-12%) | 6mo | $142,000 | $124 | 48 |
| 305 Chickasaw Ave | 0.38mi | 3/1.5 | 1,176 (-10%) | 24mo | $60,000 | $51 | 44 |
| 104 Myers | 0.53mi | 3/2.0 | 1,468 (+12%) | 13mo | $85,000 | $58 | 43 |
| 502 Wiggington | 0.69mi | 2/1.0 (-1) | 1,149 (-12%) | 3mo | $155,000 | $135 | 36 |
Match score weights: distance 35% · size 25% · config 20% · recency 20%. Top-matched comps best support the ARV.
Projected returns pro-forma
7.45% appreciation · 3.0% rent growth · sell at horizon
- IRR
- 17.9%
- Equity multiple
- 2.29×
- Total profit
- $53,939
- Equity at exit
- $108,331
- IRR
- 17.0%
- Equity multiple
- 4.77×
- Total profit
- $158,269
- Equity at exit
- $209,947
Cash invested: $41,972 (down + closing). Projections, not guarantees.
Landlord ↔ Tenant lean methodology
- Overall (STATE)
- 83 Strongly Landlord-Friendly
- State Oklahoma
- 83 Strongly Landlord-Friendly · R+20
- County
- — inherits STATE
- City
- — inherits STATE
ZIP-level market 74966
- Home prices YoY
- 2.5%
- Active inventory
- 53
- Price-to-rent
- 11.2×
Monthly cashflow live
- Estimated rent
- $1,115 medium interval (Pro) →
- Mortgage (P&I)
- −$786
- Tax from tax record
- −$72 /mo · $862/yr
- Insurance
- −$62
- HOA
- −$0
- Vacancy / Maint / Mgmt
- −$234
- Net cashflow
- $-40
Break-even live
Sensitivity live
| Price | -10% $45 | -5% $3 | +0% $-40 | +5% $-82 | +10% $-125 |
|---|---|---|---|---|---|
| Rent | -10% $-128 | -5% $-84 | +0% $-40 | +5% $4 | +10% $48 |
| Rate | -1.0pp $36 | -0.5pp $-2 | base $-40 | +0.5pp $-79 | +1.0pp $-118 |
UW: 25.0% down · 7.5% · 30yr · 1.5% tax · 5.0% vac · 8.0% maint · 8.0% mgmt
Financing live
Cash to close
- Down payment
- $37,475
- Closing costs
- $4,497
- Reserves months
- —
- Total cash needed
- —
Loan-product check · same deal, 3 products live
Conventional
25% down · 7.5% · 30yr
- Down + closing
- —
- Monthly P&I
- —
- Monthly cashflow
- —
- DSCR
- —
- Eligible?
- —
Personal DTI + credit; lowest rate.
DSCR
20% down · 8.5% · 30yr
- Down + closing
- —
- Monthly P&I
- —
- Monthly cashflow
- —
- DSCR
- —
- Eligible?
- —
No personal income docs; deal must DSCR.
Hard money
10% down · 12.0% · 12mo
- Down + closing
- —
- Monthly P&I
- —
- Monthly cashflow
- —
- DSCR
- —
- Eligible?
- —
Short-term bridge; refi at stabilization.
Listing history 23 events
-
2026-06-21days on market $149,900 Active 40 DOM
-
2026-06-21days on market $149,900 Active 39 DOM
-
2026-06-18days on market $149,900 Active 37 DOM
-
2026-06-17days on market $149,900 Active 36 DOM
-
2026-06-16days on market $149,900 Active 35 DOM
-
2026-06-15days on market $149,900 Active 34 DOM
-
2026-06-13days on market $149,900 Active 32 DOM
-
2026-06-12days on market $149,900 Active 31 DOM
-
2026-06-09pricedays on market $149,900 Active 28 DOM
-
2026-06-08days on market $154,900 Active 27 DOM
-
2026-06-08days on market $154,900 Active 26 DOM
-
2026-06-07days on market $154,900 Active 25 DOM
-
2026-06-04days on market $154,900 Active 22 DOM
-
2026-06-02days on market $154,900 Active 21 DOM
-
2026-06-01days on market $154,900 Active 20 DOM
-
2026-05-31days on market $154,900 Active 19 DOM
-
2026-05-12$154,900 Active
-
2022-10-25soldstatus $129,000 374-char remark
Show marketing remark (374 chars)
Charming 3 bedroom, 2 bath brick home with NEW roof and Fresh exterior paint. Front deck to enjoy the evenings and attached carport for parking. Additional RV Covered Carport and 16'x24' hobby workshop with electric. A two car covered parking is attached to the workshop for vehicles or boats. Additional storage building on the property. Just minutes away from Wister Lake.
-
2022-10-25soldstatus $129,000
Show marketing remark (374 chars)
Charming 3 bedroom, 2 bath brick home with NEW roof and Fresh exterior paint. Front deck to enjoy the evenings and attached carport for parking. Additional RV Covered Carport and 16'x24' hobby workshop with electric. A two car covered parking is attached to the workshop for vehicles or boats. Additional storage building on the property. Just minutes away from Wister Lake.
-
2022-04-16$125,000 374-char remark
Show marketing remark (374 chars)
Charming 3 bedroom, 2 bath brick home with NEW roof and Fresh exterior paint. Front deck to enjoy the evenings and attached carport for parking. Additional RV Covered Carport and 16'x24' hobby workshop with electric. A two car covered parking is attached to the workshop for vehicles or boats. Additional storage building on the property. Just minutes away from Wister Lake.
-
2018-05-21historical
-
2017-12-21$79,000
-
1996-06-12soldstatus $36,000
ⓘ Source: listings_history table (triggers on properties + properties_extension) + one-shot
backfill from property_details.listing_events for pre-trigger history.
Tax reassessment forecast OK · Resets to sale price
- Current annual tax
- $862 · $72/mo
- Projected year-2 tax
- $1,349 · $112/mo
- Expected delta
- +$487/yr (+$41/mo · 56.5%)
ⓘ Screening estimate from a state-policy table — verify with the county assessor before closing.
Climate risk First Street
- Flood 1/10 Low FEMA zone X (unshaded) · 0% chance over 30 yrs
- Wildfire 7/10 Severe
- Heat 6/10 Major 7 d/yr ≥114°F today · 21 d/yr by 30 yrs out
- Wind 3/10 Moderate 6% chance of damaging wind over 30 yrs
- Air quality 1/10 Low 0 unhealthy d/yr today · 0 by 30 yrs out
Nearby sold comps map
Loading sold comps map…
Walkable amenities ~0.75 mi
Loading nearby amenities…
Taxation est. · year 1
- Rental income
- $13,375
- − Mortgage interest
- −$8,397
- − Property taxes
- −$862
- − Insurance
- −$750
- − Repairs & maintenance
- −$1,070
- − Management
- −$1,070
- − Depreciation
- −$4,361
- Taxable loss
- −$3,134
- Est. tax savings @ 24.0%
- +$752
- After-tax cash flow
- $274/yr
For passive investors: Depreciation is non-cash, so a rental often shows a tax loss while cash-flowing — sheltering income. Rental losses are passive: they offset passive income freely, and up to $25,000/yr can offset ordinary (W-2) income if you actively participate and your MAGI is under $100k (phasing out to $0 by $150k); unused losses carry forward. On sale, claimed depreciation is recaptured at up to 25%, and gains may owe capital-gains tax (a 1031 exchange can defer both). Figures are a year-1 estimate at your 24.0% rate — not tax advice; consult a CPA.
Schools (NCES district)
- District
- Wister
- NCES district ID
- 4032970
- Math proficiency
- 12% ▼ -3.00%
- Reading proficiency
- 15% ▼ -5.00%
- Median HH income
- $35,564
- Composite
- 11.14/100
- National rank
- #9729
- State rank
- #240 of 270 in OK
Livability — Wister
- Score
- 61/100
- State rank
- #320
- US rank
- #18277
Category grades
Schools grade is shown separately in the Schools card above.
Census & demographics
- Census place
- Wister, OK
- Population (ZIP)
- 3,540
Population outlook (Le Flore County) Hauer SSP2
- Today (2025)
- 48,504 people
- By 2030
- 47,474 · -2.1%
- By 2040
- 44,914 · -7.4%
- By 2050
- 42,239 · -12.9%
- By 2075
- 35,071 · -27.7%
- By 2100
- 25,949 · -46.5%
Race, ethnicity, and origin ACS 2023
- Neighborhood character
- Predominantly White (72%)
- Race & ethnicity
- White 72% Native American 13% Two or more races 12% Hispanic / Latino 3%
- Common ancestry
- Serbian 3% Slovak 2% Italian 1%
- Foreign-born
- 1% · Canada
- Languages at home
- 98% English-only · Spanish 1%
Political lean MEDSL · Le Flore
- 2024 margin
- Solid R (+64.8) · D 17.0% · R 81.8% · Other 1.3%
- 2008→2024 swing
- -26.1pp toward R · 2008: -38.6pp · 2024: -64.8pp
- All cycles
- 2024: R+64.8 2020: R+63.4 2016: R+58.7 2012: R+41.1 2008: R+38.6
Not yet ingested
- Civics
- —
Market trends
- HPI YoY
- ▲ 7.45%
- Current HPI
- 301.2538
- Rent YoY
- —
- Metro
- —
- State GDP YoY
- ▲ 1.55%
- F500 in state
- 6
Industry mix (Fortune 500 HQ in OK)
| Industry | F500 HQs | Revenue |
|---|---|---|
| Energy | 3 | $48B |
|
||
Price history
+330.3% since first listed7 events — show timeline
- 2026-05-12 Listed $154,900 WRVBOR
- 2022-10-25 Sold (Public Records) $129,000 Public Records
- 2022-10-25 Sold (MLS) $129,000 WRVBOR
- 2022-04-16 Listed $125,000 WRVBOR
- 2018-05-21 Listing Removed — MLS Technology, Inc.
- 2017-12-21 Listed $79,000 MLS Technology, Inc.
- 1996-06-12 Sold (Public Records) $36,000 Public Records
Property tax history
+7.6%/yrLatest (2025): $862 · -8.1% YoY. Source: county tax records.
Cash-flow waterfall
monthlySold comps — $/sqft
last 12 mo · ≤1 miLoading sold comps…