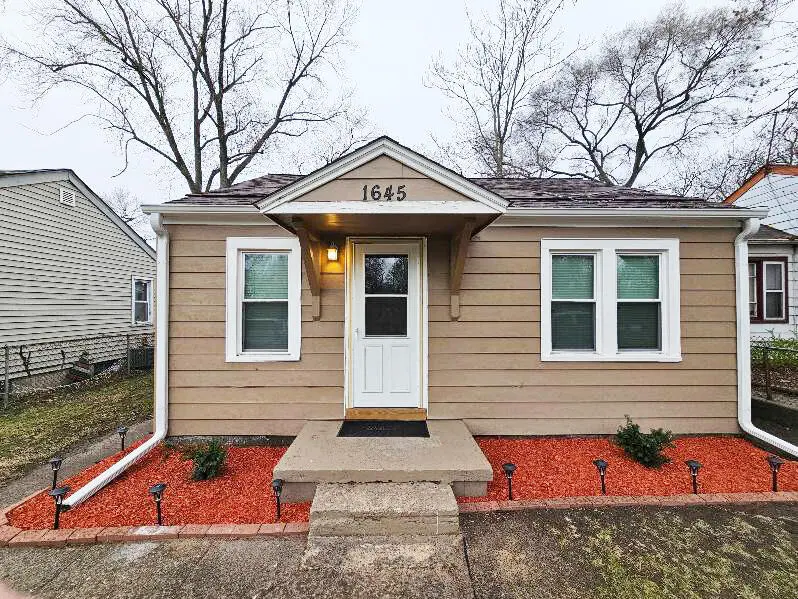
1645 W 40th Ave · Ross, IN
Flood risk 1/10 · Minimal
- FEMA flood zone
- X (unshaded)
- Chance of flooding over 30 yrs
- 0.0%
- Est. flood insurance / yr
- $507 – $1,088
Fire risk 1/10 · Minimal
- Est. fire insurance / yr
- $717 – $1,331
Heat risk 3/10 · Minor
- Hot days now (above 102°F)
- 7 days/yr
- Hot days in 30 yrs
- 15 days/yr
Wind risk 2/10 · Minimal
- Chance of severe wind over 30 yrs
- 0.0%
Air-quality risk 3/10 · Minor
- Unhealthy air days now
- 2 days/yr
- Unhealthy air days in 30 yrs
- 3 days/yr
Risk factors via First Street. Map © Google.
Why this score? — see what drove the C- grade
The composite is a weighted blend of 9 inputs, each scored 0–100. Each bar is that input's sub-score; the figure is the points it added to the 100-point composite (weight × sub-score).
- Cash flow +22.4/30.0
- ARV discount +7.8/15.0
- DSCR +7.2/10.0
- 1% rule +5.3/10.0
- Rent growth +2.5/5.0
- Livability +2.5/5.0
- Condition / age +2.5/5.0
- Schools +1.3/10.0
- Appreciation +0.0/10.0
$129,000
🖨 Deal sheet 📄 Offer letter ✓ Due diligence
Listing remarks MLS
Cozy ranch style home in Calumet Township. Main level everything. Large laundry room, 3 bedrooms and updated bathroom. New carpet through out. Large kitchen, newer flooring and appliances stay.
Key facts
- Updated ranch
- Main-level living
- Huge backyard oasis
Tags
Property features AI
Finance
- Other: Vacant
Exterior
- Parking: Off-street parking on gravel
- Utilities: Electricity connected; Public water; Public sewer; Natural gas connected
- Home design: One-story home; Built in 1946
- Construction: Aluminum siding; Shingle roof
- Exterior features: Private yard; Rain gutters; Chain link fencing; Neighborhood view; No pool
Interior
- Kitchen: Gas range; Range hood
- Bedrooms: Primary bedroom; Bedroom 2; Bedroom 3
- Flooring: Carpet; Tile
- Bathrooms: 1 full bathroom
- Heating & cooling: Forced air heating (natural gas); Central air conditioning
- Interior features: Eat-in kitchen; Laminate counters; Crawl space basement
- Laundry & utility: Main level laundry room; Washer hookup; Gas dryer hookup; Gas water heater; Dryer
Neighborhood map
What this means for you Summary
Snapshot
- This is a 3-bed/1.0-bath single-family listed at $129k.
Deal economics
- At list price, monthly cash flow is $214 ($3k/yr) — positive.
- The deal already cash-flows at list — no discount required.
- Meets the 1% rule at list price ($1k rent vs $129k).
- Recommended offer: $114k (12.0% below list) — sets the bar for market timing.
Location & tenants
- Location reads: area grade C — affects rentability + tenant quality, not the cash-flow math above.
- Lake Ridge New Tech Schools (suburban): math 11% / reading 20% proficiency, ranked #287 of 301 in IN (top 95%) — low school quality limits family demand, transient renter base, plan for 1-2y turnover; 79% free/reduced lunch — lower-income household profile, screen leases tightly.
- Market conditions: 102 active listings in the ZIP; 16 comparable units currently listed for rent nearby; rentals leasing fast (median 7d on market — plan ~1-2 weeks tenant-placement turnaround); 1,642 units permitted in Lake County in 2024 (14 in 5+ unit buildings).
- This rent runs 34% of the median local income ($47k/yr) — at the standard rent-burdened threshold; future hikes will face affordability resistance.
Forward outlook
- Local home prices are declining (-3.0%/yr); year-one equity from $892 of loan paydown is wiped out by about $4k of value loss. Plan a longer hold.
- Lake County population projected to shrink 7% by 2050 — rents likely to lag national; underwrite the cash flow, not the appreciation.
Negotiation context
- It's been on market 165 days — a 12% lower offer ($114k) is reasonable based on typical stale-listing flexibility.
- 8 sale attempts since 23y ago with the ask held roughly flat each time — persistent listings suggest the price (not the market) is what's stuck; bring a comps-based counter.
- Current owner paid $66k; list at $129k implies a 95% gain — meaningful room to come down on a strong offer.
Risks & watch-outs
- Watch-outs: built in 1946 — expect roof / HVAC / electrical / plumbing capex.
Questions for the listing agent
- It's been on market 165 days. Have you received any prior offers? Is the seller open to a 12% concession, seller financing, or rate buy-down credit?
- Built in 1946 — when were the roof, HVAC, electrical panel, plumbing, and water heater last replaced?
- Why hasn't it sold? Are there any deal-killer items the seller is aware of (foundation, flood, title, zoning, code violations)?
- Is there a deadline driving the sale (1031 exchange, divorce, estate, relocation)? That informs how much negotiation room exists.
- What's the average days-on-market for RENTAL listings here right now (not sales)? A rising rental-DOM trend means longer vacancies and softer asking-rent achievability than the comps imply.
- What's the recent tenant-quality profile in this submarket — average credit score on applications, eviction rate, late-payment / NSF rate, and stable-employment percentage? A property-management company in the area should have these aggregated.
- How much new for-sale + rental construction is in the pipeline within 1–3 miles? Heavy new supply typically softens prices + rents 12–24 months out; constrained supply supports both.
Investment metrics
- 1% rule
- 1.03% ✓
- Cap rate
- 8.28%
- Cash-on-cash
- 7.11%
- DSCR
- 1.32
- GRM
- 8.1
CMA / ARV
- ARV (on-the-fly)
- $129,888
- Comps found
- 12
Show comp detail 12 sales within ~0.75 mi
| Address | Dist | Beds/Ba | Sqft | Sold | Price | $/sf | Match |
|---|---|---|---|---|---|---|---|
| 3980 Tyler St | 0.50mi | 3/1.0 | 1,042 (-1%) | 5mo | $128,000 | $123 | 70 |
| 3737 Fillmore St | 0.53mi | 3/1.0 | 1,080 (+2%) | 5mo | $175,500 | $163 | 68 |
| 4181 Fillmore St | 0.45mi | 2/1.0 (-1) | 1,080 (+2%) | 3mo | $22,000 | $20 | 68 |
| 2321 Crest Rd | 0.47mi | 2/1.0 (-1) | 1,131 (+7%) | 5mo | $155,000 | $137 | 57 |
| 3479 Buchanan St | 0.74mi | 3/1.0 | 1,048 (-1%) | 12mo | $160,000 | $153 | 55 |
| 3679 Buchanan St | 0.50mi | 3/1.0 | 918 (-13%) | 0mo | $112,000 | $122 | 55 |
| 3748 Buchanan St | 0.41mi | 3/1.0 | 1,211 (+15%) | 2mo | $22,000 | $18 | 54 |
| 4055 Marshall Pl | 0.73mi | 3/1.0 | 1,125 (+6%) | 1mo | $129,000 | $115 | 54 |
| 4115 Fillmore St | 0.42mi | 2/1.0 (-1) | 950 (-10%) | 6mo | $51,000 | $54 | 53 |
| 1418 W 45th Ave | 0.61mi | 2/1.0 (-1) | 950 (-10%) | 1mo | $35,000 | $37 | 49 |
| 2725 W 42nd Ave | 0.74mi | 3/1.0 | 1,181 (+12%) | 2mo | $156,000 | $132 | 44 |
| 4088 Monroe St | 0.74mi | 2/2.0 (-1) | 956 (-10%) | 10mo | $139,000 | $145 | 32 |
Match score weights: distance 35% · size 25% · config 20% · recency 20%. Top-matched comps best support the ARV.
Projected returns pro-forma
-3.0% appreciation · 3.0% rent growth · sell at horizon
- IRR
- -5.4%
- Equity multiple
- 0.80×
- Total profit
- $-7,277
- Equity at exit
- $19,234
- IRR
- 4.2%
- Equity multiple
- 1.31×
- Total profit
- $11,179
- Equity at exit
- $11,154
Cash invested: $36,120 (down + closing). Projections, not guarantees.
Landlord ↔ Tenant lean methodology
- Overall (STATE)
- 90 Strongly Landlord-Friendly
- State Indiana
- 90 Strongly Landlord-Friendly · R+11
- County
- — inherits STATE
- City
- — inherits STATE
ZIP-level market 46408
- Home prices YoY
- -31.6%
- Active inventory
- 102
- Price-to-rent
- 8.1×
Monthly cashflow live
- Estimated rent
- $1,335 high interval (Pro) →
- Mortgage (P&I)
- −$676
- Tax from tax record
- −$110 /mo · $1,324/yr
- Insurance
- −$54
- HOA
- −$0
- Vacancy / Maint / Mgmt
- −$280
- Net cashflow
- $214
Break-even live
UW: 25.0% down · 7.5% · 30yr · 1.5% tax · 5.0% vac · 8.0% maint · 8.0% mgmt
Financing live
Cash to close
- Down payment
- $32,250
- Closing costs
- $3,870
- Reserves months
- —
- Total cash needed
- —
Loan-product check · same deal, 3 products live
Conventional
25% down · 7.5% · 30yr
- Down + closing
- —
- Monthly P&I
- —
- Monthly cashflow
- —
- DSCR
- —
- Eligible?
- —
Personal DTI + credit; lowest rate.
DSCR
20% down · 8.5% · 30yr
- Down + closing
- —
- Monthly P&I
- —
- Monthly cashflow
- —
- DSCR
- —
- Eligible?
- —
No personal income docs; deal must DSCR.
Hard money
10% down · 12.0% · 12mo
- Down + closing
- —
- Monthly P&I
- —
- Monthly cashflow
- —
- DSCR
- —
- Eligible?
- —
Short-term bridge; refi at stabilization.
Rent comps 16 comps
| Address | Beds | Baths | Sqft | Rent | $/sqft | DOM | Units | Dist |
|---|---|---|---|---|---|---|---|---|
| 3788 Lincoln St Gary, IN | 3.0 | 2.0 | 1398 | $1,400 | $1.00 | 10d | 1 | 0.31mi |
| 3777 Lincoln St Gary, IN | 2.0 | 1.0 | 800 | $1,150 | $1.44 | 1d | 1 | 0.34mi |
| 4040 Fillmore St Gary, IN | 2.0 | 1.0 | 1000 | $1,000 | $1.00 | 10d | 1 | 0.37mi |
| 4170 Fillmore St Gary, IN | 2.0 | 1.0 | 720 | $950 | $1.32 | 19d | 1 | 0.43mi |
| 4018 Tyler St Gary, IN | 3.0 | 1.0 | 880 | $1,350 | $1.53 | 1d | 1 | 0.49mi |
| 4364 Buchanan St Gary, IN | 3.0 | 1.0 | 900 | $1,500 | $1.67 | 1d | 1 | 0.53mi |
| 3708 Harrison St Gary, IN | 3.0 | 1.5 | 904 | $1,400 | $1.55 | 2d | 1 | 0.65mi |
| 4208 Jackson St Gary, IN | 3.0 | 1.0 | 1411 | $1,350 | $0.96 | 44d | 1 | 0.73mi |
| 3449 Buchanan St Gary, IN | 3.0 | 1.0 | 1301 | $1,395 | $1.07 | 43d | 1 | 0.74mi |
| 2410 W 45th Ave #2 Gary, IN | 2.0 | 1.0 | 850 | $950 | $1.12 | 22d | 1 | 0.78mi |
| 2410 W 45th Ave Unit 1 Gary, IN | 2.0 | 1.0 | 850 | $895 | $1.05 | 22d | 1 | 0.78mi |
| 624 W 44th Pl Gary, IN | 3.0 | 1.0 | 836 | $1,250 | $1.50 | 7d | 1 | 0.86mi |
| 4430 Broadway Gary, IN | 3.0 | 1.0 | 1200 | $1,250 | $1.04 | 1d | 1 | 1.19mi |
| 4748 Monroe St Gary, IN | 3.0 | 1.0 | 1074 | $1,695 | $1.58 | 1d | 1 | 1.21mi |
| 4456 Connecticut St Gary, IN | 3.0 | 1.0 | 1044 | $1,300 | $1.25 | 3d | 1 | 1.32mi |
| 3395 Pennsylvania St Gary, IN | 3.0 | 1.0 | 1300 | $1,495 | $1.15 | 1d | 1 | 1.47mi |
Listing history 30 events
-
2026-06-10status $129,000 Pending 165 DOM
-
2026-06-09days on market $129,000 Active 165 DOM
-
2026-06-08days on market $129,000 Active 164 DOM
-
2026-06-07pricedays on market $129,000 Active 163 DOM
-
2026-06-04days on market $130,000 Active 160 DOM
-
2026-06-03days on market $130,000 Active 159 DOM
-
2026-06-02days on market $130,000 Active 158 DOM
-
2026-06-01days on market $130,000 Active 157 DOM
-
2026-05-31days on market $130,000 Active 156 DOM
-
2026-03-17status Active
-
2026-03-09status Pending
-
2026-02-27status Active
-
2026-02-14status Pending
-
2026-01-30price $130,000
-
2026-01-09price $134,800
-
2025-12-05$134,900 Active
-
2025-10-23historical
-
2025-08-23price $140,000
-
2025-07-03price $160,000
-
2025-05-31price $165,000
-
2025-05-09price $172,400
-
2025-04-25$174,900 Active
-
2022-11-08soldstatus $66,000 Closed 193-char remark
Show marketing remark (193 chars)
Cozy ranch style home in Calumet Township. Main level everything. Large laundry room, 3 bedrooms and updated bathroom. New carpet through out. Large kitchen, newer flooring and appliances stay.
-
2022-09-25historical Active Under Contract 193-char remark
Show marketing remark (193 chars)
Cozy ranch style home in Calumet Township. Main level everything. Large laundry room, 3 bedrooms and updated bathroom. New carpet through out. Large kitchen, newer flooring and appliances stay.
-
2022-09-21$66,900 Active 193-char remark
Show marketing remark (193 chars)
Cozy ranch style home in Calumet Township. Main level everything. Large laundry room, 3 bedrooms and updated bathroom. New carpet through out. Large kitchen, newer flooring and appliances stay.
-
2008-03-07historical
-
2006-12-07historical
-
2006-12-06$41,500
-
2004-12-16$41,900
-
2003-06-06$15,000
ⓘ Source: listings_history table (triggers on properties + properties_extension) + one-shot
backfill from property_details.listing_events for pre-trigger history.
Tax reassessment forecast IN · Partial reset (capped growth)
- Current annual tax
- $1,324 · $110/mo
- Projected year-2 tax
- $1,324 · $110/mo
- Expected delta
- $0/yr ($0/mo · 0.0%)
ⓘ Screening estimate from a state-policy table — verify with the county assessor before closing.
Climate risk First Street
- Flood 1/10 Low FEMA zone X (unshaded) · 0% chance over 30 yrs
- Wildfire 1/10 Low
- Heat 3/10 Moderate 7 d/yr ≥102°F today · 15 d/yr by 30 yrs out
- Wind 2/10 Low 0% chance of damaging wind over 30 yrs
- Air quality 3/10 Moderate 2 unhealthy d/yr today · 3 by 30 yrs out
Nearby sold comps map
Loading sold comps map…
Walkable amenities ~0.75 mi
Loading nearby amenities…
Taxation est. · year 1
- Rental income
- $16,021
- − Mortgage interest
- −$7,226
- − Property taxes
- −$1,324
- − Insurance
- −$645
- − Repairs & maintenance
- −$1,282
- − Management
- −$1,282
- − Depreciation
- −$3,753
- Taxable income
- $510
- Est. tax owed @ 24.0%
- −$122
- After-tax cash flow
- $2,447/yr
For passive investors: Depreciation is non-cash, so a rental often shows a tax loss while cash-flowing — sheltering income. Rental losses are passive: they offset passive income freely, and up to $25,000/yr can offset ordinary (W-2) income if you actively participate and your MAGI is under $100k (phasing out to $0 by $150k); unused losses carry forward. On sale, claimed depreciation is recaptured at up to 25%, and gains may owe capital-gains tax (a 1031 exchange can defer both). Figures are a year-1 estimate at your 24.0% rate — not tax advice; consult a CPA.
Schools (NCES district)
- District
- Lake Ridge New Tech Schools
- NCES district ID
- 1805460
- Math proficiency
- 11% ▼ -18.00%
- Reading proficiency
- 20% ▼ -9.00%
- Median HH income
- $34,568
- Composite
- 12.67/100
- National rank
- #9607
- State rank
- #287 of 301 in IN
Livability — Ross
No livability data for this city. (Only ~50 U.S. cities are tracked.)
Census & demographics
- Census place
- Ross, IN
- County
- Lake County · 422,878 people
- City population
- 15,571
- Metro
- Chicago-Naperville-Elgin, IL-IN-WI
- Population (ZIP)
- 15,747
- Household income
- $47,453
- Rent vs Own
- Severe rent burden
- 619.0
Population outlook (Lake County) Hauer SSP2
- Today (2025)
- 484,026 people
- By 2030
- 478,091 · -1.2%
- By 2040
- 462,974 · -4.3%
- By 2050
- 449,894 · -7.1%
- By 2075
- 436,169 · -9.9%
- By 2100
- 426,607 · -11.9%
Race, ethnicity, and origin ACS 2023
- Neighborhood character
- Diverse neighborhood (Simpson 0.68)
- Race & ethnicity
- Black 41% White 32% Hispanic / Latino 22% Two or more races 12%
- Hispanic origin (detail)
- Mexican 14% Puerto Rican 7%
- Common ancestry
- Romanian 5% Iranian 1% Slovak 1%
- Foreign-born
- 4% · Canada, China
- Languages at home
- 87% English-only · Spanish 12% Chinese 1%
Political lean MEDSL · Lake
- 2024 margin
- Lean D (+5.6) · D 52.1% · R 46.5% · Other 1.5%
- 2008→2024 swing
- -28.6pp toward R · 2008: 34.3pp · 2024: 5.6pp
- All cycles
- 2024: D+5.6 2020: D+15.1 2016: D+20.6 2012: D+31.0 2008: D+34.3
Not yet ingested
- Civics
- —
Market trends
- HPI YoY
- ▼ -72.08%
- Current HPI
- 155.6238
- Rent YoY
- —
- Metro
- Chicago-Naperville-Elgin, IL-IN-WI
- State GDP YoY
- ▲ 2.90%
- F500 in state
- 18
Industry mix (Fortune 500 HQ in IN)
| Industry | F500 HQs | Revenue |
|---|---|---|
| Industrial Machinery | 2 | $37B |
|
||
| Healthcare | 1 | $177B |
|
||
| Pharmaceuticals | 1 | $45B |
|
||
| Metals / Steel | 1 | $18B |
|
||
| Agriculture | 1 | $17B |
|
||
| Packaging | 1 | $12B |
|
||
Price history
+766.7% since first listed21 events — show timeline
- 2026-03-17 Relisted — NIRA MLS as Distributed by MLS Grid
- 2026-03-09 Pending — NIRA MLS as Distributed by MLS Grid
- 2026-02-27 Relisted — NIRA MLS as Distributed by MLS Grid
- 2026-02-14 Pending — NIRA MLS as Distributed by MLS Grid
- 2026-01-30 Price Changed $130,000 NIRA MLS as Distributed by MLS Grid
- 2026-01-09 Price Changed $134,800 NIRA MLS as Distributed by MLS Grid
- 2025-12-05 Listed $134,900 NIRA MLS as Distributed by MLS Grid
- 2025-10-23 Listing Removed — NIRA MLS as Distributed by MLS Grid
- 2025-08-23 Price Changed $140,000 NIRA MLS as Distributed by MLS Grid
- 2025-07-03 Price Changed $160,000 NIRA MLS as Distributed by MLS Grid
- 2025-05-31 Price Changed $165,000 NIRA MLS as Distributed by MLS Grid
- 2025-05-09 Price Changed $172,400 NIRA MLS as Distributed by MLS Grid
- 2025-04-25 Listed $174,900 NIRA MLS as Distributed by MLS Grid
- 2022-11-08 Sold (MLS) $66,000 NIRA MLS as Distributed by MLS Grid
- 2022-09-25 Contingent — NIRA MLS as Distributed by MLS Grid
- 2022-09-21 Listed $66,900 NIRA MLS as Distributed by MLS Grid
- 2008-03-07 Listing Removed — NIRA MLS as Distributed by MLS Grid
- 2006-12-07 Listing Removed — NIRA MLS as Distributed by MLS Grid
- 2006-12-06 Listed $41,500 NIRA MLS as Distributed by MLS Grid
- 2004-12-16 Listed $41,900 NIRA MLS as Distributed by MLS Grid
- 2003-06-06 Listed $15,000 NIRA MLS as Distributed by MLS Grid
Property tax history
+1.6%/yrLatest (2024): $1,324 · +1.2% YoY. Source: county tax records.
Cash-flow waterfall
monthlySold comps — $/sqft
last 12 mo · ≤1 miLoading sold comps…