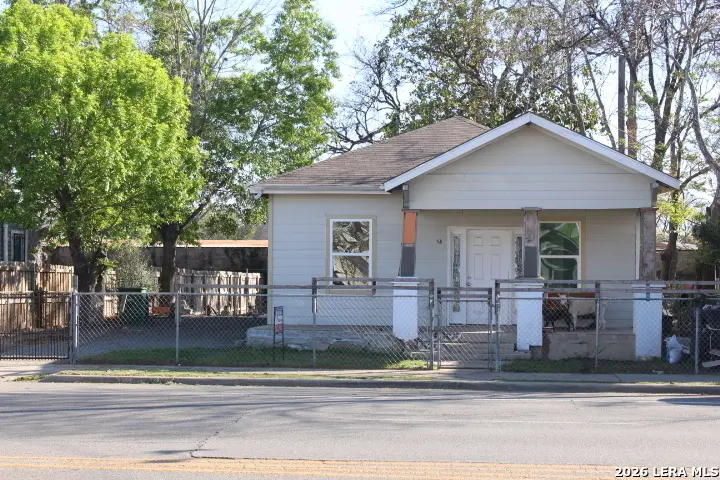
830 Steves Ave · San Antonio, TX
Flood risk 3/10 · Minor
- FEMA flood zone
- X (unshaded)
- Chance of flooding over 30 yrs
- 0.1%
- Est. flood insurance / yr
- $507 – $1,088
Fire risk 1/10 · Minimal
- Est. fire insurance / yr
- $1,222 – $2,270
Heat risk 8/10 · Major
- Hot days now (above 109°F)
- 7 days/yr
- Hot days in 30 yrs
- 22 days/yr
Wind risk 8/10 · Major
- Chance of severe wind over 30 yrs
- 80.0%
Air-quality risk 2/10 · Minimal
- Unhealthy air days now
- 1 days/yr
- Unhealthy air days in 30 yrs
- 2 days/yr
Risk factors via First Street. Map © Google.
Why this score? — see what drove the D+ grade
The composite is a weighted blend of 9 inputs, each scored 0–100. Each bar is that input's sub-score; the figure is the points it added to the 100-point composite (weight × sub-score).
- ARV discount +15.0/15.0
- Cash flow +12.6/30.0
- 1% rule +4.6/10.0
- Livability +4.0/5.0
- DSCR +3.8/10.0
- Rent growth +2.8/5.0
- Condition / age +2.5/5.0
- Schools +1.4/10.0
- Appreciation +0.0/10.0
$145,000
🖨 Deal sheet (PDF) 📄 Offer letter ✓ Due diligence
Listing remarks MLS
Great 1 story floor plan located in the center of town. Only 5 minutes from downtown.
Key facts
- 6,882 sq ft lot
- Built 1920
- Listed 95 days
Neighborhood map
What this means for you Summary
Snapshot
- This is a 2-bed/1.0-bath single-family listed at $145k.
Deal economics
- At list price, monthly cash flow is $-19 ($-228/yr) — negative.
- To cash-flow at today's rent, offer at most $142k (2.3% below list).
- To meet the 1% rule (rent ≥ 1% of price), the offer needs to be $139k (4.0% below list).
- Recommended offer: $132k (9.0% below list) — sets the bar for market timing.
- Cap rate 6.1% vs local median 3.8% in San Antonio — top-decile yield for the area; either an underpriced asset or a hidden risk that comps aren't pricing in. Stress-test before assuming the spread holds.
Location & tenants
- Location reads 80/100 on livability (#31 in TX, #1,616 nationally) — a professional / high-income tenant draw. Strengths: amenities A+, commute A+, cost of living A+; Watch: schools C-, crime F.
- San Antonio ISD (urban): math 12% / reading 22% proficiency, ranked #805 of 826 in TX (top 98%) — low school quality limits family demand, transient renter base, plan for 1-2y turnover; 80% free/reduced lunch — lower-income household profile, screen leases tightly.
- Market conditions: Rents rising (+1.1%/yr); 269 active listings in the ZIP; 40 comparable units currently listed for rent nearby; rentals at typical pace (median 21d on market — plan ~3-4 weeks tenant-placement turnaround); 8,308 units permitted in Bexar County in 2024 (2,506 in 5+ unit buildings).
- This rent runs 30% of the median local income ($55k/yr) — at the standard rent-burdened threshold; future hikes will face affordability resistance.
Forward outlook
- Local home prices are declining (-3.0%/yr); year-one equity from $1k of loan paydown is wiped out by about $4k of value loss. Plan a longer hold.
- Bexar County population projected at +50% by 2050 — long-run rental-demand tailwind backs the buy-and-hold thesis.
Negotiation context
- It's been on market 95 days — a 9% lower offer ($132k) is reasonable based on typical stale-listing flexibility.
Risks & watch-outs
- Watch-outs: built in 1920 — expect roof / HVAC / electrical / plumbing capex.
- Climate carrying-cost: severe wind risk, 80% chance of damaging wind over 30y; extreme-heat days projected 7→22/yr by 2055 (HVAC capex compounding) — expect insurance premiums to compound above CPI over the hold.
Questions for the listing agent
- What do current leases actually rent for vs. the listed asking? Can we see a recent rent roll and the last 12 months of T-12 income?
- It's been on market 95 days. Have you received any prior offers? Is the seller open to a 9% concession, seller financing, or rate buy-down credit?
- Built in 1920 — when were the roof, HVAC, electrical panel, plumbing, and water heater last replaced?
- Why hasn't it sold? Are there any deal-killer items the seller is aware of (foundation, flood, title, zoning, code violations)?
- Is there a deadline driving the sale (1031 exchange, divorce, estate, relocation)? That informs how much negotiation room exists.
- Crime grade is F in this area — have there been break-ins, vandalism, or insurance claims at this property in the last 3 years? What carrier currently insures it and at what premium?
- The area grade is low — what's the realistic commute time and amenity access for the typical tenant pool here? Any planned neighborhood developments (good or bad) we should know about?
- What's the average days-on-market for RENTAL listings here right now (not sales)? A rising rental-DOM trend means longer vacancies and softer asking-rent achievability than the comps imply.
- What's the recent tenant-quality profile in this submarket — average credit score on applications, eviction rate, late-payment / NSF rate, and stable-employment percentage? A property-management company in the area should have these aggregated.
- How much new for-sale + rental construction is in the pipeline within 1–3 miles? Heavy new supply typically softens prices + rents 12–24 months out; constrained supply supports both.
Investment metrics
- 1% rule
- 0.96% ✗
- Cap rate
- 6.14%
- Cash-on-cash
- -0.56%
- DSCR
- 0.98
- GRM
- 8.7
CMA / ARV
- ARV (median comp)
- $207,017
- List price
- $145,000
- Delta
- -29.96%
- Verdict
- UNDERPRICED
- Comps
- 20 within 1.0 mi
Show comp detail 9 sales within ~0.75 mi
| Address | Dist | Beds/Ba | Sqft | Sold | Price | $/sf | Match |
|---|---|---|---|---|---|---|---|
| 114 Benita | 0.25mi | 2/2.0 | 1,181 (+10%) | 2mo | $100,000 | $85 | 66 |
| 215 Berkshire | 0.51mi | 2/2.0 | 1,128 (+5%) | 3mo | $299,999 | $266 | 61 |
| 134 Arlington Ct | 0.40mi | 2/2.0 | 1,162 (+8%) | 4mo | $238,000 | $205 | 60 |
| 434 Mcmullen St | 0.45mi | 2/1.0 | 1,128 (+5%) | 22mo | $224,900 | $199 | 52 |
| 727 Schley | 0.55mi | 3/1.0 (+1) | 1,030 (-4%) | 16mo | $199,900 | $194 | 49 |
| 230 Glenwood | 0.61mi | 2/1.0 | 1,212 (+13%) | 4mo | $225,000 | $186 | 46 |
| 805 Theo Pkwy | 0.52mi | 3/1.0 (+1) | 1,200 (+12%) | 14mo | $260,000 | $217 | 39 |
| 831 Mckinley | 0.65mi | 3/1.0 (+1) | 1,150 (+7%) | 19mo | $147,500 | $128 | 37 |
| 124 Parkview | 0.61mi | 3/2.0 (+1) | 960 (-10%) | 14mo | $99,000 | $103 | 34 |
Match score weights: distance 35% · size 25% · config 20% · recency 20%. Top-matched comps best support the ARV.
Projected returns pro-forma
-3.0% appreciation · 1.07% rent growth · sell at horizon
- IRR
- -19.6%
- Equity multiple
- 0.33×
- Total profit
- $-27,265
- Equity at exit
- $21,620
- IRR
- -17.6%
- Equity multiple
- 0.13×
- Total profit
- $-35,394
- Equity at exit
- $12,537
Cash invested: $40,600 (down + closing). Projections, not guarantees.
Landlord ↔ Tenant lean methodology
- Overall (STATE)
- 87 Strongly Landlord-Friendly
- State Texas
- 87 Strongly Landlord-Friendly · R+5
- County
- — inherits STATE
- City
- — inherits STATE
ZIP-level market 78210
- Rents YoY
- 1.1%
- Active inventory
- 269
- Price-to-rent
- 8.7×
Monthly cashflow live
- Estimated rent
- $1,393 high interval (Pro) →
- Mortgage (P&I)
- −$760
- Tax from tax record
- −$298 /mo · $3,580/yr
- Insurance
- −$60
- HOA
- −$0
- Vacancy / Maint / Mgmt
- −$292
- Net cashflow
- $-19
Break-even live
Sensitivity live
| Price | -10% $63 | -5% $22 | +0% $-19 | +5% $-60 | +10% $-101 |
|---|---|---|---|---|---|
| Rent | -10% $-129 | -5% $-74 | +0% $-19 | +5% $36 | +10% $91 |
| Rate | -1.0pp $54 | -0.5pp $18 | base $-19 | +0.5pp $-57 | +1.0pp $-95 |
UW: 25.0% down · 7.5% · 30yr · 1.5% tax · 5.0% vac · 8.0% maint · 8.0% mgmt
Financing live
Cash to close
- Down payment
- $36,250
- Closing costs
- $4,350
- Reserves months
- —
- Total cash needed
- —
Loan-product check · same deal, 3 products live
Conventional
25% down · 7.5% · 30yr
- Down + closing
- —
- Monthly P&I
- —
- Monthly cashflow
- —
- DSCR
- —
- Eligible?
- —
Personal DTI + credit; lowest rate.
DSCR
20% down · 8.5% · 30yr
- Down + closing
- —
- Monthly P&I
- —
- Monthly cashflow
- —
- DSCR
- —
- Eligible?
- —
No personal income docs; deal must DSCR.
Hard money
10% down · 12.0% · 12mo
- Down + closing
- —
- Monthly P&I
- —
- Monthly cashflow
- —
- DSCR
- —
- Eligible?
- —
Short-term bridge; refi at stabilization.
Rent comps 40 comps
| Address | Beds | Baths | Sqft | Rent | $/sqft | DOM | Units | Dist |
|---|---|---|---|---|---|---|---|---|
| 222 E Mitchell St San Antonio, TX | 2.0 | 1.0–2.0 | 972 | $1,825 | $1.88 | 3d | 16 | 0.31mi |
| 1019 Steves Ave Unit 1 San Antonio, TX | 2.0 | 1.0 | 800 | $1,350 | $1.69 | 5d | 1 | 0.32mi |
| 217 Castillo Ave Apt 3 San Antonio, TX | 1.0 | 1.0 | 749 | $1,000 | $1.34 | 44d | 1 | 0.34mi |
| 220 Hansford St San Antonio, TX | 3.0 | 2.0 | 1269 | $1,600 | $1.26 | 4d | 1 | 0.34mi |
| 253 Felisa St San Antonio, TX | 1.0 | 1.0 | 799 | $1,213 | $1.52 | 44d | 1 | 0.36mi |
| 506 W Drexel Ave San Antonio, TX | 2.0 | 1.0 | 740 | $750 | $1.01 | 24d | 1 | 0.63mi |
| 506 W Drexel Ave San Antonio, TX | 1.0 | 1.0 | 740 | $795 | $1.07 | 22d | 1 | 0.63mi |
| 506 W Drexel Ave Unit 1 San Antonio, TX | 1.0 | 1.0 | 740 | $795 | $1.07 | 24d | 1 | 0.63mi |
| 2007 S Presa St San Antonio, TX | 2.0 | 1.0 | 1276 | $1,800 | $1.41 | 15d | 1 | 0.66mi |
| 323 W Mitchell St San Antonio, TX | 1.0–2.0 | 1.0–2.0 | 788 | $1,257 | $1.59 | 4d | 1 | 0.72mi |
| 439 Dunning Ave San Antonio, TX | 2.0 | 2.0 | 1050 | $1,500 | $1.43 | 5d | 1 | 0.75mi |
| 4115 S Presa St Unit 2 San Antonio, TX | 1.0 | 1.0 | 700 | $749 | $1.07 | 15d | 1 | 0.76mi |
| 4115 S Presa St San Antonio, TX | 1.0 | 1.0 | 700 | $795 | $1.14 | 44d | 1 | 0.76mi |
| 134 Ward Ave San Antonio, TX | 2.0 | 1.0 | 1063 | $1,150 | $1.08 | 44d | 1 | 0.81mi |
| 142 Avant Ave #1 San Antonio, TX | 3.0 | 1.0 | 1314 | $1,495 | $1.14 | 18d | 1 | 0.82mi |
| 142 Avant Ave Unit 3 San Antonio, TX | 1.0 | 1.0 | 700 | $950 | $1.36 | 44d | 1 | 0.83mi |
| 1722 S Saint Marys St San Antonio, TX | 1.0 | 1.0 | 880 | $1,350 | $1.53 | 15d | 1 | 0.83mi |
| 114 Jacobs St Unit 201 San Antonio, TX | 1.0 | 1.0 | 700 | $1,350 | $1.93 | 5d | 1 | 0.83mi |
| 423 Blue Star Unit 710 San Antonio, TX | 2.0 | 2.0 | 1209 | $1,929 | $1.60 | 3d | 1 | 0.92mi |
| 228 Lotus St Unit 201 San Antonio, TX | 3.0 | 3.5 | 1500 | $1,850 | $1.23 | 3d | 1 | 0.92mi |
| 228 Lotus Ave Unit 101 San Antonio, TX | 3.0 | 2.0 | 1500 | $1,850 | $1.23 | 13d | 1 | 0.92mi |
| 228 Lotus Ave Unit 101 San Antonio, TX | 3.0 | 3.5 | 1500 | $1,800 | $1.20 | 5d | 1 | 0.92mi |
| 518 Topeka Blvd San Antonio, TX | 3.0 | 2.0 | 1135 | $1,375 | $1.21 | 24d | 1 | 0.94mi |
| 122 Biering St #2 San Antonio, TX | 2.0 | 1.0 | 1472 | $1,100 | $0.75 | 44d | 1 | 0.95mi |
| 1510 Steves Ave San Antonio, TX | 3.0 | 2.0 | 1330 | $1,800 | $1.35 | 24d | 1 | 0.96mi |
| 327 Gem Ln San Antonio, TX | 2.0 | 1.0 | 786 | $1,600 | $2.04 | 12d | 1 | 0.97mi |
| 1914 S Pine St San Antonio, TX | 2.0 | 1.0 | 1025 | $1,250 | $1.22 | 44d | 1 | 1.00mi |
| 534 Chicago Blvd Unit NA San Antonio, TX | 3.0 | 2.0 | 1250 | $1,550 | $1.24 | 18d | 1 | 1.00mi |
| 534 Chicago Blvd San Antonio, TX | 3.0 | 2.0 | 1250 | $1,550 | $1.24 | 20d | 1 | 1.00mi |
| 2450 Roosevelt Ave San Antonio, TX | 1.0 | 1.0 | 645 | $1,442 | $2.23 | 44d | 8 | 1.00mi |
| 1131 McKinley Ave San Antonio, TX | 2.0 | 1.0 | 1000 | $1,550 | $1.55 | 5d | 1 | 1.01mi |
| 271 E Lambert St San Antonio, TX | 3.0 | 1.0 | 950 | $1,250 | $1.32 | 20d | 1 | 1.01mi |
| 413 Probandt San Antonio, TX | 2.0 | 1.0 | 996 | $1,400 | $1.41 | 20d | 1 | 1.01mi |
| 1528 Steves Ave Unit 1 San Antonio, TX | 2.0 | 1.0 | 940 | $1,025 | $1.09 | 44d | 1 | 1.01mi |
| 331 Avant Ave San Antonio, TX | 3.0 | 2.0 | 1200 | $1,825 | $1.52 | 24d | 1 | 1.03mi |
| 232 Regina St Unit 1 San Antonio, TX | 2.0 | 1.0 | 1085 | $1,399 | $1.29 | 3d | 1 | 1.07mi |
| 415 Florida St San Antonio, TX | 3.0 | 2.0 | 1333 | $2,799 | $2.10 | 21d | 1 | 1.08mi |
| 730 E Carolina St San Antonio, TX | 1.0 | 1.0 | 1176 | $700 | $0.60 | 24d | 1 | 1.12mi |
| 614 Barbe St San Antonio, TX | 2.0 | 2.0 | 1200 | $1,500 | $1.25 | 24d | 1 | 1.12mi |
| 531 Cedar St Unit 3 San Antonio, TX | 1.0 | 1.0 | 713 | $850 | $1.19 | 44d | 1 | 1.13mi |
Listing history 16 events
-
2026-06-18days on market $145,000 Active 95 DOM
-
2026-06-17days on market $145,000 Active 94 DOM
-
2026-06-16days on market $145,000 Active 93 DOM
-
2026-06-15days on market $145,000 Active 92 DOM
-
2026-06-13days on market $145,000 Active 90 DOM
-
2026-06-09days on market $145,000 Active 86 DOM
-
2026-06-08days on market $145,000 Active 85 DOM
-
2026-06-07days on market $145,000 Active 84 DOM
-
2026-06-04days on market $145,000 Active 81 DOM
-
2026-06-03days on market $145,000 Active 80 DOM
-
2026-06-02days on market $145,000 Active 79 DOM
-
2026-06-01days on market $145,000 Active 78 DOM
-
2026-05-31days on market $145,000 Active 77 DOM
-
2026-04-20price $145,000 85-char remark
Show marketing remark (85 chars)
Great 1 story floor plan located in the center of town. Only 5 minutes from downtown.
-
2026-03-15$150,000 New 85-char remark
Show marketing remark (85 chars)
Great 1 story floor plan located in the center of town. Only 5 minutes from downtown.
-
1994-06-01soldstatus
ⓘ Source: listings_history table (triggers on properties + properties_extension) + one-shot
backfill from property_details.listing_events for pre-trigger history.
Tax reassessment forecast TX · Resets to sale price
- Current annual tax
- $3,580 · $298/mo
- Projected year-2 tax
- $3,580 · $298/mo
- Expected delta
- $0/yr ($0/mo · 0.0%)
ⓘ Screening estimate from a state-policy table — verify with the county assessor before closing.
Climate risk First Street
- Flood 3/10 Moderate FEMA zone X (unshaded) · 10% chance over 30 yrs
- Wildfire 1/10 Low
- Heat 8/10 Severe 7 d/yr ≥109°F today · 22 d/yr by 30 yrs out
- Wind 8/10 Severe 80% chance of damaging wind over 30 yrs
- Air quality 2/10 Low 1 unhealthy d/yr today · 2 by 30 yrs out
Nearby sold comps map
Loading sold comps map…
Walkable amenities ~0.75 mi
Loading nearby amenities…
Taxation est. · year 1
- Rental income
- $16,711
- − Mortgage interest
- −$8,122
- − Property taxes
- −$3,580
- − Insurance
- −$725
- − Repairs & maintenance
- −$1,337
- − Management
- −$1,337
- − Depreciation
- −$4,218
- Taxable loss
- −$2,608
- Est. tax savings @ 24.0%
- +$626
- After-tax cash flow
- $398/yr
For passive investors: Depreciation is non-cash, so a rental often shows a tax loss while cash-flowing — sheltering income. Rental losses are passive: they offset passive income freely, and up to $25,000/yr can offset ordinary (W-2) income if you actively participate and your MAGI is under $100k (phasing out to $0 by $150k); unused losses carry forward. On sale, claimed depreciation is recaptured at up to 25%, and gains may owe capital-gains tax (a 1031 exchange can defer both). Figures are a year-1 estimate at your 24.0% rate — not tax advice; consult a CPA.
Schools (NCES district)
- District
- San Antonio ISD
- NCES district ID
- 4838730
- Math proficiency
- 12% ▼ -21.00%
- Reading proficiency
- 22% ▼ -7.00%
- Median HH income
- $30,952
- Composite
- 13.57/100
- National rank
- #9512
- State rank
- #805 of 826 in TX
Livability — San Antonio
- Score
- 80/100
- State rank
- #31
- US rank
- #1616
Category grades
Schools grade is shown separately in the Schools card above.
Census & demographics
- Census place
- San Antonio, TX
- County
- Bexar County · 1,990,555 people
- City population
- 1,806,925
- Metro
- San Antonio-New Braunfels, TX
- Population (ZIP)
- 34,940
- Household income
- $55,028
- Rent vs Own
- Severe rent burden
- 1708.0
Population outlook (Bexar County) Hauer SSP2
- Today (2025)
- 2,336,851 people
- By 2030
- 2,560,728 · +9.6%
- By 2040
- 3,020,569 · +29.3%
- By 2050
- 3,493,522 · +49.5%
- By 2075
- 4,668,459 · +99.8%
- By 2100
- 5,533,242 · +136.8%
Race, ethnicity, and origin ACS 2023
- Neighborhood character
- Predominantly Hispanic (83%)
- Race & ethnicity
- Hispanic / Latino 83% Two or more races 29% White 11% Black 4% Native American 2%
- Hispanic origin (detail)
- Mexican 72% Puerto Rican 2%
- Common ancestry
- Lithuanian 1%
- Foreign-born
- 12% · Canada
- Languages at home
- 55% English-only · Spanish 44%
Political lean MEDSL · Bexar
- 2024 margin
- Lean D (+9.8) · D 54.3% · R 44.6% · Other 1.1%
- 2008→2024 swing
- +4.2pp toward D · 2008: 5.6pp · 2024: 9.8pp
- All cycles
- 2024: D+9.8 2020: D+18.2 2016: D+13.5 2012: D+4.6 2008: D+5.6
Not yet ingested
- Civics
- —
Market trends
- HPI YoY
- ▼ -163.42%
- Current HPI
- 286.299
- Rent YoY
- ▲ 1.07%
- Metro
- San Antonio-New Braunfels, TX
- State GDP YoY
- ▲ 3.95%
- F500 in state
- 110
Industry mix (Fortune 500 HQ in TX)
| Industry | F500 HQs | Revenue |
|---|---|---|
| Energy | 16 | $1,198B |
|
||
| Technology | 5 | $198B |
|
||
| Engineering / Construction | 4 | $72B |
|
||
| Energy Services | 3 | $60B |
|
||
| Utilities | 3 | $41B |
|
||
| Healthcare | 2 | $330B |
|
||
Price history
-3.3% since first listed3 events — show timeline
- 2026-04-20 Price Changed $145,000 LERA
- 2026-03-15 Listed $150,000 LERA
- 1994-06-01 Sold (Public Records) — Public Records
Property tax history
+6.9%/yrLatest (2025): $3,580 · +10.0% YoY. Source: county tax records.
Cash-flow waterfall
monthlySold comps — $/sqft
last 12 mo · ≤1 miLoading sold comps…