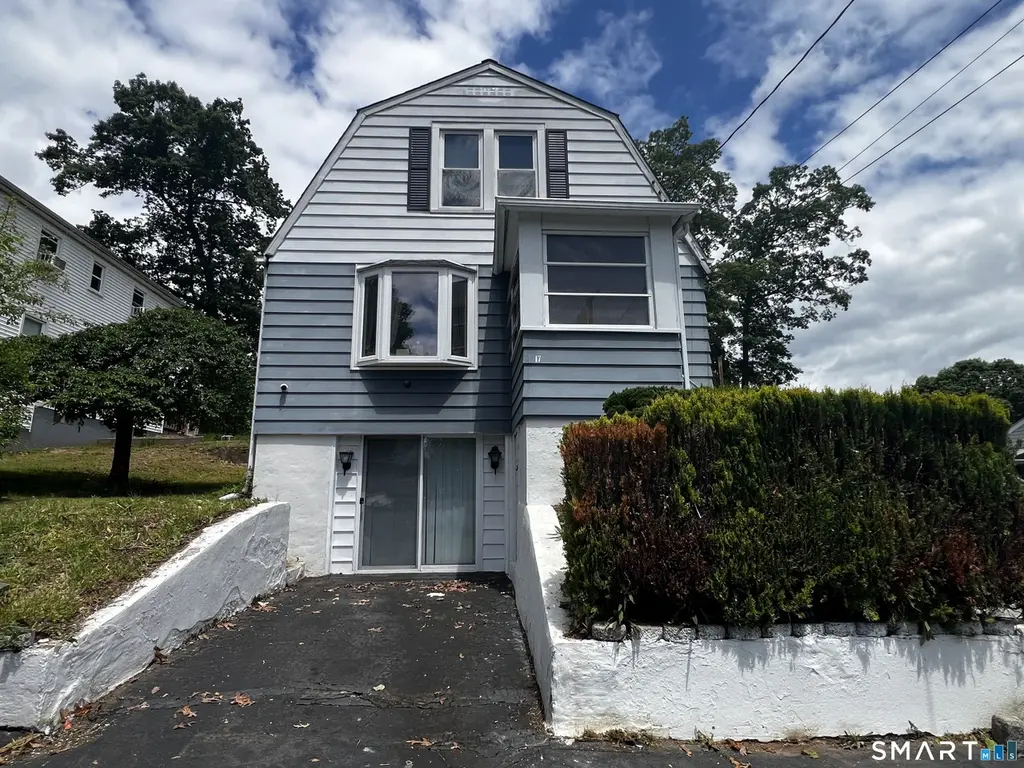
17 Ridgeview Rd · Meriden, CT
Flood risk 1/10 · Minimal
- FEMA flood zone
- X (unshaded)
- Chance of flooding over 30 yrs
- 0.0%
- Est. flood insurance / yr
- $473 – $860
Fire risk 1/10 · Minimal
- Est. fire insurance / yr
- $829 – $1,539
Heat risk 5/10 · Moderate
- Hot days now (above 99°F)
- 7 days/yr
- Hot days in 30 yrs
- 16 days/yr
Wind risk 6/10 · Moderate
- Chance of severe wind over 30 yrs
- 27.0%
Air-quality risk 3/10 · Minor
- Unhealthy air days now
- 3 days/yr
- Unhealthy air days in 30 yrs
- 4 days/yr
Risk factors via First Street. Map © Google.
Why this score? — see what drove the D+ grade
The composite is a weighted blend of 9 inputs, each scored 0–100. Each bar is that input's sub-score; the figure is the points it added to the 100-point composite (weight × sub-score).
- ARV discount +15.0/15.0
- Cash flow +12.8/30.0
- Livability +4.2/5.0
- DSCR +3.8/10.0
- 1% rule +3.6/10.0
- Schools +3.0/10.0
- Rent growth +2.5/5.0
- Condition / age +2.5/5.0
- Appreciation +0.0/10.0
$239,000
🖨 Deal sheet 📄 Offer letter ✓ Due diligence
Listing remarks
Charming 2-bedroom, 1-bath Colonial located in a secluded, park-like setting of Meriden. The main level features a functional layout with a kitchen, living room, and formal dining room, offering comfortable everyday living. Upstairs includes 2 bedrooms and a full bath. The partially finished basement provides additional living space with a family room and walk-out access; perfect for a recreation area, home office, or flex space. Step outside to enjoy the private backyard featuring a covered gazebo-ideal for relaxing or entertaining. Conveniently located near parks, hiking trails, shopping, dining, and local attractions, including Hubbard Park and Castle Craig. Enjoy the feel of a private r
Key facts
- 4,791 sq ft lot
- Parking
- Built 1950
Property features AI
Finance
- Financial info: Assessed value listed
Exterior
- Parking: Driveway parking; 1 parking space
- Utilities: Public water connected; Public sewer connected
- Home design: Single-family home
- Construction: Frame construction; Vinyl siding; Asphalt shingle roof; Concrete foundation; Dark green exterior color
- Exterior features: Sloping lot; Private paved driveway
Interior
- Kitchen: Electric range; Refrigerator
- Bedrooms: 2 bedrooms
- Bathrooms: 1 full bathroom
- Heating & cooling: Hot water heating (oil-fired); 40-gallon electric hot water tank; Above-ground fuel tank
- Interior features: Total of 5 rooms; Full basement with partial walk-out
- Laundry & utility: Washer; Electric dryer; Laundry in lower level / basement
Neighborhood map
What this means for you Summary
Snapshot
- This is a 2-bed/1.0-bath single-family listed at $239k.
Deal economics
- At list price, monthly cash flow is $-21 ($-254/yr) — negative.
- To cash-flow at today's rent, offer at most $235k (1.6% below list).
- To meet the 1% rule (rent ≥ 1% of price), the offer needs to be $207k (13.6% below list).
- Recommended offer: $207k (13.6% below list) — sets the bar for 1% rule.
- Cap rate 6.2% vs local median 4.2% in Meriden — top-decile yield for the area; either an underpriced asset or a hidden risk that comps aren't pricing in. Stress-test before assuming the spread holds.
Location & tenants
- Location reads 85/100 on livability (#4 in CT, #505 nationally) — a professional / high-income tenant draw. Strengths: amenities A+, housing A+, health & safety A+.
- Meriden School District (suburban): math 27% / reading 41% proficiency, ranked #116 of 153 in CT (top 76%) — families likely to look elsewhere, expect single-tenant / working-renter base with shorter leases; 61% free/reduced lunch — lower-income household profile, screen leases tightly.
- Zoned schools: John Barry School (math 26% / reading 37%, grade F, #376 of 553 statewide, top 68%, 472 students, 87% FRL); Orville H. Platt High School (math 12% / reading 32%, grade F, #156 of 194 statewide, top 82%, 1,108 students, 80% FRL) — zoned schools average 84% FRL vs 61% district-wide (23 pts higher); higher-poverty schools than district average — tighter screening recommended.
- Market conditions: 70 active listings in the ZIP; 11 comparable units currently listed for rent nearby; rentals leasing fast (median 11d on market — plan ~1-2 weeks tenant-placement turnaround); 1,059 units permitted in South Central Connecticut Planning Region in 2024 (779 in 5+ unit buildings).
- This rent runs 35% of the median local income ($71k/yr) — at the standard rent-burdened threshold; future hikes will face affordability resistance.
Forward outlook
- Local home prices are declining (-3.0%/yr); year-one equity from $2k of loan paydown is wiped out by about $7k of value loss. Plan a longer hold.
Negotiation context
- Only 6 days on market — expect competitive offers; lowballing is unlikely to land.
- Current owner paid $125k; list at $239k implies a 91% gain — meaningful room to come down on a strong offer.
Risks & watch-outs
- Watch-outs: built in 1950 — expect roof / HVAC / electrical / plumbing capex.
- Climate carrying-cost: major wind risk, 27% chance of damaging wind over 30y; extreme-heat days projected 7→16/yr by 2055 (HVAC capex compounding) — expect insurance premiums to compound above CPI over the hold.
Questions for the listing agent
- What do current leases actually rent for vs. the listed asking? Can we see a recent rent roll and the last 12 months of T-12 income?
- Built in 1950 — when were the roof, HVAC, electrical panel, plumbing, and water heater last replaced?
- Is there a deadline driving the sale (1031 exchange, divorce, estate, relocation)? That informs how much negotiation room exists.
- The area grade is low — what's the realistic commute time and amenity access for the typical tenant pool here? Any planned neighborhood developments (good or bad) we should know about?
- What's the average days-on-market for RENTAL listings here right now (not sales)? A rising rental-DOM trend means longer vacancies and softer asking-rent achievability than the comps imply.
- What's the recent tenant-quality profile in this submarket — average credit score on applications, eviction rate, late-payment / NSF rate, and stable-employment percentage? A property-management company in the area should have these aggregated.
- How much new for-sale + rental construction is in the pipeline within 1–3 miles? Heavy new supply typically softens prices + rents 12–24 months out; constrained supply supports both.
Investment metrics
- 1% rule
- 0.86% ✗
- Cap rate
- 6.19%
- Cash-on-cash
- -0.38%
- DSCR
- 0.98
- GRM
- 9.6
CMA / ARV
- ARV (on-the-fly)
- $318,318
- Comps found
- 6
Show comp detail 6 sales within ~0.75 mi
| Address | Dist | Beds/Ba | Sqft | Sold | Price | $/sf | Match |
|---|---|---|---|---|---|---|---|
| 37 Carey Ave | 0.09mi | 2/1.0 | 957 (-4%) | 15mo | $293,000 | $306 | 76 |
| 584 Gracey Ave | 0.30mi | 3/1.5 (+1) | 1,006 (+0%) | 5mo | $324,000 | $322 | 74 |
| 31 Hilltop Rd | 0.08mi | 2/2.0 | 960 (-4%) | 20mo | $270,000 | $281 | 68 |
| 574 Gracey Ave | 0.31mi | 2/1.0 | 1,070 (+7%) | 21mo | $245,000 | $229 | 56 |
| 9 Empire Ave | 0.75mi | 3/1.0 (+1) | 1,054 (+5%) | 2mo | $335,000 | $318 | 50 |
| 53 Nancy Ln | 0.64mi | 3/1.5 (+1) | 960 (-4%) | 19mo | $310,000 | $323 | 40 |
Match score weights: distance 35% · size 25% · config 20% · recency 20%. Top-matched comps best support the ARV.
Projected returns pro-forma
-3.0% appreciation · 3.0% rent growth · sell at horizon
- IRR
- -16.9%
- Equity multiple
- 0.40×
- Total profit
- $-40,045
- Equity at exit
- $35,636
- IRR
- -8.8%
- Equity multiple
- 0.45×
- Total profit
- $-36,478
- Equity at exit
- $20,664
Cash invested: $66,920 (down + closing). Projections, not guarantees.
Landlord ↔ Tenant lean methodology
- Overall (STATE)
- 27 Tenant-Leaning
- State Connecticut
- 27 Tenant-Leaning · D+7
- County
- — inherits STATE
- City
- — inherits STATE
ZIP-level market 06451
- Home prices YoY
- -14.2%
- Active inventory
- 70
- Price-to-rent
- 9.6×
Monthly cashflow live
- Estimated rent
- $2,065 high interval (Pro) →
- Mortgage (P&I)
- −$1,253
- Tax from tax record
- −$300 /mo · $3,597/yr
- Insurance
- −$100
- HOA
- −$0
- Vacancy / Maint / Mgmt
- −$434
- Net cashflow
- $-21
Break-even live
UW: 25.0% down · 7.5% · 30yr · 1.5% tax · 5.0% vac · 8.0% maint · 8.0% mgmt
Financing live
Cash to close
- Down payment
- $59,750
- Closing costs
- $7,170
- Reserves months
- —
- Total cash needed
- —
Loan-product check · same deal, 3 products live
Conventional
25% down · 7.5% · 30yr
- Down + closing
- —
- Monthly P&I
- —
- Monthly cashflow
- —
- DSCR
- —
- Eligible?
- —
Personal DTI + credit; lowest rate.
DSCR
20% down · 8.5% · 30yr
- Down + closing
- —
- Monthly P&I
- —
- Monthly cashflow
- —
- DSCR
- —
- Eligible?
- —
No personal income docs; deal must DSCR.
Hard money
10% down · 12.0% · 12mo
- Down + closing
- —
- Monthly P&I
- —
- Monthly cashflow
- —
- DSCR
- —
- Eligible?
- —
Short-term bridge; refi at stabilization.
Rent comps 11 comps
| Address | Beds | Baths | Sqft | Rent | $/sqft | DOM | Units | Dist |
|---|---|---|---|---|---|---|---|---|
| 882 N Colony Rd Meriden, CT | 2.0 | 1.5 | 1232 | $3,000 | $2.44 | 10d | 1 | 0.73mi |
| 200 Sams Rd Meriden, CT | 2.0–3.0 | 1.5–2.5 | 855 | $2,200 | $2.57 | 1d | 4 | 0.99mi |
| 153 Sams Rd Meriden, CT | 2.0 | 2.5 | 1320 | $2,450 | $1.86 | 1d | 1 | 1.15mi |
| 19 Cambridge St Unit 2 Meriden, CT | 3.0 | 1.0 | 1100 | $2,100 | $1.91 | 44d | 1 | 1.24mi |
| 109 Blackstone St Unit 109 Meriden, CT | 2.0 | 1.5 | 1056 | $2,100 | $1.99 | 23d | 1 | 1.24mi |
| 250 Kensington Ave Meriden, CT | 2.0 | 1.0 | 1200 | $1,885 | $1.57 | 1d | 1 | 1.30mi |
| 120 Wilcox Ave #3 Meriden, CT | 2.0 | 1.0 | 1200 | $1,750 | $1.46 | 19d | 1 | 1.39mi |
| 120 Wilcox Ave Unit 2 Meriden, CT | 3.0 | 1.0 | 1250 | $2,000 | $1.60 | 11d | 1 | 1.39mi |
| 61 Colony Pl Unit 3B Furnished Meriden, CT | 1.0 | 1.0 | 1200 | $1,695 | $1.41 | 23d | 1 | 1.43mi |
| 17 Sherman Ave Unit 3rd Meriden, CT | 3.0 | 1.0 | 1088 | $2,300 | $2.11 | 44d | 1 | 1.46mi |
| 300 Britannia St Meriden, CT | 1.0–4.0 | 1.0–2.0 | 980 | $1,928 | $1.97 | 2d | 8 | 1.47mi |
Listing history 9 events
-
2026-06-14statusdays on market $239,000 Under Contract 6 DOM
-
2026-06-10statusdays on market $239,000 Under Contract - Continue to Show 5 DOM
-
2026-06-09days on market $239,000 Active 4 DOM
-
2026-06-08days on market $239,000 Active 3 DOM
-
2026-06-07statusdays on market $239,000 Active 2 DOM
-
2026-06-05days on market $239,000 Coming Soon 3 DOM
-
2026-06-03days on market $239,000 Coming Soon 2 DOM
-
2026-06-02remarks 699-char remark
-
2026-06-02$239,000 Coming Soon 1 DOM
ⓘ Source: listings_history table (triggers on properties + properties_extension) + one-shot
backfill from property_details.listing_events for pre-trigger history.
Tax reassessment forecast CT · Partial reset (capped growth)
- Current annual tax
- $3,597 · $300/mo
- Projected year-2 tax
- $4,356 · $363/mo
- Expected delta
- +$759/yr (+$63/mo · 21.1%)
ⓘ Screening estimate from a state-policy table — verify with the county assessor before closing.
Climate risk First Street
- Flood 1/10 Low FEMA zone X (unshaded) · 0% chance over 30 yrs
- Wildfire 1/10 Low
- Heat 5/10 Major 7 d/yr ≥99°F today · 16 d/yr by 30 yrs out
- Wind 6/10 Major 27% chance of damaging wind over 30 yrs
- Air quality 3/10 Moderate 3 unhealthy d/yr today · 4 by 30 yrs out
Nearby sold comps map
Loading sold comps map…
Walkable amenities ~0.75 mi
Loading nearby amenities…
Taxation est. · year 1
- Rental income
- $24,782
- − Mortgage interest
- −$13,388
- − Property taxes
- −$3,597
- − Insurance
- −$1,195
- − Repairs & maintenance
- −$1,983
- − Management
- −$1,983
- − Depreciation
- −$6,953
- Taxable loss
- −$4,315
- Est. tax savings @ 24.0%
- +$1,036
- After-tax cash flow
- $782/yr
For passive investors: Depreciation is non-cash, so a rental often shows a tax loss while cash-flowing — sheltering income. Rental losses are passive: they offset passive income freely, and up to $25,000/yr can offset ordinary (W-2) income if you actively participate and your MAGI is under $100k (phasing out to $0 by $150k); unused losses carry forward. On sale, claimed depreciation is recaptured at up to 25%, and gains may owe capital-gains tax (a 1031 exchange can defer both). Figures are a year-1 estimate at your 24.0% rate — not tax advice; consult a CPA.
Schools (NCES district)
- District
- Meriden School District
- NCES district ID
- 0902400
- Math proficiency
- 27% ▼ -8.00%
- Reading proficiency
- 41% ▼ -6.00%
- Median HH income
- $53,883
- Composite
- 29.84/100
- National rank
- #6413
- State rank
- #116 of 153 in CT
Livability — Meriden
- Score
- 85/100
- State rank
- #4
- US rank
- #505
Category grades
Schools grade is shown separately in the Schools card above.
Census & demographics
- Census place
- Meriden, CT
- County
- New Haven County · 688,236 people
- City population
- 60,545
- Metro
- New Haven-Milford, CT
- Population (ZIP)
- 24,851
- Household income
- $71,255
- Rent vs Own
- Severe rent burden
- 973.0
Population outlook (South Central Connecticut County) Hauer SSP2
- By 2040
- 608,362
Race, ethnicity, and origin ACS 2023
- Neighborhood character
- Diverse neighborhood (Simpson 0.62)
- Race & ethnicity
- White 46% Hispanic / Latino 40% Two or more races 26% Black 8% Asian 2%
- Hispanic origin (detail)
- Mexican 4% Puerto Rican 24% Cuban 2% Dominican 2%
- Common ancestry
- Romanian 5% Lithuanian 4% Subsaharan African 1%
- Foreign-born
- 11% · Canada, Jamaica, China
- Languages at home
- 65% English-only · Spanish 31% Chinese 1% French/Haitian/Cajun 1%
Political lean MEDSL · South Central Connecticut
- 2024 margin
- Strong D (+20.1) · D 59.0% · R 38.9% · Other 2.1%
- All cycles
- 2024: D+20.1
Not yet ingested
- Civics
- —
Market trends
- HPI YoY
- ▼ -45.38%
- Current HPI
- 274.0567
- Rent YoY
- —
- Metro
- New Haven-Milford, CT
- State GDP YoY
- ▲ 1.06%
- F500 in state
- 38
Industry mix (Fortune 500 HQ in CT)
| Industry | F500 HQs | Revenue |
|---|---|---|
| Industrial Machinery | 4 | $38B |
|
||
| Insurance | 3 | $71B |
|
||
| Financial Services | 2 | $25B |
|
||
| Transportation / Logistics | 2 | $18B |
|
||
| Healthcare | 1 | $247B |
|
||
| Telecommunications | 1 | $55B |
|
||
Price history
+70.8% since first listed5 events — show timeline
- 2026-06-01 Coming Soon $239,000 Smart MLS
- 2019-07-16 Sold (Public Records) $125,000 Public Records
- 2019-01-12 Listing Removed — Smart MLS
- 2018-12-14 Price Changed $134,900 Smart MLS
- 2018-07-11 Listed $139,900 Smart MLS
Property tax history
-1.6%/yrLatest (2023): $3,597 · +5.5% YoY. Source: county tax records.
Cash-flow waterfall
monthlySold comps — $/sqft
last 12 mo · ≤1 miLoading sold comps…