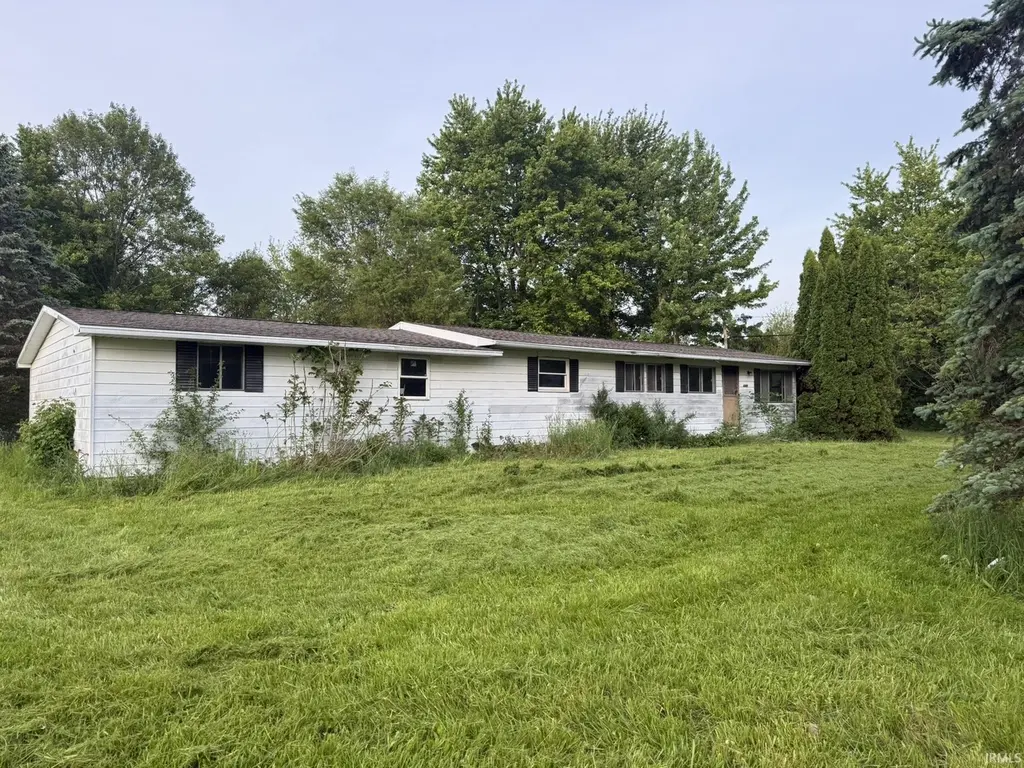
4377 S US 33 Hwy · Merriam, IN
Flood risk 1/10 · Minimal
- FEMA flood zone
- X (unshaded)
- Chance of flooding over 30 yrs
- 0.0%
- Est. flood insurance / yr
- $473 – $860
Fire risk 1/10 · Minimal
- Est. fire insurance / yr
- $717 – $1,331
Heat risk 2/10 · Minimal
- Hot days now (above 99°F)
- 7 days/yr
- Hot days in 30 yrs
- 17 days/yr
Wind risk 2/10 · Minimal
- Chance of severe wind over 30 yrs
- —
Air-quality risk 2/10 · Minimal
- Unhealthy air days now
- 1 days/yr
- Unhealthy air days in 30 yrs
- 1 days/yr
Risk factors via First Street. Map © Google.
Why this score? — see what drove the B- grade
The composite is a weighted blend of 9 inputs, each scored 0–100. Each bar is that input's sub-score; the figure is the points it added to the 100-point composite (weight × sub-score).
- Cash flow +30.0/30.0
- 1% rule +10.0/10.0
- DSCR +10.0/10.0
- ARV discount +7.5/15.0
- Schools +2.9/10.0
- Rent growth +2.5/5.0
- Livability +2.5/5.0
- Condition / age +2.5/5.0
- Appreciation +0.0/10.0
$65,000
🖨 Deal sheet (PDF) 📄 Offer letter ✓ Due diligence
Listing remarks
Rough Ranch, Needs complete rehab including new joists in kitchen area. Home is rough, This potential 3 bedroom 2 bath ranch on full basement with 2 car attached garage is situated on a 1/2 acre lot Being sold as/is. Use extreme caution as a portion of the house has no floor/joists. Home has been vacant a long time. One positive the home has a recent complete NEW tear off and reroof. Ideal for a contractor or someone looking to flip. Listing agent does seller representation only, some dimensions are approximate, information is believed accurate but is not guaranteed and should be verified.
Key facts
- 1/2 acre lot
- 0.5 acre lot
- 2 garage spots
Tags
Property features AI
Exterior
- Parking: Attached 2-car garage
- Utilities: Private well water; Septic tank sewer
- Home design: Single-family site-built home; Single-story
- Construction: Aluminum siding
- Exterior features: Level lot; Lot dimensions approximately 200 x 100 (0.5 acre)
Interior
- Bedrooms: Total of 6 rooms (bedroom count not specified)
- Bathrooms: Two full bathrooms, both on the main level
- Heating & cooling: Natural gas heating; No central cooling
- Interior features: Full unfinished basement
- Laundry & utility: Laundry in the basement
Neighborhood map
What this means for you Summary
Snapshot
- This is a 2-bed/1.0-bath single-family listed at $65k.
Deal economics
- At list price, monthly cash flow is $479 ($6k/yr) — positive.
- The deal already cash-flows at list — no discount required.
- Meets the 1% rule at list price ($1k rent vs $65k).
- Recommended offer: $64k (1.5% below list) — sets the bar for market timing.
Location & tenants
- Location reads: area grade B — affects rentability + tenant quality, not the cash-flow math above.
- Central Noble Community School Corporation (rural): math 32% / reading 34% proficiency, ranked #207 of 301 in IN (top 69%) — families likely to look elsewhere, expect single-tenant / working-renter base with shorter leases.
- Zoned schools: Central Noble Primary School (249 students, 47% FRL); Central Noble Junior Senior Hs (math 23% / reading 37%, grade F, #307 of 369 statewide, top 83%, 654 students, 46% FRL) — zoned schools average 46% FRL vs 31% district-wide (16 pts higher); higher-poverty schools than district average — tighter screening recommended.
- Market conditions: 29 active listings in the ZIP; 131 units permitted in Noble County in 2024 (0 in 5+ unit buildings).
Forward outlook
- Local home prices are declining (-3.0%/yr); year-one equity from $449 of loan paydown is wiped out by about $2k of value loss. Plan a longer hold.
- Noble County population projected to shrink 8% by 2050 — rents likely to lag national; underwrite the cash flow, not the appreciation.
- At projected returns (-3.0% appreciation + 3.0% rent growth), your $18k cash investment doubles in ~4 years — after that, you're playing with house money.
Negotiation context
- It's been on market 28 days — a 2% lower offer ($64k) is reasonable based on typical stale-listing flexibility.
- 2 sale attempts with the ask held roughly flat each time — persistent listings suggest the price (not the market) is what's stuck; bring a comps-based counter.
Questions for the listing agent
- Built in 1967 — when were the roof, HVAC, electrical panel, plumbing, and water heater last replaced?
- Is there a deadline driving the sale (1031 exchange, divorce, estate, relocation)? That informs how much negotiation room exists.
- What's the average days-on-market for RENTAL listings here right now (not sales)? A rising rental-DOM trend means longer vacancies and softer asking-rent achievability than the comps imply.
- What's the recent tenant-quality profile in this submarket — average credit score on applications, eviction rate, late-payment / NSF rate, and stable-employment percentage? A property-management company in the area should have these aggregated.
- How much new for-sale + rental construction is in the pipeline within 1–3 miles? Heavy new supply typically softens prices + rents 12–24 months out; constrained supply supports both.
Investment metrics
- 1% rule
- 1.79% ✓
- Cap rate
- 15.13%
- Cash-on-cash
- 31.57%
- DSCR
- 2.40
- GRM
- 4.7
CMA / ARV
- ARV (on-the-fly)
- $170,496
- Comps found
- 1
Show comp detail 1 sale within ~0.75 mi
| Address | Dist | Beds/Ba | Sqft | Sold | Price | $/sf | Match |
|---|---|---|---|---|---|---|---|
| 4352 S Oak St | 0.06mi | 3/2.0 (+1) | 1,287 (+12%) | 8mo | $189,900 | $148 | 62 |
Match score weights: distance 35% · size 25% · config 20% · recency 20%. Top-matched comps best support the ARV.
Projected returns pro-forma
-3.0% appreciation · 3.0% rent growth · sell at horizon
- IRR
- 26.5%
- Equity multiple
- 2.10×
- Total profit
- $19,974
- Equity at exit
- $9,692
- IRR
- 34.1%
- Equity multiple
- 4.12×
- Total profit
- $56,705
- Equity at exit
- $5,620
Cash invested: $18,200 (down + closing). Projections, not guarantees.
Landlord ↔ Tenant lean methodology
- Overall (STATE)
- 90 Strongly Landlord-Friendly
- State Indiana
- 90 Strongly Landlord-Friendly · R+11
- County
- — inherits STATE
- City
- — inherits STATE
ZIP-level market 46701
- Home prices YoY
- -16.8%
- Active inventory
- 29
- Price-to-rent
- 4.7×
Monthly cashflow live
- Estimated rent
- $1,161 medium interval (Pro) →
- Mortgage (P&I)
- −$341
- Tax from tax record
- −$70 /mo · $843/yr
- Insurance
- −$27
- HOA
- −$0
- Vacancy / Maint / Mgmt
- −$244
- Net cashflow
- $479
Break-even live
Sensitivity live
| Price | -10% $516 | -5% $497 | +0% $479 | +5% $460 | +10% $442 |
|---|---|---|---|---|---|
| Rent | -10% $387 | -5% $433 | +0% $479 | +5% $525 | +10% $571 |
| Rate | -1.0pp $512 | -0.5pp $495 | base $479 | +0.5pp $462 | +1.0pp $445 |
UW: 25.0% down · 7.5% · 30yr · 1.5% tax · 5.0% vac · 8.0% maint · 8.0% mgmt
Financing live
Cash to close
- Down payment
- $16,250
- Closing costs
- $1,950
- Reserves months
- —
- Total cash needed
- —
Loan-product check · same deal, 3 products live
Conventional
25% down · 7.5% · 30yr
- Down + closing
- —
- Monthly P&I
- —
- Monthly cashflow
- —
- DSCR
- —
- Eligible?
- —
Personal DTI + credit; lowest rate.
DSCR
20% down · 8.5% · 30yr
- Down + closing
- —
- Monthly P&I
- —
- Monthly cashflow
- —
- DSCR
- —
- Eligible?
- —
No personal income docs; deal must DSCR.
Hard money
10% down · 12.0% · 12mo
- Down + closing
- —
- Monthly P&I
- —
- Monthly cashflow
- —
- DSCR
- —
- Eligible?
- —
Short-term bridge; refi at stabilization.
Listing history 19 events
-
2026-06-22days on market $65,000 Active 28 DOM
-
2026-06-21days on market $65,000 Active 27 DOM
-
2026-06-21days on market $65,000 Active 26 DOM
-
2026-06-18days on market $65,000 Active 24 DOM
-
2026-06-17days on market $65,000 Active 23 DOM
-
2026-06-16days on market $65,000 Active 22 DOM
-
2026-06-15days on market $65,000 Active 21 DOM
-
2026-06-13days on market $65,000 Active 19 DOM
-
2026-06-12days on market $65,000 Active 18 DOM
-
2026-06-09days on market $65,000 Active 15 DOM
-
2026-06-08days on market $65,000 Active 14 DOM
-
2026-06-07days on market $65,000 Active 13 DOM
-
2026-06-04days on market $65,000 Active 9 DOM
-
2026-06-02days on market $65,000 Active 8 DOM
-
2026-06-01days on market $65,000 Active 7 DOM
-
2026-05-31days on market $65,000 Active 6 DOM
-
2026-05-31days on market $65,000 Active 5 DOM
-
2026-05-26$65,000 Active
-
2026-03-18$79,000 Active
ⓘ Source: listings_history table (triggers on properties + properties_extension) + one-shot
backfill from property_details.listing_events for pre-trigger history.
Tax reassessment forecast IN · Partial reset (capped growth)
- Current annual tax
- $843 · $70/mo
- Projected year-2 tax
- $843 · $70/mo
- Expected delta
- $0/yr ($0/mo · 0.0%)
ⓘ Screening estimate from a state-policy table — verify with the county assessor before closing.
Climate risk First Street
- Flood 1/10 Low FEMA zone X (unshaded) · 0% chance over 30 yrs
- Wildfire 1/10 Low
- Heat 2/10 Low 7 d/yr ≥99°F today · 17 d/yr by 30 yrs out
- Wind 2/10 Low
- Air quality 2/10 Low 1 unhealthy d/yr today · 1 by 30 yrs out
Nearby sold comps map
Loading sold comps map…
Walkable amenities ~0.75 mi
Loading nearby amenities…
Taxation est. · year 1
- Rental income
- $13,930
- − Mortgage interest
- −$3,641
- − Property taxes
- −$843
- − Insurance
- −$325
- − Repairs & maintenance
- −$1,114
- − Management
- −$1,114
- − Depreciation
- −$1,891
- Taxable income
- $5,001
- Est. tax owed @ 24.0%
- −$1,200
- After-tax cash flow
- $4,546/yr
For passive investors: Depreciation is non-cash, so a rental often shows a tax loss while cash-flowing — sheltering income. Rental losses are passive: they offset passive income freely, and up to $25,000/yr can offset ordinary (W-2) income if you actively participate and your MAGI is under $100k (phasing out to $0 by $150k); unused losses carry forward. On sale, claimed depreciation is recaptured at up to 25%, and gains may owe capital-gains tax (a 1031 exchange can defer both). Figures are a year-1 estimate at your 24.0% rate — not tax advice; consult a CPA.
Schools (NCES district)
- District
- Central Noble Community School Corporation
- NCES district ID
- 1801710
- Math proficiency
- 32% ▼ -1.00%
- Reading proficiency
- 34% ▼ -7.00%
- Median HH income
- $48,911
- Composite
- 28.58/100
- National rank
- #6718
- State rank
- #207 of 301 in IN
Livability — Merriam
No livability data for this city. (Only ~50 U.S. cities are tracked.)
Census & demographics
- Census place
- Merriam, IN
- Population (ZIP)
- 8,186
Population outlook (Noble County) Hauer SSP2
- Today (2025)
- 48,321 people
- By 2030
- 47,945 · -0.8%
- By 2040
- 46,521 · -3.7%
- By 2050
- 44,501 · -7.9%
- By 2075
- 38,962 · -19.4%
- By 2100
- 31,846 · -34.1%
Race, ethnicity, and origin ACS 2023
- Neighborhood character
- Predominantly White (95%)
- Race & ethnicity
- White 95% Two or more races 3% Hispanic / Latino 2%
- Common ancestry
- Italian 13% Romanian 3% Lithuanian 3%
- Foreign-born
- 1% · Canada
- Languages at home
- 98% English-only · Spanish 1% French/Haitian/Cajun 1% German/W. Germanic 1%
Political lean MEDSL · Noble
- 2024 margin
- Solid R (+51.4) · D 23.5% · R 74.9% · Other 1.5%
- 2008→2024 swing
- -36.0pp toward R · 2008: -15.4pp · 2024: -51.4pp
- All cycles
- 2024: R+51.4 2020: R+49.7 2016: R+49.1 2012: R+33.6 2008: R+15.4
Not yet ingested
- Civics
- —
Market trends
- HPI YoY
- ▼ -50.57%
- Current HPI
- 250.7517
- Rent YoY
- —
- Metro
- —
- State GDP YoY
- ▲ 2.90%
- F500 in state
- 18
Industry mix (Fortune 500 HQ in IN)
| Industry | F500 HQs | Revenue |
|---|---|---|
| Industrial Machinery | 2 | $37B |
|
||
| Healthcare | 1 | $177B |
|
||
| Pharmaceuticals | 1 | $45B |
|
||
| Metals / Steel | 1 | $18B |
|
||
| Agriculture | 1 | $17B |
|
||
| Packaging | 1 | $12B |
|
||
Price history
-17.7% since first listed2 events — show timeline
- 2026-05-26 Listed $65,000 IRMLS
- 2026-03-18 Listed $79,000 IRMLS
Property tax history
-2.8%/yrLatest (2024): $843 · -1.5% YoY. Source: county tax records.
Cash-flow waterfall
monthlySold comps — $/sqft
last 12 mo · ≤1 miLoading sold comps…