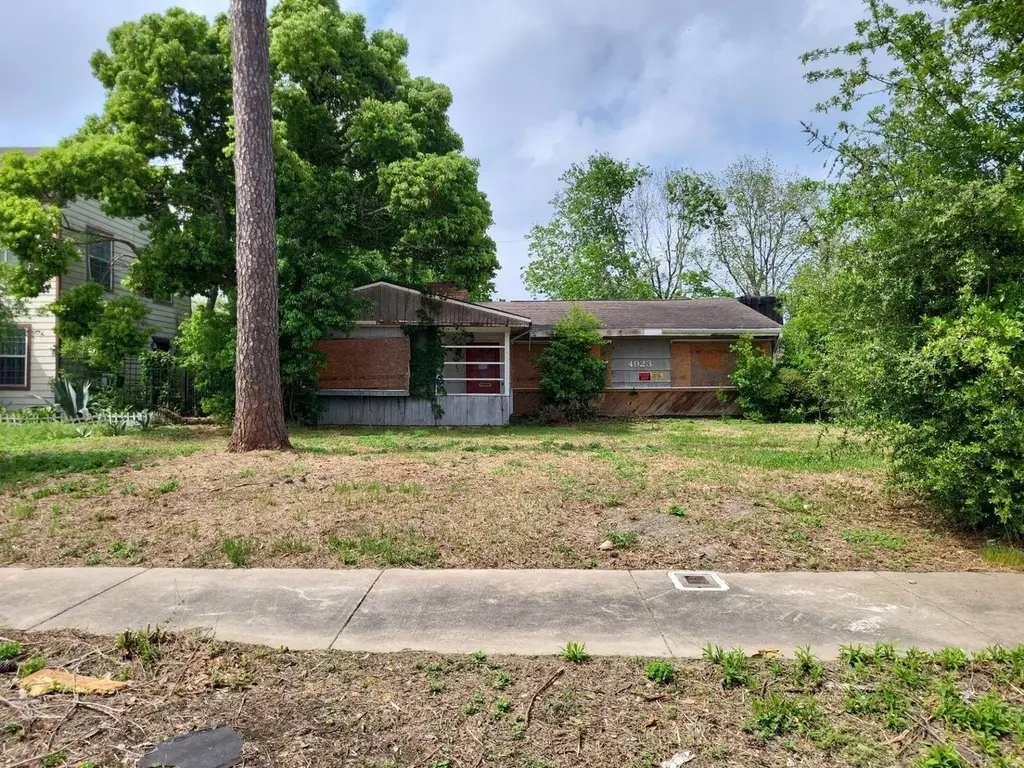
4923 Winnetka St · Houston, TX
Flood risk 6/10 · Moderate
- FEMA flood zone
- X (unshaded)
- Chance of flooding over 30 yrs
- 0.72%
- Est. flood insurance / yr
- $507 – $1,088
Fire risk 1/10 · Minimal
- Est. fire insurance / yr
- $1,222 – $2,270
Heat risk 9/10 · Severe
- Hot days now (above 109°F)
- 7 days/yr
- Hot days in 30 yrs
- 24 days/yr
Wind risk 9/10 · Severe
- Chance of severe wind over 30 yrs
- 99.0%
Air-quality risk 2/10 · Minimal
- Unhealthy air days now
- 2 days/yr
- Unhealthy air days in 30 yrs
- 2 days/yr
Risk factors via First Street. Map © Google.
Why this score? — see what drove the B- grade
The composite is a weighted blend of 9 inputs, each scored 0–100. Each bar is that input's sub-score; the figure is the points it added to the 100-point composite (weight × sub-score).
- Cash flow +30.0/30.0
- 1% rule +10.0/10.0
- DSCR +10.0/10.0
- ARV discount +7.5/15.0
- Livability +3.7/5.0
- Rent growth +3.0/5.0
- Schools +2.7/10.0
- Condition / age +2.5/5.0
- Appreciation +0.0/10.0
$149,900
🖨 Deal sheet 📄 Offer letter ✓ Due diligence
Listing remarks
This is your chance to own an exceptional property on an oversized lot! Just minutes from MacGregor Park, Brays Bayou, Hermann Park, TDECU Stadium, and NRG. Ideal site for a custom single-family home or speculative build. Excellent opportunity for builders or investors seeking new construction potential in a rapidly evolving area. Perfect site for your next custom or spec home project. Bring your plans and take advantage of this centrally located infill opportunity.
Key facts
- Speculative build
- Oversized lot
- 5,998 sq ft lot
Tags
Property features AI
Finance
- Other: Special addendum disclosure
Exterior
- Parking: Detached garage with 1 parking space
- Utilities: Public water; Public sewer
- Home design: Residential property; Single-story entry (first level)
- Construction: Built in 1950; Wood siding construction; Composition roof; Slab foundation
- Exterior features: Subdivision lot
Interior
- Kitchen: Kitchen (combined with dining)
- Bedrooms: Primary bedroom (first level) — 14x11; Bedroom (first level) — 12x10; Bedroom (first level) — 10x10; Bedroom (first level) — 10x10
- Flooring: Wood flooring
- Bathrooms: 2 full bathrooms
- Heating & cooling: Window-unit heating; Window-unit cooling
- Interior features: Tub with shower; Kitchen and dining combined
Neighborhood map
What this means for you Summary
Snapshot
- This is a 4-bed/2.0-bath single-family listed at $150k.
Deal economics
- At list price, monthly cash flow is $823 ($10k/yr) — positive.
- The deal already cash-flows at list — no discount required.
- Meets the 1% rule at list price ($3k rent vs $150k).
- Recommended offer: $148k (1.5% below list) — sets the bar for market timing.
- Cap rate 12.9% vs local median 3.2% in Houston — top-decile yield for the area; either an underpriced asset or a hidden risk that comps aren't pricing in. Stress-test before assuming the spread holds.
Location & tenants
- Location reads 74/100 on livability (#184 in TX, #4,771 nationally) — a middle-class / working-renter tenant base. Strengths: amenities A+, cost of living A+, housing A+; Watch: crime F.
- Houston ISD (urban): math 27% / reading 35% proficiency, ranked #593 of 826 in TX (top 72%) — families likely to look elsewhere, expect single-tenant / working-renter base with shorter leases; 71% free/reduced lunch — lower-income household profile, screen leases tightly.
- Zoned schools: Cullen Middle (math 6% / reading 14%, grade F, #1,641 of 1,662 statewide, top 99%, 324 students, 100% FRL); Yates H S (math 12% / reading 23%, grade F, #1,451 of 1,632 statewide, top 89%, 851 students, 96% FRL) — zoned schools average 98% FRL vs 71% district-wide (27 pts higher); higher-poverty schools than district average — tighter screening recommended.
- Zoned-school proficiency averages 14% at this address vs 31% district-wide (-17 pts) — the specific schools serving this property underperform the Houston ISD average; the district grade overstates school quality for this exact location.
- Market conditions: Rents rising (+2.2%/yr); 467 active listings in the ZIP; 6 comparable units currently listed for rent nearby; rentals lingering (median 44d on market — plan ~5-8 weeks vacancy on turnover, expect pricing pressure); 50% of comp listings sitting > 30 days — soft ceiling on asking rent; 29,883 units permitted in Harris County in 2024 (8,621 in 5+ unit buildings).
Forward outlook
- Local home prices are declining (-3.0%/yr); year-one equity from $1k of loan paydown is wiped out by about $4k of value loss. Plan a longer hold.
- Harris County population projected at +47% by 2050 — long-run rental-demand tailwind backs the buy-and-hold thesis.
- At projected returns (-3.0% appreciation + 2.2% rent growth), your $42k cash investment doubles in ~6 years — after that, you're playing with house money.
Negotiation context
- It's been on market 23 days — a 2% lower offer ($148k) is reasonable based on typical stale-listing flexibility.
- 4 sale attempts since 4y ago with the ask held roughly flat each time — persistent listings suggest the price (not the market) is what's stuck; bring a comps-based counter.
Risks & watch-outs
- Watch-outs: property tax is 2.9% of price; built in 1950 — expect roof / HVAC / electrical / plumbing capex.
- Climate carrying-cost: major flood risk; severe wind risk, 99% chance of damaging wind over 30y; extreme-heat days projected 7→24/yr by 2055 (HVAC capex compounding) — expect insurance premiums to compound above CPI over the hold.
Questions for the listing agent
- Built in 1950 — when were the roof, HVAC, electrical panel, plumbing, and water heater last replaced?
- Property tax is high relative to price — has the assessment been appealed recently, and will the sale trigger a re-assessment?
- Is there a deadline driving the sale (1031 exchange, divorce, estate, relocation)? That informs how much negotiation room exists.
- Schools are D-rated, which usually means shorter tenancies and higher turnover. Who's the typical renter profile here, and what's been the actual vacancy rate?
- Crime grade is F in this area — have there been break-ins, vandalism, or insurance claims at this property in the last 3 years? What carrier currently insures it and at what premium?
- What's the average days-on-market for RENTAL listings here right now (not sales)? A rising rental-DOM trend means longer vacancies and softer asking-rent achievability than the comps imply.
- What's the recent tenant-quality profile in this submarket — average credit score on applications, eviction rate, late-payment / NSF rate, and stable-employment percentage? A property-management company in the area should have these aggregated.
- How much new for-sale + rental construction is in the pipeline within 1–3 miles? Heavy new supply typically softens prices + rents 12–24 months out; constrained supply supports both.
Investment metrics
- 1% rule
- 1.72% ✓
- Cap rate
- 12.88%
- Cash-on-cash
- 23.52%
- DSCR
- 2.05
- GRM
- 4.8
CMA / ARV
- ARV (on-the-fly)
- $493,536
- Comps found
- 11
Show comp detail 11 sales within ~0.75 mi
| Address | Dist | Beds/Ba | Sqft | Sold | Price | $/sf | Match |
|---|---|---|---|---|---|---|---|
| 4833 Winnetka St Unit C | 0.10mi | 4/3.0 | 2,800 (+10%) | 13mo | $588,000 | $210 | 64 |
| 5402 Tallow Ln | 0.32mi | 4/2.0 | 2,294 (-10%) | 11mo | $259,900 | $113 | 60 |
| 5207 Cortelyou Ln | 0.60mi | 5/2.0 (+1) | 2,611 (+3%) | 6mo | $190,000 | $73 | 58 |
| 4906 Gammage St | 0.37mi | 3/2.0 (-1) | 2,335 (-8%) | 17mo | $470,000 | $201 | 50 |
| 4955 Culmore Dr | 0.26mi | 4/3.0 | 2,868 (+13%) | 16mo | $567,890 | $198 | 50 |
| 4365 Fiesta Lane Ln | 0.71mi | 4/2.5 | 2,428 (-5%) | 10mo | $474,800 | $196 | 49 |
| 4107 Charleston St | 0.68mi | 3/2.0 (-1) | 2,326 (-9%) | 6mo | $349,900 | $150 | 44 |
| 4211 Charleston St | 0.62mi | 3/2.5 (-1) | 2,290 (-10%) | 5mo | $379,000 | $166 | 43 |
| 4401 Fernwood Dr | 0.45mi | 3/2.5 (-1) | 2,304 (-9%) | 21mo | $450,000 | $195 | 39 |
| 4385 Fiesta Ln | 0.62mi | 4/3.0 | 2,912 (+14%) | 13mo | $565,000 | $194 | 33 |
| 4341 N Macgregor Way | 0.66mi | 3/2.0 (-1) | 2,285 (-10%) | 19mo | $350,000 | $153 | 32 |
Match score weights: distance 35% · size 25% · config 20% · recency 20%. Top-matched comps best support the ARV.
Projected returns pro-forma
-3.0% appreciation · 2.17% rent growth · sell at horizon
- IRR
- 15.6%
- Equity multiple
- 1.62×
- Total profit
- $26,113
- Equity at exit
- $22,351
- IRR
- 23.7%
- Equity multiple
- 2.96×
- Total profit
- $82,185
- Equity at exit
- $12,961
Cash invested: $41,972 (down + closing). Projections, not guarantees.
Landlord ↔ Tenant lean methodology
- Overall (STATE)
- 87 Strongly Landlord-Friendly
- State Texas
- 87 Strongly Landlord-Friendly · R+5
- County
- — inherits STATE
- City
- — inherits STATE
ZIP-level market 77021
- Home prices YoY
- -23.6%
- Rents YoY
- 2.2%
- Active inventory
- 467
- Price-to-rent
- 4.8×
Monthly cashflow live
- Estimated rent
- $2,578 high interval (Pro) →
- Mortgage (P&I)
- −$786
- Tax from tax record
- −$366 /mo · $4,387/yr
- Insurance
- −$62
- HOA
- −$0
- Vacancy / Maint / Mgmt
- −$541
- Net cashflow
- $823
Break-even live
UW: 25.0% down · 7.5% · 30yr · 1.5% tax · 5.0% vac · 8.0% maint · 8.0% mgmt
Financing live
Cash to close
- Down payment
- $37,475
- Closing costs
- $4,497
- Reserves months
- —
- Total cash needed
- —
Loan-product check · same deal, 3 products live
Conventional
25% down · 7.5% · 30yr
- Down + closing
- —
- Monthly P&I
- —
- Monthly cashflow
- —
- DSCR
- —
- Eligible?
- —
Personal DTI + credit; lowest rate.
DSCR
20% down · 8.5% · 30yr
- Down + closing
- —
- Monthly P&I
- —
- Monthly cashflow
- —
- DSCR
- —
- Eligible?
- —
No personal income docs; deal must DSCR.
Hard money
10% down · 12.0% · 12mo
- Down + closing
- —
- Monthly P&I
- —
- Monthly cashflow
- —
- DSCR
- —
- Eligible?
- —
Short-term bridge; refi at stabilization.
Rent comps 6 comps
| Address | Beds | Baths | Sqft | Rent | $/sqft | DOM | Units | Dist |
|---|---|---|---|---|---|---|---|---|
| 4907 Culmore Dr Houston, TX | 4.0 | 2.0 | 1800 | $2,700 | $1.50 | 16d | 1 | 0.30mi |
| 4135 DuPont St Houston, TX | 3.0 | 4.0 | 2395 | $2,499 | $1.04 | 43d | 1 | 0.92mi |
| 5130 Cosby St Unit 1056418P Houston, TX | 5.0 | 3.0 | 2045 | $6,283 | $3.07 | 2d | 1 | 1.02mi |
| 3535 Wentworth St Houston, TX | 4.0 | 3.0 | 2600 | $2,650 | $1.02 | 22d | 1 | 1.30mi |
| 6731 New York St Houston, TX | 3.0 | 3.0 | 2211 | $2,100 | $0.95 | 43d | 1 | 1.42mi |
| 5321 Malmedy Rd Houston, TX | 3.0 | 2.5 | 3292 | $2,200 | $0.67 | 43d | 1 | 1.49mi |
Listing history 28 events
-
2026-06-18days on market $149,900 Active 23 DOM
-
2026-06-17days on market $149,900 Active 22 DOM
-
2026-06-16days on market $149,900 Active 21 DOM
-
2026-06-15days on market $149,900 Active 20 DOM
-
2026-06-13days on market $149,900 Active 18 DOM
-
2026-06-09days on market $149,900 Active 14 DOM
-
2026-06-08days on market $149,900 Active 13 DOM
-
2026-06-07days on market $149,900 Active 12 DOM
-
2026-06-04days on market $149,900 Active 9 DOM
-
2026-06-03days on market $149,900 Active 8 DOM
-
2026-06-02days on market $149,900 Active 7 DOM
-
2026-06-01days on market $149,900 Active 6 DOM
-
2026-05-31days on market $149,900 Active 5 DOM
-
2026-05-22$149,900 Active
-
2026-02-06historical
-
2025-11-06price $174,900
-
2025-08-20price $189,900
-
2025-06-16price $199,900
-
2025-05-09price $209,900
-
2025-04-02status Active
-
2025-03-18historical
-
2025-03-12$219,900 Active
-
2022-06-10historical
-
2022-05-05$297,000 Active
-
2021-08-04soldstatus
-
2021-08-04soldstatus
-
2020-12-07soldstatus
-
1988-01-02soldstatus
ⓘ Source: listings_history table (triggers on properties + properties_extension) + one-shot
backfill from property_details.listing_events for pre-trigger history.
Tax reassessment forecast TX · Resets to sale price
- Current annual tax
- $4,387 · $366/mo
- Projected year-2 tax
- $4,387 · $366/mo
- Expected delta
- $0/yr ($0/mo · 0.0%)
ⓘ Screening estimate from a state-policy table — verify with the county assessor before closing.
Climate risk First Street
- Flood 6/10 Major FEMA zone X (unshaded) · 72% chance over 30 yrs
- Wildfire 1/10 Low
- Heat 9/10 Extreme 7 d/yr ≥109°F today · 24 d/yr by 30 yrs out
- Wind 9/10 Extreme 99% chance of damaging wind over 30 yrs
- Air quality 2/10 Low 2 unhealthy d/yr today · 2 by 30 yrs out
Nearby sold comps map
Loading sold comps map…
Walkable amenities ~0.75 mi
Loading nearby amenities…
Taxation est. · year 1
- Rental income
- $30,938
- − Mortgage interest
- −$8,397
- − Property taxes
- −$4,387
- − Insurance
- −$750
- − Repairs & maintenance
- −$2,475
- − Management
- −$2,475
- − Depreciation
- −$4,361
- Taxable income
- $8,093
- Est. tax owed @ 24.0%
- −$1,942
- After-tax cash flow
- $7,928/yr
For passive investors: Depreciation is non-cash, so a rental often shows a tax loss while cash-flowing — sheltering income. Rental losses are passive: they offset passive income freely, and up to $25,000/yr can offset ordinary (W-2) income if you actively participate and your MAGI is under $100k (phasing out to $0 by $150k); unused losses carry forward. On sale, claimed depreciation is recaptured at up to 25%, and gains may owe capital-gains tax (a 1031 exchange can defer both). Figures are a year-1 estimate at your 24.0% rate — not tax advice; consult a CPA.
Schools (NCES district)
- District
- Houston ISD
- NCES district ID
- 4823640
- Math proficiency
- 27% ▼ -18.00%
- Reading proficiency
- 35% ▼ -6.00%
- Median HH income
- $46,054
- Composite
- 26.63/100
- National rank
- #7173
- State rank
- #593 of 826 in TX
Livability — Houston
- Score
- 74/100
- State rank
- #184
- US rank
- #4771
Category grades
Schools grade is shown separately in the Schools card above.
Census & demographics
- Census place
- Houston, TX
- County
- Harris County · 4,702,590 people
- City population
- 3,226,434
- Metro
- Houston-The Woodlands-Sugar Land, TX
- Population (ZIP)
- 26,153
- Household income
- $45,574
- Rent vs Own
- Severe rent burden
- 2532.0
Population outlook (Harris County) Hauer SSP2
- Today (2025)
- 5,571,493 people
- By 2030
- 6,089,821 · +9.3%
- By 2040
- 7,142,806 · +28.2%
- By 2050
- 8,185,864 · +46.9%
- By 2075
- 10,574,329 · +89.8%
- By 2100
- 12,109,958 · +117.4%
Race, ethnicity, and origin ACS 2023
- Neighborhood character
- Diverse neighborhood (Simpson 0.55)
- Race & ethnicity
- Black 62% Hispanic / Latino 22% Two or more races 12% White 10% Asian 2%
- Hispanic origin (detail)
- Mexican 15%
- Common ancestry
- Italian 1% Romanian 1% Lithuanian 1%
- Foreign-born
- 11% · Canada
- Languages at home
- 77% English-only · Spanish 19% French/Haitian/Cajun 1% Other Indo-European 1%
Political lean MEDSL · Harris
- 2024 margin
- Lean D (+5.5) · D 52.0% · R 46.4% · Other 1.6%
- 2008→2024 swing
- +3.9pp toward D · 2008: 1.6pp · 2024: 5.5pp
- All cycles
- 2024: D+5.5 2020: D+13.3 2016: D+12.4 2012: D+0.1 2008: D+1.6
Not yet ingested
- Civics
- —
Market trends
- HPI YoY
- ▼ -71.22%
- Current HPI
- 230.2869
- Rent YoY
- ▲ 2.17%
- Metro
- Houston-The Woodlands-Sugar Land, TX
- State GDP YoY
- ▲ 3.95%
- F500 in state
- 110
Industry mix (Fortune 500 HQ in TX)
| Industry | F500 HQs | Revenue |
|---|---|---|
| Energy | 16 | $1,198B |
|
||
| Technology | 5 | $198B |
|
||
| Engineering / Construction | 4 | $72B |
|
||
| Energy Services | 3 | $60B |
|
||
| Utilities | 3 | $41B |
|
||
| Healthcare | 2 | $330B |
|
||
Price history
-49.5% since first listed15 events — show timeline
- 2026-05-22 Listed $149,900 HARMLS
- 2026-02-06 Listing Removed — HARMLS
- 2025-11-06 Price Changed $174,900 HARMLS
- 2025-08-20 Price Changed $189,900 HARMLS
- 2025-06-16 Price Changed $199,900 HARMLS
- 2025-05-09 Price Changed $209,900 HARMLS
- 2025-04-02 Relisted — HARMLS
- 2025-03-18 Listing Removed — HARMLS
- 2025-03-12 Listed $219,900 HARMLS
- 2022-06-10 Listing Removed — HARMLS
- 2022-05-05 Listed $297,000 HARMLS
- 2021-08-04 Sold (Public Records) — Public Records
- 2021-08-04 Sold (Public Records) — Public Records
- 2020-12-07 Sold (Public Records) — Public Records
- 1988-01-02 Sold (Public Records) — Public Records
Property tax history
+4.6%/yrLatest (2025): $4,387 · +1.5% YoY. Source: county tax records.
Cash-flow waterfall
monthlySold comps — $/sqft
last 12 mo · ≤1 miLoading sold comps…