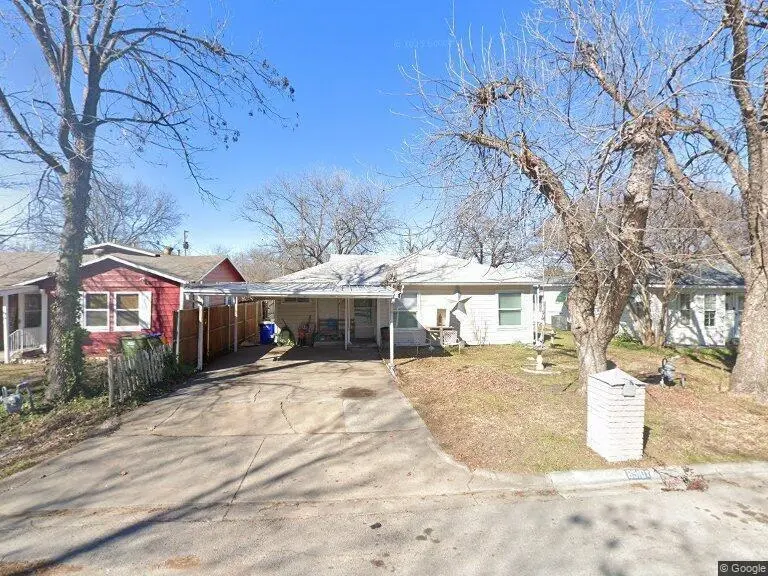
8510 Delmar St · White Settlement, TX
Flood risk 1/10 · Minimal
- FEMA flood zone
- X (unshaded)
- Chance of flooding over 30 yrs
- 0.0%
- Est. flood insurance / yr
- $507 – $1,088
Fire risk 4/10 · Minor
- Est. fire insurance / yr
- $1,222 – $2,270
Heat risk 7/10 · Major
- Hot days now (above 108°F)
- 7 days/yr
- Hot days in 30 yrs
- 21 days/yr
Wind risk 4/10 · Minor
- Chance of severe wind over 30 yrs
- 24.0%
Air-quality risk 3/10 · Minor
- Unhealthy air days now
- 3 days/yr
- Unhealthy air days in 30 yrs
- 4 days/yr
Risk factors via First Street. Map © Google.
Why this score? — see what drove the C- grade
The composite is a weighted blend of 9 inputs, each scored 0–100. Each bar is that input's sub-score; the figure is the points it added to the 100-point composite (weight × sub-score).
- Cash flow +17.5/30.0
- ARV discount +15.0/15.0
- DSCR +5.5/10.0
- 1% rule +4.9/10.0
- Livability +3.7/5.0
- Schools +3.5/10.0
- Rent growth +2.5/5.0
- Condition / age +2.5/5.0
- Appreciation +0.0/10.0
$175,000
🖨 Deal sheet 📄 Offer letter ✓ Due diligence
Listing remarks MLS
This unique home is a jewel waiting to shine! It has a covered front porch and a covered deck in the large backyard. The kitchen area has wooden walls with wooden cabinets and a dishwasher. The bedrooms have wooden flooring. The master bath includes a separate shower and a jetted tub. Go to our website for a Youtube video walkthrough of this property. HUD owned property. Sold 'AS-IS'. Buyers verify all info. HUD Case#492-730479
Key facts
- Spacious yard
- Quiet street
- 7,579 sq ft lot
Tags
Property features AI
Finance
- Other: Possession at closing/funding; Property Type: Residential — Single Family Residence
- Financial info: Listing terms: Cash or Conventional; Special listing condition: Third party approval
- HOA & community: No HOA / association
Exterior
- Parking: Covered carport with 2 spaces
- Utilities: City water
- Home design: Single family residence; Attached property; Built in 1951
- Construction: Built in 1951
- Exterior features: Lot under 0.5 acre (about 0.174 acres); Subdivision: Meadow Park Add
Interior
- Kitchen: Gas range; Gas water heater
- Bedrooms: 3 bedrooms (all on main level); Primary bedroom approx. 13 x 11; Second primary bedroom approx. 16 x 10; Third bedroom approx. 11 x 10
- Bathrooms: 1 full bathroom
- Interior features: Open floorplan; One level
- Laundry & utility: Full-size washer/dryer area
Neighborhood map
What this means for you Summary
Snapshot
- This is a 3-bed/1.0-bath single-family listed at $175k.
Deal economics
- At list price, monthly cash flow is $133 ($2k/yr) — positive.
- The deal already cash-flows at list — no discount required.
- To meet the 1% rule (rent ≥ 1% of price), the offer needs to be $174k (0.6% below list).
- Recommended offer: $170k (3.0% below list) — sets the bar for market timing.
- Cap rate 7.2% vs local median 4.6% in White Settlement — top-decile yield for the area; either an underpriced asset or a hidden risk that comps aren't pricing in. Stress-test before assuming the spread holds.
Location & tenants
- Location reads 74/100 on livability (#188 in TX, #4,855 nationally) — a middle-class / working-renter tenant base. Strengths: cost of living A+, housing A+, health & safety A+; Watch: amenities D+, employment D+, commute F.
- White Settlement ISD (rural): math 35% / reading 44% proficiency, ranked #396 of 826 in TX (top 48%) — families likely to look elsewhere, expect single-tenant / working-renter base with shorter leases.
- Zoned schools: Liberty El (math 38% / reading 42%, grade F, #1,514 of 4,322 statewide, top 36%, 546 students, 81% FRL) — zoned schools average 81% FRL vs 49% district-wide (31 pts higher); higher-poverty schools than district average — tighter screening recommended.
- Market conditions: Rents soft (-0.2%/yr); 548 active listings in the ZIP; 40 comparable units currently listed for rent nearby; rentals lingering (median 44d on market — plan ~5-8 weeks vacancy on turnover, expect pricing pressure); 50% of comp listings sitting > 30 days — soft ceiling on asking rent; solid renter incomes; 18,938 units permitted in Tarrant County in 2024 (8,336 in 5+ unit buildings).
Forward outlook
- Local home prices are declining (-3.0%/yr); year-one equity from $1k of loan paydown is wiped out by about $5k of value loss. Plan a longer hold.
- Tarrant County population projected at +41% by 2050 — long-run rental-demand tailwind backs the buy-and-hold thesis.
Negotiation context
- It's been on market 49 days — a 3% lower offer ($170k) is reasonable based on typical stale-listing flexibility.
- 2 sale attempts since 12y ago with the ask held roughly flat each time — persistent listings suggest the price (not the market) is what's stuck; bring a comps-based counter.
Risks & watch-outs
- Watch-outs: built in 1951 — expect roof / HVAC / electrical / plumbing capex.
- Climate carrying-cost: extreme-heat days projected 7→21/yr by 2055 (HVAC capex compounding) — expect insurance premiums to compound above CPI over the hold.
Questions for the listing agent
- It's been on market 49 days. Have you received any prior offers? Is the seller open to a 3% concession, seller financing, or rate buy-down credit?
- Built in 1951 — when were the roof, HVAC, electrical panel, plumbing, and water heater last replaced?
- Is there a deadline driving the sale (1031 exchange, divorce, estate, relocation)? That informs how much negotiation room exists.
- Schools are D-rated, which usually means shorter tenancies and higher turnover. Who's the typical renter profile here, and what's been the actual vacancy rate?
- What's the average days-on-market for RENTAL listings here right now (not sales)? A rising rental-DOM trend means longer vacancies and softer asking-rent achievability than the comps imply.
- What's the recent tenant-quality profile in this submarket — average credit score on applications, eviction rate, late-payment / NSF rate, and stable-employment percentage? A property-management company in the area should have these aggregated.
- How much new for-sale + rental construction is in the pipeline within 1–3 miles? Heavy new supply typically softens prices + rents 12–24 months out; constrained supply supports both.
Investment metrics
- 1% rule
- 0.99% ✗
- Cap rate
- 7.21%
- Cash-on-cash
- 3.27%
- DSCR
- 1.15
- GRM
- 8.4
CMA / ARV
- ARV (median comp)
- $218,853
- List price
- $175,000
- Delta
- -20.04%
- Verdict
- UNDERPRICED
- Comps
- 20 within 1.0 mi
Show comp detail 12 sales within ~0.75 mi
| Address | Dist | Beds/Ba | Sqft | Sold | Price | $/sf | Match |
|---|---|---|---|---|---|---|---|
| 8320 Redonda St | 0.25mi | 3/2.0 | 1,430 (+1%) | 1mo | $255,000 | $178 | 82 |
| 521 Grant Cir | 0.35mi | 3/1.0 | 1,446 (+2%) | 2mo | $135,000 | $93 | 79 |
| 8512 Whitney Dr | 0.22mi | 3/2.0 | 1,349 (-5%) | 2mo | $282,000 | $209 | 76 |
| 501 Allencrest Dr | 0.20mi | 3/2.0 | 1,350 (-5%) | 3mo | $209,900 | $155 | 76 |
| 220 N Judd St | 0.52mi | 3/2.0 | 1,419 (-0%) | 0mo | $300,000 | $211 | 71 |
| 205 Saddle Rd | 0.37mi | 2/1.5 (-1) | 1,364 (-4%) | 2mo | $229,933 | $169 | 67 |
| 412 Kimbrough St | 0.44mi | 3/1.0 | 1,302 (-8%) | 0mo | $142,000 | $109 | 65 |
| 8521 Whitney Dr | 0.26mi | 3/2.0 | 1,267 (-11%) | 2mo | $230,000 | $182 | 64 |
| 201 N Normandale St | 0.46mi | 3/2.0 | 1,316 (-8%) | 3mo | $175,000 | $133 | 60 |
| 508 Grant Cir | 0.35mi | 3/2.0 | 1,245 (-12%) | 1mo | $219,500 | $176 | 58 |
| 604 Kimbrough St | 0.44mi | 3/2.0 | 1,259 (-12%) | 2mo | $247,000 | $196 | 55 |
| 9225 N Dodson Dr | 0.63mi | 4/2.0 (+1) | 1,483 (+4%) | 2mo | $199,000 | $134 | 53 |
Match score weights: distance 35% · size 25% · config 20% · recency 20%. Top-matched comps best support the ARV.
Projected returns pro-forma
-3.0% appreciation · 0.0% rent growth · sell at horizon
- IRR
- -14.6%
- Equity multiple
- 0.49×
- Total profit
- $-24,908
- Equity at exit
- $26,093
- IRR
- -12.1%
- Equity multiple
- 0.38×
- Total profit
- $-30,255
- Equity at exit
- $15,131
Cash invested: $49,000 (down + closing). Projections, not guarantees.
Landlord ↔ Tenant lean methodology
- Overall (STATE)
- 87 Strongly Landlord-Friendly
- State Texas
- 87 Strongly Landlord-Friendly · R+5
- County
- — inherits STATE
- City
- — inherits STATE
ZIP-level market 76108
- Home prices YoY
- -32.5%
- Rents YoY
- -0.2%
- Active inventory
- 548
- Price-to-rent
- 8.4×
Monthly cashflow live
- Estimated rent
- $1,739 high interval (Pro) →
- Mortgage (P&I)
- −$918
- Tax from tax record
- −$250 /mo · $2,998/yr
- Insurance
- −$73
- HOA
- −$0
- Vacancy / Maint / Mgmt
- −$365
- Net cashflow
- $133
Break-even live
UW: 25.0% down · 7.5% · 30yr · 1.5% tax · 5.0% vac · 8.0% maint · 8.0% mgmt
Financing live
Cash to close
- Down payment
- $43,750
- Closing costs
- $5,250
- Reserves months
- —
- Total cash needed
- —
Loan-product check · same deal, 3 products live
Conventional
25% down · 7.5% · 30yr
- Down + closing
- —
- Monthly P&I
- —
- Monthly cashflow
- —
- DSCR
- —
- Eligible?
- —
Personal DTI + credit; lowest rate.
DSCR
20% down · 8.5% · 30yr
- Down + closing
- —
- Monthly P&I
- —
- Monthly cashflow
- —
- DSCR
- —
- Eligible?
- —
No personal income docs; deal must DSCR.
Hard money
10% down · 12.0% · 12mo
- Down + closing
- —
- Monthly P&I
- —
- Monthly cashflow
- —
- DSCR
- —
- Eligible?
- —
Short-term bridge; refi at stabilization.
Rent comps 40 comps
| Address | Beds | Baths | Sqft | Rent | $/sqft | DOM | Units | Dist |
|---|---|---|---|---|---|---|---|---|
| 129 Allencrest Dr Fort Worth, TX | 3.0 | 2.0 | 1424 | $1,595 | $1.12 | 7d | 1 | 0.19mi |
| 123 Allencrest Dr Fort Worth, TX | 3.0 | 2.0 | 1424 | $1,545 | $1.08 | 1d | 1 | 0.20mi |
| 101 West Pl Fort Worth, TX | 2.0 | 1.0 | 900 | $1,395 | $1.55 | 43d | 1 | 0.21mi |
| 405 S Las Vegas Trl Fort Worth, TX | 3.0 | 2.0 | 1160 | $1,595 | $1.38 | 18d | 1 | 0.21mi |
| 112 Allencrest Dr White Settlement, TX | 2.0 | 1.5 | 1024 | $1,350 | $1.32 | 43d | 1 | 0.22mi |
| 108 Allencrest Dr White Settlement, TX | 2.0 | 1.5 | 1025 | $1,325 | $1.29 | 24d | 1 | 0.23mi |
| 238 S Las Vegas Trl White Settlement, TX | 2.0 | 1.5 | 1200 | $1,372 | $1.14 | 2d | 4 | 0.25mi |
| 140 S Las Vegas Trl White Settlement, TX | 2.0 | 1.5 | 1200 | $1,299 | $1.08 | 24d | 1 | 0.26mi |
| 101 S Las Vegas Trl Fort Worth, TX | 2.0 | 1.5 | 1016 | $1,250 | $1.23 | 43d | 1 | 0.26mi |
| 213 Donald St Fort Worth, TX | 2.0 | 1.0 | 1025 | $1,450 | $1.41 | 43d | 1 | 0.35mi |
| 617 S Las Vegas Trl White Settlement, TX | 3.0 | 2.0 | 1307 | $1,585 | $1.21 | 22d | 1 | 0.35mi |
| 619 Allencrest Dr Fort Worth, TX | 3.0 | 2.0 | 1322 | $1,800 | $1.36 | 24d | 1 | 0.36mi |
| 321 Meadow Park Dr White Settlement, TX | 3.0 | 2.0 | 1400 | $1,875 | $1.34 | 43d | 1 | 0.36mi |
| 225 West Pl Fort Worth, TX | 3.0 | 2.0 | 1550 | $2,400 | $1.55 | 43d | 1 | 0.37mi |
| 640 Kimbrough St Fort Worth, TX | 4.0 | 2.0 | 1394 | $1,995 | $1.43 | 18d | 1 | 0.50mi |
| 9110 Lanham St White Settlement, TX | 2.0 | 1.5 | 1026 | $1,375 | $1.34 | 24d | 1 | 0.56mi |
| 212 Lanham Ct Fort Worth, TX | 2.0 | 1.0 | 1057 | $1,350 | $1.28 | 43d | 1 | 0.57mi |
| 8438 Jay St Fort Worth, TX | 3.0 | 2.5 | 1394 | $1,695 | $1.22 | 7d | 1 | 0.57mi |
| 8112 Gibbs Dr Fort Worth, TX | 3.0 | 2.0 | 1412 | $1,850 | $1.31 | 43d | 1 | 0.58mi |
| 720 Sandell Dr White Settlement, TX | 3.0 | 2.0 | 1796 | $1,795 | $1.00 | 43d | 1 | 0.66mi |
| 1208 Mirike Dr Fort Worth, TX | 3.0 | 2.0 | 1750 | $1,975 | $1.13 | 20d | 1 | 0.70mi |
| 8136 Richard St Fort Worth, TX | 4.0 | 2.0 | 1512 | $1,745 | $1.15 | 7d | 1 | 0.72mi |
| 923 Kimbrough St Fort Worth, TX | 3.0 | 2.0 | 1362 | $1,845 | $1.35 | 43d | 1 | 0.72mi |
| 9208 Marilyn Dr Fort Worth, TX | 3.0 | 2.0 | 1735 | $2,100 | $1.21 | 2d | 1 | 0.79mi |
| 704 Dale Ln Apt 512 White Settlement, TX | 2.0 | 2.0 | 1040 | $1,370 | $1.32 | 43d | 1 | 0.80mi |
| 704 Dale Ln Unit 2121 White Settlement, TX | 2.0 | 2.0 | 1112 | $1,367 | $1.23 | 2d | 1 | 0.80mi |
| 9117 Nathan Dr Fort Worth, TX | 3.0 | 2.0 | 1818 | $1,950 | $1.07 | 43d | 1 | 0.86mi |
| 9304 Marilyn Ct Fort Worth, TX | 3.0 | 2.0 | 1486 | $2,100 | $1.41 | 43d | 1 | 0.86mi |
| 8033 Downe Dr Fort Worth, TX | 3.0 | 1.0 | 1119 | $1,650 | $1.47 | 43d | 1 | 0.96mi |
| 8117 Foxfire Ln Unit A White Settlement, TX | 2.0 | 2.0 | 1030 | $1,150 | $1.12 | 43d | 1 | 1.00mi |
| 8109 Foxfire Ln Unit C White Settlement, TX | 2.0 | 2.0 | 1031 | $1,195 | $1.16 | 5d | 1 | 1.02mi |
| 8109 Foxfire Ln Unit D White Settlement, TX | 2.0 | 2.0 | 1100 | $1,195 | $1.09 | 22d | 1 | 1.02mi |
| 734 Lariat Ln White Settlement, TX | 3.0 | 2.0 | 1275 | $1,750 | $1.37 | 43d | 1 | 1.04mi |
| 1823 S Las Vegas Trl Fort Worth, TX | 2.0 | 2.0 | 900 | $1,360 | $1.51 | 43d | 1 | 1.04mi |
| 500 W Loop 820 S Fort Worth, TX | 1.0–3.0 | 1.0–2.0 | 1082 | $2,039 | $1.88 | 43d | 11 | 1.04mi |
| 8012 Chaparral Dr Fort Worth, TX | 3.0 | 1.5 | 1226 | $1,620 | $1.32 | 20d | 1 | 1.05mi |
| 7940 Chaparral Dr Fort Worth, TX | 3.0 | 1.5 | 1142 | $1,795 | $1.57 | 24d | 1 | 1.08mi |
| 9641 Olivia Dr Fort Worth, TX | 3.0 | 2.0 | 1670 | $2,025 | $1.21 | 11d | 1 | 1.10mi |
| 7924 Emerald Crest Dr White Settlement, TX | 2.0 | 2.0 | 925 | $1,199 | $1.30 | 43d | 1 | 1.14mi |
| 7724 Longfield Dr Fort Worth, TX | 3.0 | 2.0 | 1335 | $1,995 | $1.49 | 43d | 1 | 1.14mi |
Listing history 18 events
-
2026-06-18days on market $175,000 Active 49 DOM
-
2026-06-17days on market $175,000 Active 48 DOM
-
2026-06-16days on market $175,000 Active 47 DOM
-
2026-06-15days on market $175,000 Active 46 DOM
-
2026-06-13days on market $175,000 Active 44 DOM
-
2026-06-09days on market $175,000 Active 40 DOM
-
2026-06-08days on market $175,000 Active 39 DOM
-
2026-06-07days on market $175,000 Active 38 DOM
-
2026-06-04days on market $175,000 Active 35 DOM
-
2026-06-03days on market $175,000 Active 34 DOM
-
2026-06-02days on market $175,000 Active 33 DOM
-
2026-06-01days on market $175,000 Active 32 DOM
-
2026-05-31days on market $175,000 Active 31 DOM
-
2026-04-30$175,000 Active 252-char remark
-
2014-11-24soldstatus Sold 431-char remark
Show marketing remark (431 chars)
This unique home is a jewel waiting to shine! It has a covered front porch and a covered deck in the large backyard. The kitchen area has wooden walls with wooden cabinets and a dishwasher. The bedrooms have wooden flooring. The master bath includes a separate shower and a jetted tub. Go to our website for a Youtube video walkthrough of this property. HUD owned property. Sold 'AS-IS'. Buyers verify all info. HUD Case#492-730479
-
2014-10-06status Pending 431-char remark
Show marketing remark (431 chars)
This unique home is a jewel waiting to shine! It has a covered front porch and a covered deck in the large backyard. The kitchen area has wooden walls with wooden cabinets and a dishwasher. The bedrooms have wooden flooring. The master bath includes a separate shower and a jetted tub. Go to our website for a Youtube video walkthrough of this property. HUD owned property. Sold 'AS-IS'. Buyers verify all info. HUD Case#492-730479
-
2014-09-24$41,500 Active 431-char remark
Show marketing remark (431 chars)
This unique home is a jewel waiting to shine! It has a covered front porch and a covered deck in the large backyard. The kitchen area has wooden walls with wooden cabinets and a dishwasher. The bedrooms have wooden flooring. The master bath includes a separate shower and a jetted tub. Go to our website for a Youtube video walkthrough of this property. HUD owned property. Sold 'AS-IS'. Buyers verify all info. HUD Case#492-730479
-
1998-05-04soldstatus
ⓘ Source: listings_history table (triggers on properties + properties_extension) + one-shot
backfill from property_details.listing_events for pre-trigger history.
Tax reassessment forecast TX · Resets to sale price
- Current annual tax
- $2,998 · $250/mo
- Projected year-2 tax
- $3,202 · $267/mo
- Expected delta
- +$204/yr (+$17/mo · 6.8%)
ⓘ Screening estimate from a state-policy table — verify with the county assessor before closing.
Climate risk First Street
- Flood 1/10 Low FEMA zone X (unshaded) · 0% chance over 30 yrs
- Wildfire 4/10 Moderate
- Heat 7/10 Severe 7 d/yr ≥108°F today · 21 d/yr by 30 yrs out
- Wind 4/10 Moderate 24% chance of damaging wind over 30 yrs
- Air quality 3/10 Moderate 3 unhealthy d/yr today · 4 by 30 yrs out
Nearby sold comps map
Loading sold comps map…
Walkable amenities ~0.75 mi
Loading nearby amenities…
Taxation est. · year 1
- Rental income
- $20,870
- − Mortgage interest
- −$9,803
- − Property taxes
- −$2,998
- − Insurance
- −$875
- − Repairs & maintenance
- −$1,670
- − Management
- −$1,670
- − Depreciation
- −$5,091
- Taxable loss
- −$1,236
- Est. tax savings @ 24.0%
- +$297
- After-tax cash flow
- $1,898/yr
For passive investors: Depreciation is non-cash, so a rental often shows a tax loss while cash-flowing — sheltering income. Rental losses are passive: they offset passive income freely, and up to $25,000/yr can offset ordinary (W-2) income if you actively participate and your MAGI is under $100k (phasing out to $0 by $150k); unused losses carry forward. On sale, claimed depreciation is recaptured at up to 25%, and gains may owe capital-gains tax (a 1031 exchange can defer both). Figures are a year-1 estimate at your 24.0% rate — not tax advice; consult a CPA.
Schools (NCES district)
- District
- White Settlement ISD
- NCES district ID
- 4845540
- Math proficiency
- 35% ▼ -10.00%
- Reading proficiency
- 44% ▼ -4.00%
- Median HH income
- $56,055
- Composite
- 34.63/100
- National rank
- #5151
- State rank
- #396 of 826 in TX
Livability — White Settlement
- Score
- 74/100
- State rank
- #188
- US rank
- #4855
Category grades
Schools grade is shown separately in the Schools card above.
Census & demographics
- Census place
- White Settlement, TX
- County
- Tarrant County · 2,033,669 people
- Metro
- Dallas-Fort Worth-Arlington, TX
- Population (ZIP)
- 45,537
- Household income
- $80,412
- Rent vs Own
- Severe rent burden
- 774.0
Population outlook (Tarrant County) Hauer SSP2
- Today (2025)
- 2,380,417 people
- By 2030
- 2,578,900 · +8.3%
- By 2040
- 2,974,995 · +25.0%
- By 2050
- 3,350,489 · +40.8%
- By 2075
- 4,216,909 · +77.2%
- By 2100
- 4,741,527 · +99.2%
Race, ethnicity, and origin ACS 2023
- Neighborhood character
- Diverse neighborhood (Simpson 0.62)
- Race & ethnicity
- White 52% Hispanic / Latino 32% Two or more races 17% Black 8% Asian 3% Native American 1%
- Hispanic origin (detail)
- Mexican 26% Puerto Rican 1%
- Common ancestry
- Slovak 2% Lithuanian 1% Romanian 1%
- Foreign-born
- 11% · Canada, Vietnam
- Languages at home
- 76% English-only · Spanish 21% Vietnamese 1% Tagalog/Filipino 1%
Political lean MEDSL · Tarrant
- 2024 margin
- Lean R (+5.1) · D 46.7% · R 51.9% · Other 1.4%
- 2008→2024 swing
- +6.6pp toward D · 2008: -11.7pp · 2024: -5.1pp
- All cycles
- 2024: R+5.1 2020: D+0.2 2016: R+8.7 2012: R+15.7 2008: R+11.7
Not yet ingested
- Civics
- —
Market trends
- HPI YoY
- ▼ -141.39%
- Current HPI
- 294.2459
- Rent YoY
- ▼ -0.18%
- Metro
- Dallas-Fort Worth-Arlington, TX
- State GDP YoY
- ▲ 3.95%
- F500 in state
- 110
Industry mix (Fortune 500 HQ in TX)
| Industry | F500 HQs | Revenue |
|---|---|---|
| Energy | 16 | $1,198B |
|
||
| Technology | 5 | $198B |
|
||
| Engineering / Construction | 4 | $72B |
|
||
| Energy Services | 3 | $60B |
|
||
| Utilities | 3 | $41B |
|
||
| Healthcare | 2 | $330B |
|
||
Price history
+321.7% since first listed5 events — show timeline
- 2026-04-30 Listed $175,000 NTREIS
- 2014-11-24 Sold (MLS) — NTREIS
- 2014-10-06 Pending — NTREIS
- 2014-09-24 Listed $41,500 NTREIS
- 1998-05-04 Sold (Public Records) — Public Records
Property tax history
+5.8%/yrLatest (2025): $2,998 · -1.1% YoY. Source: county tax records.
Cash-flow waterfall
monthlySold comps — $/sqft
last 12 mo · ≤1 miLoading sold comps…