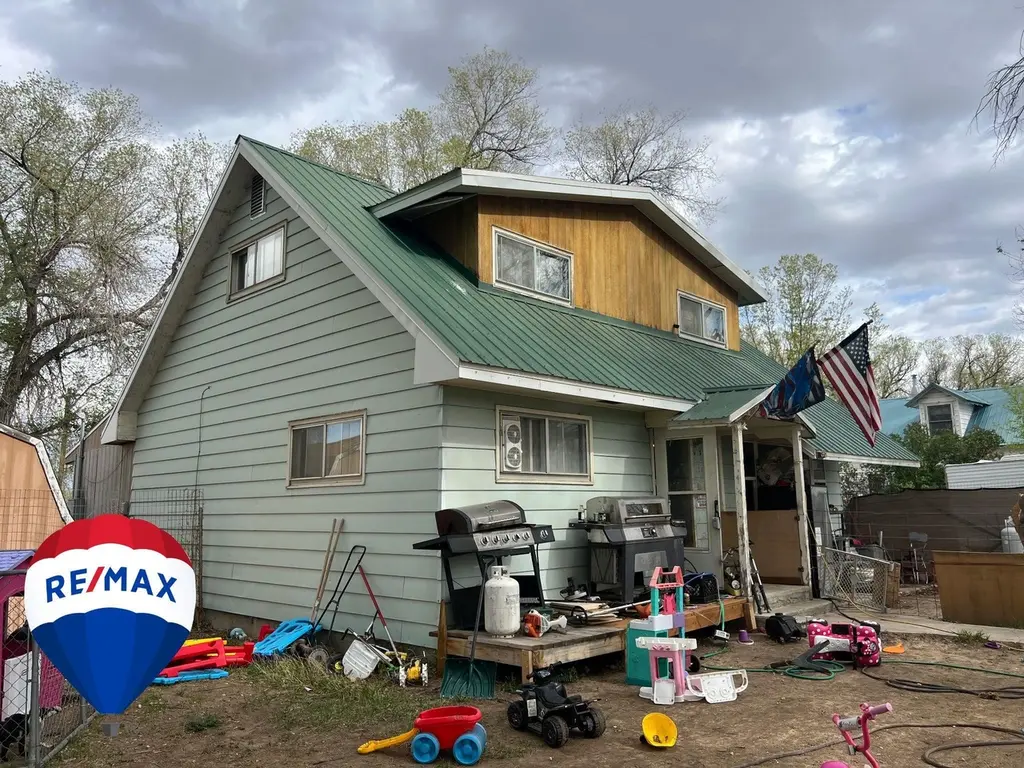
181 N Ohio Ave · Hudson, WY
Flood risk 1/10 · Minimal
- FEMA flood zone
- X (unshaded)
- Chance of flooding over 30 yrs
- 0.0%
- Est. flood insurance / yr
- $507 – $1,088
Fire risk 7/10 · Major
- Est. fire insurance / yr
- $564 – $1,046
Heat risk 3/10 · Minor
- Hot days now (above 91°F)
- 4 days/yr
- Hot days in 30 yrs
- 12 days/yr
Wind risk 1/10 · Minimal
- Chance of severe wind over 30 yrs
- —
Air-quality risk 3/10 · Minor
- Unhealthy air days now
- 2 days/yr
- Unhealthy air days in 30 yrs
- 4 days/yr
Risk factors via First Street. Map © Google.
Why this score? — see what drove the D grade
The composite is a weighted blend of 9 inputs, each scored 0–100. Each bar is that input's sub-score; the figure is the points it added to the 100-point composite (weight × sub-score).
- ARV discount +12.5/15.0
- Cash flow +7.9/30.0
- Appreciation +5.6/10.0
- Schools +4.3/10.0
- Livability +3.1/5.0
- Rent growth +2.5/5.0
- Condition / age +2.5/5.0
- DSCR +2.0/10.0
- 1% rule +1.3/10.0
$199,000
🖨 Deal sheet 📄 Offer letter ✓ Due diligence
Key facts
- Metal siding
- Large pasture
- Over sized yard
Tags
Property features AI
Finance
- Other: Residential property
Exterior
- Parking: No garage
- Utilities: Public water; Public sewer; Natural gas available
- Home design: Single family residence; 1 story
- Construction: Metal siding; Aluminum roof
- Exterior features: Porch; Shed(s); Has view; Horses allowed; 0.41-acre lot
Interior
- Kitchen: Refrigerator; Range; Oven
- Flooring: Hardwood
- Heating & cooling: Forced air heating
- Interior features: Refrigerator; Range; Oven; Hardwood flooring; Forced air heating
Neighborhood map
What this means for you Summary
Snapshot
- This is a 3-bed/1.0-bath single-family listed at $199k.
Deal economics
- At list price, monthly cash flow is $-213 ($-3k/yr) — negative.
- To cash-flow at today's rent, offer at most $161k (18.9% below list).
- To meet the 1% rule (rent ≥ 1% of price), the offer needs to be $125k (37.1% below list).
- Recommended offer: $125k (37.1% below list) — sets the bar for 1% rule.
Location & tenants
- Location reads 61/100 on livability (#119 in WY) — a middle-class / working-renter tenant base. Strengths: cost of living A+, housing A+, crime B; Watch: schools F, amenities F, commute F.
- Fremont County School District # 1 (town): math 46% / reading 54% proficiency, ranked #26 of 41 in WY (top 63%) — acceptable for families but not a draw, mixed tenant base, ~2y average lease.
- Market conditions: 3 active listings in the ZIP; 22 units permitted in Fremont County in 2024 (0 in 5+ unit buildings).
Forward outlook
- In year one you build about $4k of equity ($1k loan paydown + $2k appreciation (1.1% local appreciation)).
- Fremont County population projected at -13% by 2050 — secular population decline; favor cash flow + early exit over multi-decade hold.
- By year 9, paydown + projected appreciation supports a ~$33k cash-out refi (75% LTV) — recoverable capital for the next deal without selling this one.
Negotiation context
- It's been on market 41 days — a 3% lower offer ($193k) is reasonable based on typical stale-listing flexibility.
Risks & watch-outs
- Climate carrying-cost: major wildfire risk — expect insurance premiums to compound above CPI over the hold.
Questions for the listing agent
- What do current leases actually rent for vs. the listed asking? Can we see a recent rent roll and the last 12 months of T-12 income?
- It's been on market 41 days. Have you received any prior offers? Is the seller open to a 37% concession, seller financing, or rate buy-down credit?
- Built in 1966 — when were the roof, HVAC, electrical panel, plumbing, and water heater last replaced?
- Is there a deadline driving the sale (1031 exchange, divorce, estate, relocation)? That informs how much negotiation room exists.
- Schools are F-rated, which usually means shorter tenancies and higher turnover. Who's the typical renter profile here, and what's been the actual vacancy rate?
- The area grade is low — what's the realistic commute time and amenity access for the typical tenant pool here? Any planned neighborhood developments (good or bad) we should know about?
- What's the average days-on-market for RENTAL listings here right now (not sales)? A rising rental-DOM trend means longer vacancies and softer asking-rent achievability than the comps imply.
- What's the recent tenant-quality profile in this submarket — average credit score on applications, eviction rate, late-payment / NSF rate, and stable-employment percentage? A property-management company in the area should have these aggregated.
- How much new for-sale + rental construction is in the pipeline within 1–3 miles? Heavy new supply typically softens prices + rents 12–24 months out; constrained supply supports both.
Investment metrics
- 1% rule
- 0.63% ✗
- Cap rate
- 5.01%
- Cash-on-cash
- -4.58%
- DSCR
- 0.80
- GRM
- 13.2
CMA / ARV
- ARV (median comp)
- $224,145
- List price
- $199,000
- Delta
- -11.22%
- Verdict
- UNDERPRICED
- Comps
- 3 within 1.0 mi
Projected returns pro-forma
1.12% appreciation · 3.0% rent growth · sell at horizon
- IRR
- -3.1%
- Equity multiple
- 0.84×
- Total profit
- $-8,736
- Equity at exit
- $69,177
- IRR
- 1.9%
- Equity multiple
- 1.24×
- Total profit
- $13,418
- Equity at exit
- $92,897
Cash invested: $55,720 (down + closing). Projections, not guarantees.
Landlord ↔ Tenant lean methodology
- Overall (STATE)
- 90 Strongly Landlord-Friendly
- State Wyoming
- 90 Strongly Landlord-Friendly · R+25
- County
- — inherits STATE
- City
- — inherits STATE
ZIP-level market 82515
- Home prices YoY
- 1.0%
- Active inventory
- 3
- Price-to-rent
- 13.2×
Monthly cashflow live
- Estimated rent
- $1,252 medium interval (Pro) →
- Mortgage (P&I)
- −$1,044
- Tax from tax record
- −$75 /mo · $898/yr
- Insurance
- −$83
- HOA
- −$0
- Vacancy / Maint / Mgmt
- −$263
- Net cashflow
- $-213
Break-even live
UW: 25.0% down · 7.5% · 30yr · 1.5% tax · 5.0% vac · 8.0% maint · 8.0% mgmt
Financing live
Cash to close
- Down payment
- $49,750
- Closing costs
- $5,970
- Reserves months
- —
- Total cash needed
- —
Loan-product check · same deal, 3 products live
Conventional
25% down · 7.5% · 30yr
- Down + closing
- —
- Monthly P&I
- —
- Monthly cashflow
- —
- DSCR
- —
- Eligible?
- —
Personal DTI + credit; lowest rate.
DSCR
20% down · 8.5% · 30yr
- Down + closing
- —
- Monthly P&I
- —
- Monthly cashflow
- —
- DSCR
- —
- Eligible?
- —
No personal income docs; deal must DSCR.
Hard money
10% down · 12.0% · 12mo
- Down + closing
- —
- Monthly P&I
- —
- Monthly cashflow
- —
- DSCR
- —
- Eligible?
- —
Short-term bridge; refi at stabilization.
Listing history 17 events
-
2026-06-19days on market $199,000 Active 41 DOM
-
2026-06-18days on market $199,000 Active 40 DOM
-
2026-06-17days on market $199,000 Active 39 DOM
-
2026-06-16days on market $199,000 Active 38 DOM
-
2026-06-15days on market $199,000 Active 37 DOM
-
2026-06-14days on market $199,000 Active 35 DOM
-
2026-06-12days on market $199,000 Active 34 DOM
-
2026-06-09days on market $199,000 Active 31 DOM
-
2026-06-08days on market $199,000 Active 30 DOM
-
2026-06-07days on market $199,000 Active 29 DOM
-
2026-06-05days on market $199,000 Active 27 DOM
-
2026-06-04days on market $199,000 Active 25 DOM
-
2026-06-02days on market $199,000 Active 24 DOM
-
2026-06-01days on market $199,000 Active 23 DOM
-
2026-05-31days on market $199,000 Active 22 DOM
-
2026-05-31days on market $199,000 Active 21 DOM
-
2026-05-07$199,000 Active 785-char remark
ⓘ Source: listings_history table (triggers on properties + properties_extension) + one-shot
backfill from property_details.listing_events for pre-trigger history.
Tax reassessment forecast WY · Resets to sale price
- Current annual tax
- $898 · $75/mo
- Projected year-2 tax
- $1,214 · $101/mo
- Expected delta
- +$316/yr (+$26/mo · 35.1%)
ⓘ Screening estimate from a state-policy table — verify with the county assessor before closing.
Climate risk First Street
- Flood 1/10 Low FEMA zone X (unshaded) · 0% chance over 30 yrs
- Wildfire 7/10 Severe
- Heat 3/10 Moderate 4 d/yr ≥91°F today · 12 d/yr by 30 yrs out
- Wind 1/10 Low
- Air quality 3/10 Moderate 2 unhealthy d/yr today · 4 by 30 yrs out
Nearby sold comps map
Loading sold comps map…
Walkable amenities ~0.75 mi
Loading nearby amenities…
Taxation est. · year 1
- Rental income
- $15,020
- − Mortgage interest
- −$11,147
- − Property taxes
- −$898
- − Insurance
- −$995
- − Repairs & maintenance
- −$1,202
- − Management
- −$1,202
- − Depreciation
- −$5,789
- Taxable loss
- −$6,213
- Est. tax savings @ 24.0%
- +$1,491
- After-tax cash flow
- $-1,059/yr
For passive investors: Depreciation is non-cash, so a rental often shows a tax loss while cash-flowing — sheltering income. Rental losses are passive: they offset passive income freely, and up to $25,000/yr can offset ordinary (W-2) income if you actively participate and your MAGI is under $100k (phasing out to $0 by $150k); unused losses carry forward. On sale, claimed depreciation is recaptured at up to 25%, and gains may owe capital-gains tax (a 1031 exchange can defer both). Figures are a year-1 estimate at your 24.0% rate — not tax advice; consult a CPA.
Schools (NCES district)
- District
- Fremont County School District # 1
- NCES district ID
- 5602870
- Math proficiency
- 46% ▼ -7.00%
- Reading proficiency
- 54% ▼ -5.00%
- Median HH income
- $55,401
- Composite
- 43.27/100
- National rank
- #3048
- State rank
- #26 of 41 in WY
Livability — Hudson
- Score
- 61/100
- State rank
- #119
- US rank
- #18375
Category grades
Schools grade is shown separately in the Schools card above.
Census & demographics
- Census place
- Hudson, WY
- Population (ZIP)
- 386
Population outlook (Fremont County) Hauer SSP2
- Today (2025)
- 39,368 people
- By 2030
- 38,412 · -2.4%
- By 2040
- 36,224 · -8.0%
- By 2050
- 34,314 · -12.8%
- By 2075
- 30,353 · -22.9%
- By 2100
- 25,821 · -34.4%
Race, ethnicity, and origin ACS 2023
- Neighborhood character
- Predominantly White (82%)
- Race & ethnicity
- White 82% Two or more races 11% Hispanic / Latino 8% Native American 4%
- Hispanic origin (detail)
- Mexican 5%
- Common ancestry
- Slovak 3% Portuguese 2% Lithuanian 2%
- Languages at home
- 98% English-only · Spanish 1%
Political lean MEDSL · Fremont
- 2024 margin
- Solid R (+37.4) · D 30.4% · R 67.7% · Other 1.9%
- 2008→2024 swing
- -8.6pp toward R · 2008: -28.8pp · 2024: -37.4pp
- All cycles
- 2024: R+37.4 2020: R+35.8 2016: R+42.1 2012: R+34.1 2008: R+28.8
Not yet ingested
- Civics
- —
Market trends
- HPI YoY
- ▲ 1.12%
- Current HPI
- 109.7506
- Rent YoY
- —
- Metro
- —
- State GDP YoY
- —
- F500 in state
- 0
Price history
1 event — show timeline
- 2026-05-07 Listed $199,000 WMLS
Property tax history
-1.3%/yrLatest (2025): $898 · -20.2% YoY. Source: county tax records.
Cash-flow waterfall
monthlySold comps — $/sqft
last 12 mo · ≤1 miLoading sold comps…