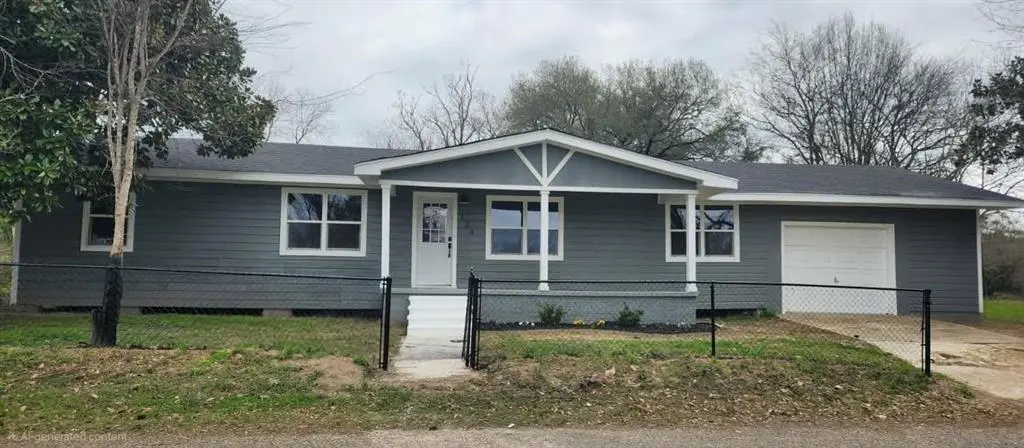
124 Ida St · Beckville, TX
Flood risk No data
- FEMA flood zone
- —
- Chance of flooding over 30 yrs
- —
- Est. flood insurance / yr
- —
Fire risk No data
- Est. fire insurance / yr
- —
Heat risk No data
- Hot days now (above threshold)
- —
- Hot days in 30 yrs
- —
Wind risk No data
- Chance of severe wind over 30 yrs
- —
Air-quality risk No data
- Unhealthy air days now
- —
- Unhealthy air days in 30 yrs
- —
Risk factors via First Street. Map © Google.
Why this score? — see what drove the D grade
The composite is a weighted blend of 9 inputs, each scored 0–100. Each bar is that input's sub-score; the figure is the points it added to the 100-point composite (weight × sub-score).
- Cash flow +10.7/30.0
- ARV discount +6.7/15.0
- Appreciation +5.0/10.0
- Schools +5.0/10.0
- DSCR +3.1/10.0
- Livability +3.1/5.0
- 1% rule +2.7/10.0
- Rent growth +2.5/5.0
- Condition / age +2.5/5.0
$170,000
🖨 Deal sheet 📄 Offer letter ✓ Due diligence
Listing remarks MLS
FULLY renovated modern smart home featuring smart locks with touch technology, smart sense water heater managed and operated from a smart phone. Low E window-sun defense. Waterproof flooring throughout the house. Kitchen has soft close kitchen cabinets with centered island waste basket ready with rear design. All electric appliances with over the range microwave. Single car garage. Brand new central air conditioning system with lighted thermostat. It provides cool air and heat throughout the house. Extended front porch to give relaxing atmosphere. Lighting at every entrance point. Even at this price, there is still some equity.
Key facts
- 8,002 sq ft lot
- Garage
- Built 1958
Neighborhood map
What this means for you Summary
Snapshot
- This is a 4-bed/2.0-bath single-family listed at $170k.
Deal economics
- At list price, monthly cash flow is $-81 ($-974/yr) — negative.
- To cash-flow at today's rent, offer at most $156k (8.4% below list).
- To meet the 1% rule (rent ≥ 1% of price), the offer needs to be $131k (23.1% below list).
- Recommended offer: $131k (23.1% below list) — sets the bar for 1% rule.
Location & tenants
- Location reads 62/100 on livability (#967 in TX) — a middle-class / working-renter tenant base. Strengths: cost of living A+, housing A+; Watch: employment D, crime F, amenities F.
- Beckville ISD (rural): math 57% / reading 59% proficiency, ranked #82 of 826 in TX (top 10%) — acceptable for families but not a draw, mixed tenant base, ~2y average lease.
- Market conditions: 23 active listings in the ZIP; 6 units permitted in Panola County in 2024 (0 in 5+ unit buildings).
Forward outlook
- In year one you build about $6k of equity ($1k loan paydown + $5k appreciation (3.0% local appreciation)).
- Panola County population projected at -14% by 2050 — secular population decline; favor cash flow + early exit over multi-decade hold.
- At projected returns (3.0% appreciation + 3.0% rent growth), your $48k cash investment doubles in ~7 years — after that, you're playing with house money.
- By year 6, paydown + projected appreciation supports a ~$33k cash-out refi (75% LTV) — recoverable capital for the next deal without selling this one.
Negotiation context
- It's been on market 100 days — a 9% lower offer ($155k) is reasonable based on typical stale-listing flexibility.
Risks & watch-outs
- Watch-outs: built in 1958 — expect roof / HVAC / electrical / plumbing capex.
Questions for the listing agent
- What do current leases actually rent for vs. the listed asking? Can we see a recent rent roll and the last 12 months of T-12 income?
- It's been on market 100 days. Have you received any prior offers? Is the seller open to a 23% concession, seller financing, or rate buy-down credit?
- Built in 1958 — when were the roof, HVAC, electrical panel, plumbing, and water heater last replaced?
- Why hasn't it sold? Are there any deal-killer items the seller is aware of (foundation, flood, title, zoning, code violations)?
- Is there a deadline driving the sale (1031 exchange, divorce, estate, relocation)? That informs how much negotiation room exists.
- Crime grade is F in this area — have there been break-ins, vandalism, or insurance claims at this property in the last 3 years? What carrier currently insures it and at what premium?
- The area grade is low — what's the realistic commute time and amenity access for the typical tenant pool here? Any planned neighborhood developments (good or bad) we should know about?
- What's the average days-on-market for RENTAL listings here right now (not sales)? A rising rental-DOM trend means longer vacancies and softer asking-rent achievability than the comps imply.
- What's the recent tenant-quality profile in this submarket — average credit score on applications, eviction rate, late-payment / NSF rate, and stable-employment percentage? A property-management company in the area should have these aggregated.
- How much new for-sale + rental construction is in the pipeline within 1–3 miles? Heavy new supply typically softens prices + rents 12–24 months out; constrained supply supports both.
Investment metrics
- 1% rule
- 0.77% ✗
- Cap rate
- 5.72%
- Cash-on-cash
- -2.05%
- DSCR
- 0.91
- GRM
- 10.8
CMA / ARV
- ARV (median comp)
- $166,905
- List price
- $170,000
- Delta
- 1.85%
- Verdict
- FAIR
- Comps
- 1 within 2.0 mi
Show comp detail 1 sale within ~0.75 mi
| Address | Dist | Beds/Ba | Sqft | Sold | Price | $/sf | Match |
|---|---|---|---|---|---|---|---|
| 134 E Adams St | 0.23mi | 3/2.0 (-1) | 1,790 (-2%) | 10mo | $170,000 | $95 | 73 |
Match score weights: distance 35% · size 25% · config 20% · recency 20%. Top-matched comps best support the ARV.
Projected returns pro-forma
3.0% appreciation · 3.0% rent growth · sell at horizon
- IRR
- 5.6%
- Equity multiple
- 1.32×
- Total profit
- $15,291
- Equity at exit
- $76,439
- IRR
- 8.6%
- Equity multiple
- 2.30×
- Total profit
- $61,683
- Equity at exit
- $117,802
Cash invested: $47,600 (down + closing). Projections, not guarantees.
Landlord ↔ Tenant lean methodology
- Overall (STATE)
- 87 Strongly Landlord-Friendly
- State Texas
- 87 Strongly Landlord-Friendly · R+5
- County
- — inherits STATE
- City
- — inherits STATE
ZIP-level market 75631
- Active inventory
- 23
- Price-to-rent
- 10.8×
Monthly cashflow live
- Estimated rent
- $1,308 medium interval (Pro) →
- Mortgage (P&I)
- −$891
- Tax from tax record
- −$152 /mo · $1,824/yr
- Insurance
- −$71
- HOA
- −$0
- Vacancy / Maint / Mgmt
- −$275
- Net cashflow
- $-81
Break-even live
UW: 25.0% down · 7.5% · 30yr · 1.5% tax · 5.0% vac · 8.0% maint · 8.0% mgmt
Financing live
Cash to close
- Down payment
- $42,500
- Closing costs
- $5,100
- Reserves months
- —
- Total cash needed
- —
Loan-product check · same deal, 3 products live
Conventional
25% down · 7.5% · 30yr
- Down + closing
- —
- Monthly P&I
- —
- Monthly cashflow
- —
- DSCR
- —
- Eligible?
- —
Personal DTI + credit; lowest rate.
DSCR
20% down · 8.5% · 30yr
- Down + closing
- —
- Monthly P&I
- —
- Monthly cashflow
- —
- DSCR
- —
- Eligible?
- —
No personal income docs; deal must DSCR.
Hard money
10% down · 12.0% · 12mo
- Down + closing
- —
- Monthly P&I
- —
- Monthly cashflow
- —
- DSCR
- —
- Eligible?
- —
Short-term bridge; refi at stabilization.
Listing history 16 events
-
2026-06-18days on market $170,000 Active 100 DOM
-
2026-06-17days on market $170,000 Active 99 DOM
-
2026-06-16days on market $170,000 Active 98 DOM
-
2026-06-15days on market $170,000 Active 97 DOM
-
2026-06-13days on market $170,000 Active 95 DOM
-
2026-06-12days on market $170,000 Active 94 DOM
-
2026-06-09days on market $170,000 Active 91 DOM
-
2026-06-08days on market $170,000 Active 90 DOM
-
2026-06-08days on market $170,000 Active 89 DOM
-
2026-06-07days on market $170,000 Active 88 DOM
-
2026-06-03days on market $170,000 Active 85 DOM
-
2026-06-02days on market $170,000 Active 84 DOM
-
2026-06-01days on market $170,000 Active 83 DOM
-
2026-05-31days on market $170,000 Active 82 DOM
-
2026-04-17price $170,000 645-char remark
Show marketing remark (645 chars)
FULLY renovated modern smart home featuring smart locks with touch technology, smart sense water heater managed and operated from a smart phone. Low E window-sun defense. Waterproof flooring throughout the house. Kitchen has soft close kitchen cabinets with centered island waste basket ready with rear design. All electric appliances with over the range microwave. Single car garage. Brand new central air conditioning system with lighted thermostat. It provides cool air and heat throughout the house. Extended front porch to give relaxing atmosphere. Lighting at every entrance point. Even at this price, there is still some equity.
-
2026-03-10$190,000 Active 645-char remark
Show marketing remark (645 chars)
FULLY renovated modern smart home featuring smart locks with touch technology, smart sense water heater managed and operated from a smart phone. Low E window-sun defense. Waterproof flooring throughout the house. Kitchen has soft close kitchen cabinets with centered island waste basket ready with rear design. All electric appliances with over the range microwave. Single car garage. Brand new central air conditioning system with lighted thermostat. It provides cool air and heat throughout the house. Extended front porch to give relaxing atmosphere. Lighting at every entrance point. Even at this price, there is still some equity.
ⓘ Source: listings_history table (triggers on properties + properties_extension) + one-shot
backfill from property_details.listing_events for pre-trigger history.
Tax reassessment forecast TX · Resets to sale price
- Current annual tax
- $1,824 · $152/mo
- Projected year-2 tax
- $3,111 · $259/mo
- Expected delta
- +$1,287/yr (+$107/mo · 70.5%)
ⓘ Screening estimate from a state-policy table — verify with the county assessor before closing.
Nearby sold comps map
Loading sold comps map…
Walkable amenities ~0.75 mi
Loading nearby amenities…
Taxation est. · year 1
- Rental income
- $15,694
- − Mortgage interest
- −$9,523
- − Property taxes
- −$1,824
- − Insurance
- −$850
- − Repairs & maintenance
- −$1,256
- − Management
- −$1,256
- − Depreciation
- −$4,945
- Taxable loss
- −$3,960
- Est. tax savings @ 24.0%
- +$950
- After-tax cash flow
- $-24/yr
For passive investors: Depreciation is non-cash, so a rental often shows a tax loss while cash-flowing — sheltering income. Rental losses are passive: they offset passive income freely, and up to $25,000/yr can offset ordinary (W-2) income if you actively participate and your MAGI is under $100k (phasing out to $0 by $150k); unused losses carry forward. On sale, claimed depreciation is recaptured at up to 25%, and gains may owe capital-gains tax (a 1031 exchange can defer both). Figures are a year-1 estimate at your 24.0% rate — not tax advice; consult a CPA.
Schools (NCES district)
- District
- Beckville ISD
- NCES district ID
- 4809690
- Math proficiency
- 57% ▼ -2.00%
- Reading proficiency
- 59% ▲ 3.00%
- Median HH income
- $54,283
- Composite
- 49.83/100
- National rank
- #1950
- State rank
- #82 of 826 in TX
Livability — Beckville
- Score
- 62/100
- State rank
- #967
- US rank
- #17160
Category grades
Schools grade is shown separately in the Schools card above.
Census & demographics
- Census place
- Beckville, TX
- Population (ZIP)
- 2,644
Population outlook (Panola County) Hauer SSP2
- Today (2025)
- 23,273 people
- By 2030
- 22,845 · -1.8%
- By 2040
- 21,652 · -7.0%
- By 2050
- 20,107 · -13.6%
- By 2075
- 15,709 · -32.5%
- By 2100
- 11,013 · -52.7%
Race, ethnicity, and origin ACS 2023
- Neighborhood character
- Predominantly White (77%)
- Race & ethnicity
- White 77% Two or more races 11% Hispanic / Latino 10% Black 7%
- Hispanic origin (detail)
- Mexican 10%
- Common ancestry
- German 4% Lithuanian 3% Serbian 1%
- Foreign-born
- 4% · Canada
- Languages at home
- 91% English-only · Spanish 9%
Political lean MEDSL · Panola
- 2024 margin
- Solid R (+66.4) · D 16.7% · R 83.1%
- 2008→2024 swing
- -17.5pp toward R · 2008: -48.9pp · 2024: -66.4pp
- All cycles
- 2024: R+66.4 2020: R+63.5 2016: R+63.5 2012: R+56.1 2008: R+48.9
Not yet ingested
- Civics
- —
Market trends
- HPI YoY
- —
- Current HPI
- —
- Rent YoY
- —
- Metro
- —
- State GDP YoY
- ▲ 3.95%
- F500 in state
- 110
Industry mix (Fortune 500 HQ in TX)
| Industry | F500 HQs | Revenue |
|---|---|---|
| Energy | 16 | $1,198B |
|
||
| Technology | 5 | $198B |
|
||
| Engineering / Construction | 4 | $72B |
|
||
| Energy Services | 3 | $60B |
|
||
| Utilities | 3 | $41B |
|
||
| Healthcare | 2 | $330B |
|
||
Price history
-10.5% since first listed2 events — show timeline
- 2026-04-17 Price Changed $170,000 NTREIS
- 2026-03-10 Listed $190,000 NTREIS
Property tax history
+6.6%/yrLatest (2025): $1,824 · +7.1% YoY. Source: county tax records.
Cash-flow waterfall
monthlySold comps — $/sqft
last 12 mo · ≤1 miLoading sold comps…