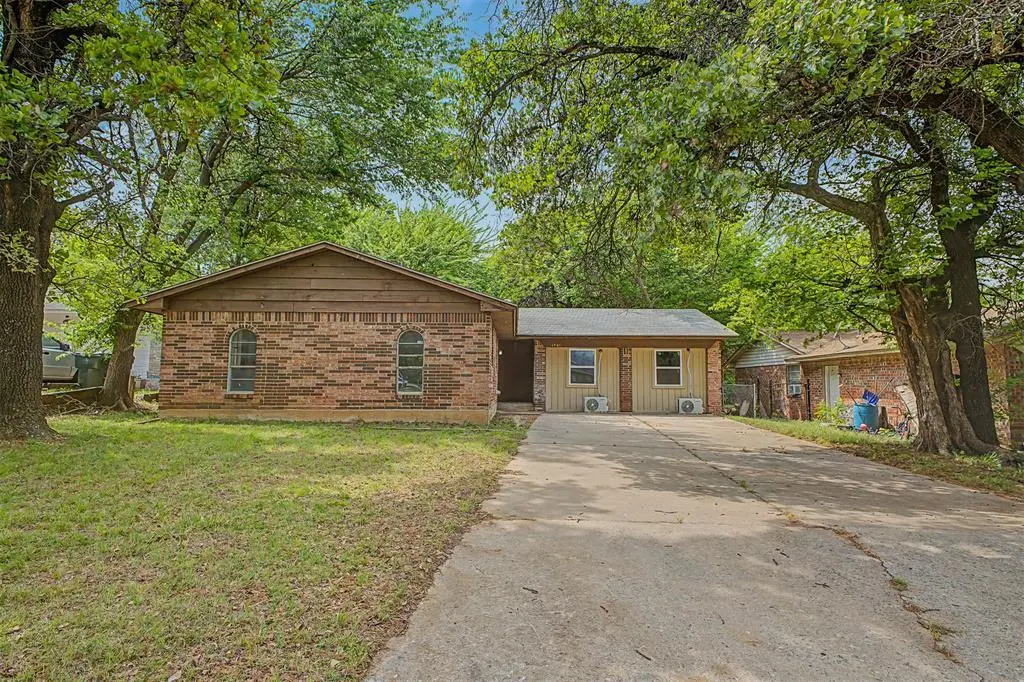
1501 Marydale Ave · Midwest City, OK
Flood risk 1/10 · Minimal
- FEMA flood zone
- X (unshaded)
- Chance of flooding over 30 yrs
- 0.0%
- Est. flood insurance / yr
- $507 – $1,088
Fire risk 2/10 · Minimal
- Est. fire insurance / yr
- $2,463 – $4,575
Heat risk 6/10 · Moderate
- Hot days now (above 107°F)
- 7 days/yr
- Hot days in 30 yrs
- 19 days/yr
Wind risk 2/10 · Minimal
- Chance of severe wind over 30 yrs
- 4.0%
Air-quality risk 2/10 · Minimal
- Unhealthy air days now
- 1 days/yr
- Unhealthy air days in 30 yrs
- 2 days/yr
Risk factors via First Street. Map © Google.
Why this score? — see what drove the D grade
The composite is a weighted blend of 9 inputs, each scored 0–100. Each bar is that input's sub-score; the figure is the points it added to the 100-point composite (weight × sub-score).
- Cash flow +15.9/30.0
- ARV discount +9.3/15.0
- DSCR +4.9/10.0
- Rent growth +3.9/5.0
- 1% rule +3.7/10.0
- Livability +3.6/5.0
- Condition / age +2.5/5.0
- Schools +0.7/10.0
- Appreciation +0.0/10.0
$155,000
🖨 Deal sheet 📄 Offer letter ✓ Due diligence
Listing remarks MLS
Discover the perfect blend of space and affordability in this versatile 5-bedroom Midwest City residence. Situated in the established Oakwood Manor subdivision, this home offers a rare layout with five true bedrooms—ideal for a large family, dedicated home offices, or a private home gym. The classic ranch-style design ensures an easy flow between the kitchen and living areas, creating a welcoming environment for daily living and entertaining. Ideally located just a short drive from local parks, shopping, and major employers, this home provides the square footage you’ve been searching for in a highly convenient location. Whether you are a first-time buyer or looking to upsize, this property offers incredible potential at an unbeatable price point. Welcome home!
Key facts
- 7,200 sq ft lot
- Built 1969
- Listed 61 days
Tags
Neighborhood map
What this means for you Summary
Snapshot
- This is a 3-bed/2.0-bath single-family listed at $155k.
Deal economics
- At list price, monthly cash flow is $73 ($879/yr) — positive.
- The deal already cash-flows at list — no discount required.
- To meet the 1% rule (rent ≥ 1% of price), the offer needs to be $136k (12.6% below list).
- Recommended offer: $136k (12.6% below list) — sets the bar for 1% rule.
- Cap rate 6.9% vs local median 5.6% in Midwest City — meaningfully above typical; check what's discounted (condition, days-on-market, listing class) to confirm the premium yield is real.
Location & tenants
- Location reads 71/100 on livability (#30 in OK) — a middle-class / working-renter tenant base. Strengths: cost of living A+, housing A+, health & safety A; Watch: crime D+, schools D, employment D.
- Oklahoma City (urban): math 7% / reading 10% proficiency, ranked #254 of 270 in OK (top 94%) — low school quality limits family demand, transient renter base, plan for 1-2y turnover; 82% free/reduced lunch — lower-income household profile, screen leases tightly.
- Market conditions: Rents rising fast (+5.7%/yr); 160 active listings in the ZIP; 40 comparable units currently listed for rent nearby; rentals at typical pace (median 16d on market — plan ~3-4 weeks tenant-placement turnaround); 5,365 units permitted in Oklahoma County in 2024 (569 in 5+ unit buildings).
Forward outlook
- Local home prices are declining (-3.0%/yr); year-one equity from $1k of loan paydown is wiped out by about $5k of value loss. Plan a longer hold.
- Oklahoma County population projected at +41% by 2050 — long-run rental-demand tailwind backs the buy-and-hold thesis.
Negotiation context
- It's been on market 61 days — a 6% lower offer ($146k) is reasonable based on typical stale-listing flexibility.
- 5 sale attempts since 27y ago; this cycle's ask has dropped $10k (6%) from the opening price — seller is motivated, your offer sets the floor, not the list.
Risks & watch-outs
- Climate carrying-cost: extreme-heat days projected 7→19/yr by 2055 (HVAC capex compounding) — expect insurance premiums to compound above CPI over the hold.
Questions for the listing agent
- It's been on market 61 days. Have you received any prior offers? Is the seller open to a 13% concession, seller financing, or rate buy-down credit?
- Built in 1969 — when were the roof, HVAC, electrical panel, plumbing, and water heater last replaced?
- Why hasn't it sold? Are there any deal-killer items the seller is aware of (foundation, flood, title, zoning, code violations)?
- Is there a deadline driving the sale (1031 exchange, divorce, estate, relocation)? That informs how much negotiation room exists.
- Schools are D-rated, which usually means shorter tenancies and higher turnover. Who's the typical renter profile here, and what's been the actual vacancy rate?
- Crime grade is D in this area — have there been break-ins, vandalism, or insurance claims at this property in the last 3 years? What carrier currently insures it and at what premium?
- The area grade is low — what's the realistic commute time and amenity access for the typical tenant pool here? Any planned neighborhood developments (good or bad) we should know about?
- What's the average days-on-market for RENTAL listings here right now (not sales)? A rising rental-DOM trend means longer vacancies and softer asking-rent achievability than the comps imply.
- What's the recent tenant-quality profile in this submarket — average credit score on applications, eviction rate, late-payment / NSF rate, and stable-employment percentage? A property-management company in the area should have these aggregated.
- How much new for-sale + rental construction is in the pipeline within 1–3 miles? Heavy new supply typically softens prices + rents 12–24 months out; constrained supply supports both.
Investment metrics
- 1% rule
- 0.87% ✗
- Cap rate
- 6.86%
- Cash-on-cash
- 2.02%
- DSCR
- 1.09
- GRM
- 9.5
CMA / ARV
- ARV (median comp)
- $161,526
- List price
- $155,000
- Delta
- -4.04%
- Verdict
- FAIR
- Comps
- 20 within 1.0 mi
Show comp detail 12 sales within ~0.75 mi
| Address | Dist | Beds/Ba | Sqft | Sold | Price | $/sf | Match |
|---|---|---|---|---|---|---|---|
| 9304 NE 16th St | 0.15mi | 3/1.5 | 1,059 (+2%) | 5mo | $154,000 | $145 | 84 |
| 1500 N Douglas Blvd | 0.24mi | 3/1.0 | 1,066 (+2%) | 2mo | $170,000 | $159 | 78 |
| 1617 Mcgregor Dr | 0.33mi | 3/1.5 | 1,012 (-3%) | 5mo | $105,000 | $104 | 74 |
| 9100 Jennifer Pl | 0.14mi | 4/1.0 (+1) | 1,006 (-3%) | 6mo | $99,000 | $98 | 74 |
| 1521 Mcdonald Dr | 0.26mi | 3/2.0 | 978 (-6%) | 6mo | $149,000 | $152 | 73 |
| 1417 Mcdonald Dr | 0.25mi | 3/1.0 | 918 (-12%) | 1mo | $134,000 | $146 | 64 |
| 1625 Melinda Ln | 0.16mi | 4/1.5 (+1) | 1,162 (+12%) | 4mo | $129,999 | $112 | 63 |
| 1912 N Saint Peter Ave | 0.35mi | 2/1.0 (-1) | 1,110 (+7%) | 3mo | $132,000 | $119 | 61 |
| 9904 Mark Trl | 0.69mi | 3/2.0 | 1,105 (+6%) | 5mo | $175,000 | $158 | 53 |
| 1816 Michell Dr | 0.71mi | 3/2.0 | 1,108 (+6%) | 5mo | $130,000 | $117 | 51 |
| 808 Moraine Ave | 0.67mi | 4/1.5 (+1) | 1,135 (+9%) | 1mo | $150,000 | $132 | 46 |
| 1824 David Ter | 0.69mi | 3/3.0 | 1,146 (+10%) | 6mo | $110,000 | $96 | 42 |
Match score weights: distance 35% · size 25% · config 20% · recency 20%. Top-matched comps best support the ARV.
Projected returns pro-forma
-3.0% appreciation · 5.73% rent growth · sell at horizon
- IRR
- -10.3%
- Equity multiple
- 0.62×
- Total profit
- $-16,655
- Equity at exit
- $23,111
- IRR
- 2.3%
- Equity multiple
- 1.18×
- Total profit
- $7,997
- Equity at exit
- $13,402
Cash invested: $43,400 (down + closing). Projections, not guarantees.
Landlord ↔ Tenant lean methodology
- Overall (STATE)
- 83 Strongly Landlord-Friendly
- State Oklahoma
- 83 Strongly Landlord-Friendly · R+20
- County
- — inherits STATE
- City
- — inherits STATE
ZIP-level market 73130
- Home prices YoY
- -21.0%
- Rents YoY
- 5.7%
- Active inventory
- 160
- Price-to-rent
- 9.5×
Monthly cashflow live
- Estimated rent
- $1,355 high interval (Pro) →
- Mortgage (P&I)
- −$813
- Tax from tax record
- −$120 /mo · $1,440/yr
- Insurance
- −$65
- HOA
- −$0
- Vacancy / Maint / Mgmt
- −$285
- Net cashflow
- $73
Break-even live
UW: 25.0% down · 7.5% · 30yr · 1.5% tax · 5.0% vac · 8.0% maint · 8.0% mgmt
Financing live
Cash to close
- Down payment
- $38,750
- Closing costs
- $4,650
- Reserves months
- —
- Total cash needed
- —
Loan-product check · same deal, 3 products live
Conventional
25% down · 7.5% · 30yr
- Down + closing
- —
- Monthly P&I
- —
- Monthly cashflow
- —
- DSCR
- —
- Eligible?
- —
Personal DTI + credit; lowest rate.
DSCR
20% down · 8.5% · 30yr
- Down + closing
- —
- Monthly P&I
- —
- Monthly cashflow
- —
- DSCR
- —
- Eligible?
- —
No personal income docs; deal must DSCR.
Hard money
10% down · 12.0% · 12mo
- Down + closing
- —
- Monthly P&I
- —
- Monthly cashflow
- —
- DSCR
- —
- Eligible?
- —
Short-term bridge; refi at stabilization.
Rent comps 40 comps
| Address | Beds | Baths | Sqft | Rent | $/sqft | DOM | Units | Dist |
|---|---|---|---|---|---|---|---|---|
| 1400 Marydale Ave Oklahoma City, OK | 3.0 | 1.0 | 1082 | $1,150 | $1.06 | 16d | 1 | 0.08mi |
| 9212 Jennifer Pl Oklahoma City, OK | 3.0 | 2.0 | 960 | $1,250 | $1.30 | 44d | 1 | 0.10mi |
| 1620 Cynthia Dr Oklahoma City, OK | 4.0 | 1.0 | 1203 | $1,450 | $1.21 | 44d | 1 | 0.20mi |
| 1617 Cynthia Dr Oklahoma City, OK | 4.0 | 1.0 | 1161 | $1,450 | $1.25 | 44d | 1 | 0.20mi |
| 1400 Alan Ln Oklahoma City, OK | 3.0 | 2.0 | 1288 | $1,495 | $1.16 | 44d | 1 | 0.22mi |
| 1168 N Douglas Blvd Oklahoma City, OK | 1.0–2.0 | 1.0 | 725 | $1,020 | $1.41 | 17d | 1 | 0.28mi |
| 1525 McGregor Dr Oklahoma City, OK | 3.0 | 1.5 | 1012 | $1,275 | $1.26 | 2d | 1 | 0.31mi |
| 1216 McGregor Dr Oklahoma City, OK | 4.0 | 1.5 | 1212 | $1,495 | $1.23 | 2d | 1 | 0.35mi |
| 1525 N Christine Dr Oklahoma City, OK | 3.0 | 1.5 | 1264 | $1,035 | $0.82 | 3d | 1 | 0.36mi |
| 1617 N Christine Dr Oklahoma City, OK | 2.0 | 2.0 | 962 | $1,050 | $1.09 | 24d | 1 | 0.38mi |
| 1619 N Douglas Blvd Oklahoma City, OK | 3.0 | 2.0 | 1152 | $1,129 | $0.98 | 2d | 1 | 0.39mi |
| 9528 McIntosh Ave Oklahoma City, OK | 3.0 | 2.0 | 1164 | $1,195 | $1.03 | 44d | 1 | 0.39mi |
| 9604 NE 11th St Oklahoma City, OK | 4.0 | 1.0 | 1280 | $1,795 | $1.40 | 2d | 1 | 0.43mi |
| 910 N Oakview Dr Oklahoma City, OK | 3.0 | 2.0 | 1512 | $1,239 | $0.82 | 2d | 1 | 0.60mi |
| 2008 Midridge Dr Oklahoma City, OK | 3.0 | 2.0 | 1232 | $1,325 | $1.08 | 14d | 1 | 0.69mi |
| 1809 Michell Dr Oklahoma City, OK | 3.0 | 1.0 | 1125 | $1,095 | $0.97 | 2d | 1 | 0.69mi |
| 8741 Hillridge Dr Oklahoma City, OK | 3.0 | 2.0 | 1182 | $1,495 | $1.26 | 2d | 1 | 0.73mi |
| 8741 Hillridge Dr Oklahoma City, OK | 3.0 | 2.0 | 1182 | $1,495 | $1.26 | 44d | 1 | 0.73mi |
| 8910 Oak Valley Dr Oklahoma City, OK | 2.0 | 2.0 | 935 | $1,000 | $1.07 | 20d | 1 | 0.75mi |
| 801 Royal Ave Oklahoma City, OK | 3.0 | 1.0 | 951 | $1,200 | $1.26 | 17d | 1 | 0.76mi |
| 8511 Justin Pl Oklahoma City, OK | 2.0 | 1.0 | 962 | $950 | $0.99 | 14d | 1 | 0.77mi |
| 1817 Tim Dr Oklahoma City, OK | 3.0 | 2.0 | 1373 | $1,399 | $1.02 | 2d | 1 | 0.78mi |
| 4033 S Locust Dr Oklahoma City, OK | 2.0 | 1.0 | 800 | $900 | $1.12 | 24d | 1 | 0.78mi |
| 1632 N Spencer Rd Oklahoma City, OK | 2.0 | 1.0 | 772 | $895 | $1.16 | 14d | 1 | 0.78mi |
| 1020 N Spencer Rd Oklahoma City, OK | 2.0 | 1.0 | 962 | $895 | $0.93 | 24d | 1 | 0.80mi |
| 1014 Spencer Rd Oklahoma City, OK | 2.0 | 2.0 | 800 | $1,000 | $1.25 | 44d | 1 | 0.80mi |
| 633 Lotus Ave Oklahoma City, OK | 3.0 | 1.0 | 1038 | $1,300 | $1.25 | 10d | 1 | 0.80mi |
| 604 Moraine Ave Oklahoma City, OK | 3.0 | 1.5 | 1181 | $1,395 | $1.18 | 2d | 1 | 0.84mi |
| 645 Lloyd Ave Oklahoma City, OK | 4.0 | 1.5 | 1186 | $1,650 | $1.39 | 2d | 1 | 0.86mi |
| 629 Lloyd Ave Oklahoma City, OK | 4.0 | 1.5 | 1213 | $1,095 | $0.90 | 4d | 1 | 0.90mi |
| 3721 Parkwoods Ln Oklahoma City, OK | 4.0 | 1.5 | 1266 | $1,625 | $1.28 | 2d | 1 | 0.93mi |
| 1008 Willow Brook Dr Oklahoma City, OK | 3.0 | 1.5 | 1045 | $1,125 | $1.08 | 24d | 1 | 0.98mi |
| 10220 Isaac Dr Oklahoma City, OK | 3.0 | 1.0 | 1106 | $1,250 | $1.13 | 44d | 1 | 0.99mi |
| 3513 Parkwoods Ln Oklahoma City, OK | 3.0 | 1.5 | 903 | $1,150 | $1.27 | 44d | 1 | 1.02mi |
| 3609 Woodside Dr Midwest City, OK | 3.0 | 1.0 | 858 | $995 | $1.16 | 2d | 1 | 1.03mi |
| 405 Lotus Ave Oklahoma City, OK | 3.0 | 2.0 | 1300 | $1,611 | $1.24 | 2d | 1 | 1.07mi |
| 217 Saint Charles Way Oklahoma City, OK | 4.0 | 2.0 | 1448 | $1,525 | $1.05 | 24d | 1 | 1.09mi |
| 1040 Sycamore Dr Oklahoma City, OK | 4.0 | 1.0 | 1144 | $1,595 | $1.39 | 2d | 1 | 1.11mi |
| 10400 Caton Pl Oklahoma City, OK | 3.0 | 2.0 | 1164 | $1,280 | $1.10 | 24d | 1 | 1.12mi |
| 801 Meadowridge Dr Oklahoma City, OK | 3.0 | 1.5 | 1095 | $1,095 | $1.00 | 44d | 1 | 1.13mi |
Listing history 30 events
-
2026-06-18days on market $155,000 Active 61 DOM
-
2026-06-17days on market $155,000 Active 60 DOM
-
2026-06-16days on market $155,000 Active 59 DOM
-
2026-06-15days on market $155,000 Active 58 DOM
-
2026-06-13days on market $155,000 Active 56 DOM
-
2026-06-09days on market $155,000 Active 52 DOM
-
2026-06-08days on market $155,000 Active 51 DOM
-
2026-06-07days on market $155,000 Active 50 DOM
-
2026-06-05days on market $155,000 Active 47 DOM
-
2026-06-03days on market $155,000 Active 46 DOM
-
2026-06-02days on market $155,000 Active 45 DOM
-
2026-06-01days on market $155,000 Active 44 DOM
-
2026-06-01price $155,000 Active 43 DOM
-
2026-05-31days on market $159,900 Active 43 DOM
-
2026-05-08price $159,900 782-char remark
Show marketing remark (782 chars)
Discover the perfect blend of space and affordability in this versatile 5-bedroom Midwest City residence. Situated in the established Oakwood Manor subdivision, this home offers a rare layout with five true bedrooms—ideal for a large family, dedicated home offices, or a private home gym. The classic ranch-style design ensures an easy flow between the kitchen and living areas, creating a welcoming environment for daily living and entertaining. Ideally located just a short drive from local parks, shopping, and major employers, this home provides the square footage you’ve been searching for in a highly convenient location. Whether you are a first-time buyer or looking to upsize, this property offers incredible potential at an unbeatable price point. Welcome home!
-
2026-04-18$165,000 Active 782-char remark
Show marketing remark (782 chars)
Discover the perfect blend of space and affordability in this versatile 5-bedroom Midwest City residence. Situated in the established Oakwood Manor subdivision, this home offers a rare layout with five true bedrooms—ideal for a large family, dedicated home offices, or a private home gym. The classic ranch-style design ensures an easy flow between the kitchen and living areas, creating a welcoming environment for daily living and entertaining. Ideally located just a short drive from local parks, shopping, and major employers, this home provides the square footage you’ve been searching for in a highly convenient location. Whether you are a first-time buyer or looking to upsize, this property offers incredible potential at an unbeatable price point. Welcome home!
-
2025-10-05historical $1,895
-
2025-08-26$1,895
-
2024-07-24soldstatus $628,000
-
2024-07-23soldstatus $125,000 Closed 322-char remark
Show marketing remark (322 chars)
With a reliable tenant in place until November 2024, this property presents a solid investment opportunity with immediate rental income. Whether you're looking to add to your investment portfolio or planning for future occupancy, this property offers flexibility and potential for long-term growth. Leased for $1,350/month
-
2024-04-02status Pending 322-char remark
Show marketing remark (322 chars)
With a reliable tenant in place until November 2024, this property presents a solid investment opportunity with immediate rental income. Whether you're looking to add to your investment portfolio or planning for future occupancy, this property offers flexibility and potential for long-term growth. Leased for $1,350/month
-
2024-03-20status Active 322-char remark
Show marketing remark (322 chars)
With a reliable tenant in place until November 2024, this property presents a solid investment opportunity with immediate rental income. Whether you're looking to add to your investment portfolio or planning for future occupancy, this property offers flexibility and potential for long-term growth. Leased for $1,350/month
-
2024-03-11status Pending 322-char remark
Show marketing remark (322 chars)
With a reliable tenant in place until November 2024, this property presents a solid investment opportunity with immediate rental income. Whether you're looking to add to your investment portfolio or planning for future occupancy, this property offers flexibility and potential for long-term growth. Leased for $1,350/month
-
2024-03-08$149,500 Active 322-char remark
Show marketing remark (322 chars)
With a reliable tenant in place until November 2024, this property presents a solid investment opportunity with immediate rental income. Whether you're looking to add to your investment portfolio or planning for future occupancy, this property offers flexibility and potential for long-term growth. Leased for $1,350/month
-
2022-08-03soldstatus $112,000
-
2010-02-05soldstatus $54,500
-
2004-05-12soldstatus $48,500
-
2000-06-16soldstatus $40,000
-
1999-09-21$40,000
-
1996-01-26soldstatus $18,000
ⓘ Source: listings_history table (triggers on properties + properties_extension) + one-shot
backfill from property_details.listing_events for pre-trigger history.
Tax reassessment forecast OK · Resets to sale price
- Current annual tax
- $1,440 · $120/mo
- Projected year-2 tax
- $1,440 · $120/mo
- Expected delta
- $0/yr ($0/mo · 0.0%)
ⓘ Screening estimate from a state-policy table — verify with the county assessor before closing.
Climate risk First Street
- Flood 1/10 Low FEMA zone X (unshaded) · 0% chance over 30 yrs
- Wildfire 2/10 Low
- Heat 6/10 Major 7 d/yr ≥107°F today · 19 d/yr by 30 yrs out
- Wind 2/10 Low 4% chance of damaging wind over 30 yrs
- Air quality 2/10 Low 1 unhealthy d/yr today · 2 by 30 yrs out
Nearby sold comps map
Loading sold comps map…
Walkable amenities ~0.75 mi
Loading nearby amenities…
Taxation est. · year 1
- Rental income
- $16,263
- − Mortgage interest
- −$8,682
- − Property taxes
- −$1,440
- − Insurance
- −$775
- − Repairs & maintenance
- −$1,301
- − Management
- −$1,301
- − Depreciation
- −$4,509
- Taxable loss
- −$1,746
- Est. tax savings @ 24.0%
- +$419
- After-tax cash flow
- $1,298/yr
For passive investors: Depreciation is non-cash, so a rental often shows a tax loss while cash-flowing — sheltering income. Rental losses are passive: they offset passive income freely, and up to $25,000/yr can offset ordinary (W-2) income if you actively participate and your MAGI is under $100k (phasing out to $0 by $150k); unused losses carry forward. On sale, claimed depreciation is recaptured at up to 25%, and gains may owe capital-gains tax (a 1031 exchange can defer both). Figures are a year-1 estimate at your 24.0% rate — not tax advice; consult a CPA.
Schools (NCES district)
- District
- Oklahoma City
- NCES district ID
- 4022770
- Math proficiency
- 7% ▼ -5.00%
- Reading proficiency
- 10% ▼ -6.00%
- Median HH income
- $35,606
- Composite
- 7.0/100
- National rank
- #9970
- State rank
- #254 of 270 in OK
Livability — Midwest City
- Score
- 71/100
- State rank
- #30
- US rank
- #6637
Category grades
Schools grade is shown separately in the Schools card above.
Census & demographics
- Census place
- Midwest City, OK
- County
- Oklahoma County · 771,644 people
- City population
- 57,386
- Metro
- Oklahoma City, OK
- Population (ZIP)
- 21,476
- Household income
- $71,189
- Rent vs Own
- Severe rent burden
- 378.0
Population outlook (Oklahoma County) Hauer SSP2
- Today (2025)
- 911,875 people
- By 2030
- 982,413 · +7.7%
- By 2040
- 1,130,468 · +24.0%
- By 2050
- 1,288,422 · +41.3%
- By 2075
- 1,711,482 · +87.7%
- By 2100
- 2,088,448 · +129.0%
Race, ethnicity, and origin ACS 2023
- Neighborhood character
- Diverse neighborhood (Simpson 0.60)
- Race & ethnicity
- White 60% Black 18% Two or more races 14% Hispanic / Latino 7% Asian 2% Native American 2%
- Hispanic origin (detail)
- Mexican 6%
- Common ancestry
- Lithuanian 2% Slovak 2% Italian 2%
- Foreign-born
- 3% · Canada
- Languages at home
- 95% English-only · Spanish 3% Tagalog/Filipino 1%
Political lean MEDSL · Oklahoma
- 2024 margin
- Toss-up / Even · D 48.0% · R 49.7% · Other 2.3%
- 2008→2024 swing
- +15.1pp toward D · 2008: -16.8pp · 2024: -1.7pp
- All cycles
- 2024: R+1.7 2020: R+1.1 2016: R+10.5 2012: R+16.7 2008: R+16.8
Not yet ingested
- Civics
- —
Market trends
- HPI YoY
- ▼ -65.22%
- Current HPI
- 245.8385
- Rent YoY
- ▲ 5.73%
- Metro
- Oklahoma City, OK
- State GDP YoY
- ▲ 1.55%
- F500 in state
- 6
Industry mix (Fortune 500 HQ in OK)
| Industry | F500 HQs | Revenue |
|---|---|---|
| Energy | 3 | $48B |
|
||
Price history
+788.3% since first listed16 events — show timeline
- 2026-05-08 Price Changed $159,900 MLSOK
- 2026-04-18 Listed $165,000 MLSOK
- 2025-10-05 Rental Removed $1,895 APPFOLIO
- 2025-08-26 Listed for Rent $1,895 APPFOLIO
- 2024-07-24 Sold (Public Records) $628,000 Public Records
- 2024-07-23 Sold (MLS) $125,000 MLSOK
- 2024-04-02 Pending — MLSOK
- 2024-03-20 Relisted — MLSOK
- 2024-03-11 Pending — MLSOK
- 2024-03-08 Listed $149,500 MLSOK
- 2022-08-03 Sold (Public Records) $112,000 Public Records
- 2010-02-05 Sold (Public Records) $54,500 Public Records
- 2004-05-12 Sold (Public Records) $48,500 Public Records
- 2000-06-16 Sold (MLS) $40,000 MLSOK
- 1999-09-21 Listed $40,000 MLSOK
- 1996-01-26 Sold (Public Records) $18,000 Public Records
Property tax history
+10.7%/yrLatest (2025): $1,440 · +26.0% YoY. Source: county tax records.
Cash-flow waterfall
monthlySold comps — $/sqft
last 12 mo · ≤1 miLoading sold comps…