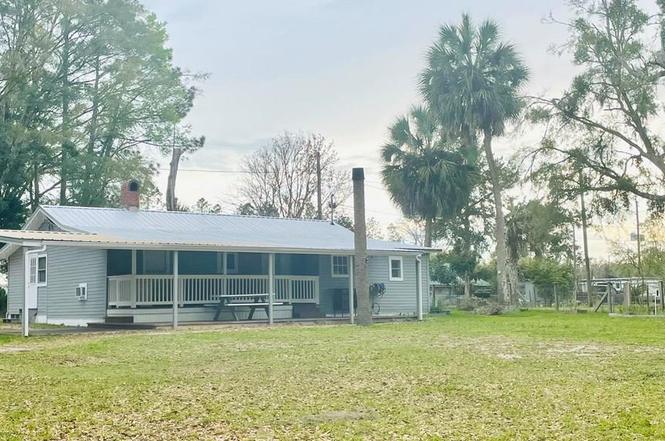
56 NE 723rd St · Fanning Springs, FL
Flood risk 1/10 · Minimal
- FEMA flood zone
- X (unshaded)
- Chance of flooding over 30 yrs
- 0.0%
- Est. flood insurance / yr
- $507 – $1,088
Fire risk 4/10 · Minor
- Est. fire insurance / yr
- $947 – $1,759
Heat risk 8/10 · Major
- Hot days now (above 107°F)
- 7 days/yr
- Hot days in 30 yrs
- 22 days/yr
Wind risk 9/10 · Severe
- Chance of severe wind over 30 yrs
- 99.0%
Air-quality risk 2/10 · Minimal
- Unhealthy air days now
- 1 days/yr
- Unhealthy air days in 30 yrs
- 2 days/yr
Risk factors via First Street. Map © Google.
Why this score? — see what drove the C+ grade
The composite is a weighted blend of 9 inputs, each scored 0–100. Each bar is that input's sub-score; the figure is the points it added to the 100-point composite (weight × sub-score).
- Cash flow +19.8/30.0
- Appreciation +10.0/10.0
- ARV discount +7.5/15.0
- DSCR +6.3/10.0
- Schools +4.2/10.0
- 1% rule +4.1/10.0
- Livability +3.2/5.0
- Rent growth +2.5/5.0
- Condition / age +2.5/5.0
$164,000
🖨 Deal sheet (PDF) 📄 Offer letter ✓ Due diligence
Listing remarks
Welcome to quaint country living within an easy walk to all the daily conveniences. This recently remodeled 3 bedroom, 2 bath home in Old Town proper is situated on a fenced parcel totaling . 67 acres (ADDITIONAL ADJOINING PARCEL IS AVAILABLE - . 66 ACRES). The extremely clean and refreshed home “lives larger” than its size, including a bonus room that can serve as an additional bedroom or office. The owner's insistent perfectionism shines through in this home - all work meticulously executed. The living room features a fully functioning, wood-burning fireplace for cozy winter enjoyment and efficient heating. The dining area adjoins the kitchen, but stands as its own area, close
Key facts
- Fenced parcels
- New metal roof
- Country living
Tags
Property features AI
Exterior
- Parking: Attached parking
- Utilities: Private well water
- Home design: Residential single-family detached home
- Construction: Vinyl siding; Metal roof
- Exterior features: Corner lot; Level lot; Wooded
Interior
- Kitchen: Refrigerator
- Flooring: Laminate; Tile; Vinyl; Wood
- Bathrooms: 2 full bathrooms
- Interior features: 6 total rooms; Crawl space basement
- Laundry & utility: Dryer
Neighborhood map
What this means for you Summary
Snapshot
- This is a 3-bed/1.0-bath single-family listed at $164k.
Deal economics
- At list price, monthly cash flow is $195 ($2k/yr) — positive.
- The deal already cash-flows at list — no discount required.
- To meet the 1% rule (rent ≥ 1% of price), the offer needs to be $149k (9.3% below list).
- Recommended offer: $149k (9.3% below list) — sets the bar for 1% rule.
- Cap rate 7.7% vs local median 3.7% in Fanning Springs — top-decile yield for the area; either an underpriced asset or a hidden risk that comps aren't pricing in. Stress-test before assuming the spread holds.
Location & tenants
- Location reads 63/100 on livability (#739 in FL) — a middle-class / working-renter tenant base. Strengths: crime A+, cost of living A+, housing A+; Watch: health & safety D, amenities F, commute F.
- Dixie (rural): math 52% / reading 50% proficiency, ranked #36 of 73 in FL (top 49%) — acceptable for families but not a draw, mixed tenant base, ~2y average lease; 85% free/reduced lunch — lower-income household profile, screen leases tightly.
- Zoned schools: Old Town Elementary School (math 73% / reading 58%, grade B+, #500 of 2,144 statewide, top 24%, 456 students, 80% FRL); Ruth Rains Middle School (math 48% / reading 49%, grade C-, #274 of 571 statewide, top 50%, 431 students, 76% FRL); Dixie County High School (math 31% / reading 42%, grade F, #351 of 667 statewide, top 54%, 714 students, 70% FRL).
- Market conditions: 263 active listings in the ZIP; 49 units permitted in Dixie County in 2024 (0 in 5+ unit buildings).
Forward outlook
- In year one you build about $18k of equity ($1k loan paydown + $16k appreciation (10.0% local appreciation)).
- Dixie County population projected at -16% by 2050 — secular population decline; favor cash flow + early exit over multi-decade hold.
- At projected returns (10.0% appreciation + 3.0% rent growth), your $46k cash investment doubles in ~3 years — after that, you're playing with house money.
- By year 3, paydown + projected appreciation supports a ~$44k cash-out refi (75% LTV) — recoverable capital for the next deal without selling this one.
Negotiation context
- It's been on market 104 days — a 9% lower offer ($149k) is reasonable based on typical stale-listing flexibility.
- Current owner paid $47k; list at $164k implies a 249% gain — meaningful room to come down on a strong offer.
Risks & watch-outs
- Watch-outs: built in 1935 — expect roof / HVAC / electrical / plumbing capex.
- Climate carrying-cost: severe wind risk, 99% chance of damaging wind over 30y; extreme-heat days projected 7→22/yr by 2055 (HVAC capex compounding) — expect insurance premiums to compound above CPI over the hold.
Questions for the listing agent
- It's been on market 104 days. Have you received any prior offers? Is the seller open to a 9% concession, seller financing, or rate buy-down credit?
- Built in 1935 — when were the roof, HVAC, electrical panel, plumbing, and water heater last replaced?
- Why hasn't it sold? Are there any deal-killer items the seller is aware of (foundation, flood, title, zoning, code violations)?
- Is there a deadline driving the sale (1031 exchange, divorce, estate, relocation)? That informs how much negotiation room exists.
- Schools are F-rated, which usually means shorter tenancies and higher turnover. Who's the typical renter profile here, and what's been the actual vacancy rate?
- What's the average days-on-market for RENTAL listings here right now (not sales)? A rising rental-DOM trend means longer vacancies and softer asking-rent achievability than the comps imply.
- What's the recent tenant-quality profile in this submarket — average credit score on applications, eviction rate, late-payment / NSF rate, and stable-employment percentage? A property-management company in the area should have these aggregated.
- How much new for-sale + rental construction is in the pipeline within 1–3 miles? Heavy new supply typically softens prices + rents 12–24 months out; constrained supply supports both.
Investment metrics
- 1% rule
- 0.91% ✗
- Cap rate
- 7.72%
- Cash-on-cash
- 5.10%
- DSCR
- 1.23
- GRM
- 9.2
CMA / ARV
No comps found within radius.
Projected returns pro-forma
10.0% appreciation · 3.0% rent growth · sell at horizon
- IRR
- 28.0%
- Equity multiple
- 3.21×
- Total profit
- $101,683
- Equity at exit
- $147,744
- IRR
- 24.4%
- Equity multiple
- 7.30×
- Total profit
- $289,516
- Equity at exit
- $318,616
Cash invested: $45,920 (down + closing). Projections, not guarantees.
Landlord ↔ Tenant lean methodology
- Overall (STATE)
- 87 Strongly Landlord-Friendly
- State Florida
- 87 Strongly Landlord-Friendly · R+3
- County
- — inherits STATE
- City
- — inherits STATE
ZIP-level market 32680
- Home prices YoY
- 2.5%
- Active inventory
- 263
- Price-to-rent
- 9.2×
Monthly cashflow live
- Estimated rent
- $1,487 medium interval (Pro) →
- Mortgage (P&I)
- −$860
- Tax from tax record
- −$51 /mo · $612/yr
- Insurance
- −$68
- HOA
- −$0
- Vacancy / Maint / Mgmt
- −$312
- Net cashflow
- $195
Break-even live
Sensitivity live
| Price | -10% $288 | -5% $242 | +0% $195 | +5% $149 | +10% $102 |
|---|---|---|---|---|---|
| Rent | -10% $78 | -5% $137 | +0% $195 | +5% $254 | +10% $313 |
| Rate | -1.0pp $278 | -0.5pp $237 | base $195 | +0.5pp $153 | +1.0pp $110 |
UW: 25.0% down · 7.5% · 30yr · 1.5% tax · 5.0% vac · 8.0% maint · 8.0% mgmt
Financing live
Cash to close
- Down payment
- $41,000
- Closing costs
- $4,920
- Reserves months
- —
- Total cash needed
- —
Loan-product check · same deal, 3 products live
Conventional
25% down · 7.5% · 30yr
- Down + closing
- —
- Monthly P&I
- —
- Monthly cashflow
- —
- DSCR
- —
- Eligible?
- —
Personal DTI + credit; lowest rate.
DSCR
20% down · 8.5% · 30yr
- Down + closing
- —
- Monthly P&I
- —
- Monthly cashflow
- —
- DSCR
- —
- Eligible?
- —
No personal income docs; deal must DSCR.
Hard money
10% down · 12.0% · 12mo
- Down + closing
- —
- Monthly P&I
- —
- Monthly cashflow
- —
- DSCR
- —
- Eligible?
- —
Short-term bridge; refi at stabilization.
Listing history 21 events
-
2026-06-22status $164,000 Pending 104 DOM
-
2026-06-21days on market $164,000 Active 104 DOM
-
2026-06-21days on market $164,000 Active 103 DOM
-
2026-06-18days on market $164,000 Active 101 DOM
-
2026-06-17days on market $164,000 Active 100 DOM
-
2026-06-16days on market $164,000 Active 99 DOM
-
2026-06-15days on market $164,000 Active 98 DOM
-
2026-06-13days on market $164,000 Active 96 DOM
-
2026-06-12days on market $164,000 Active 95 DOM
-
2026-06-09days on market $164,000 Active 92 DOM
-
2026-06-08days on market $164,000 Active 91 DOM
-
2026-06-07days on market $164,000 Active 90 DOM
-
2026-06-07days on market $164,000 Active 89 DOM
-
2026-06-04days on market $164,000 Active 86 DOM
-
2026-06-02days on market $164,000 Active 85 DOM
-
2026-06-01days on market $164,000 Active 84 DOM
-
2026-05-31days on market $164,000 Active 83 DOM
-
2026-05-31days on market $164,000 Active 82 DOM
-
2026-05-03price $164,000
-
2026-03-09$189,000 Active
-
2012-03-23soldstatus $47,000
ⓘ Source: listings_history table (triggers on properties + properties_extension) + one-shot
backfill from property_details.listing_events for pre-trigger history.
Tax reassessment forecast FL · Resets to sale price
- Current annual tax
- $612 · $51/mo
- Projected year-2 tax
- $1,361 · $113/mo
- Expected delta
- +$749/yr (+$62/mo · 122.2%)
ⓘ Screening estimate from a state-policy table — verify with the county assessor before closing.
Climate risk First Street
- Flood 1/10 Low FEMA zone X (unshaded) · 0% chance over 30 yrs
- Wildfire 4/10 Moderate
- Heat 8/10 Severe 7 d/yr ≥107°F today · 22 d/yr by 30 yrs out
- Wind 9/10 Extreme 99% chance of damaging wind over 30 yrs
- Air quality 2/10 Low 1 unhealthy d/yr today · 2 by 30 yrs out
Nearby sold comps map
Loading sold comps map…
Walkable amenities ~0.75 mi
Loading nearby amenities…
Taxation est. · year 1
- Rental income
- $17,843
- − Mortgage interest
- −$9,187
- − Property taxes
- −$612
- − Insurance
- −$820
- − Repairs & maintenance
- −$1,427
- − Management
- −$1,427
- − Depreciation
- −$4,771
- Taxable loss
- −$402
- Est. tax savings @ 24.0%
- +$96
- After-tax cash flow
- $2,440/yr
For passive investors: Depreciation is non-cash, so a rental often shows a tax loss while cash-flowing — sheltering income. Rental losses are passive: they offset passive income freely, and up to $25,000/yr can offset ordinary (W-2) income if you actively participate and your MAGI is under $100k (phasing out to $0 by $150k); unused losses carry forward. On sale, claimed depreciation is recaptured at up to 25%, and gains may owe capital-gains tax (a 1031 exchange can defer both). Figures are a year-1 estimate at your 24.0% rate — not tax advice; consult a CPA.
Schools (NCES district)
- District
- Dixie
- NCES district ID
- 1200450
- Math proficiency
- 52% ▼ -3.00%
- Reading proficiency
- 50% ▼ -4.00%
- Median HH income
- $34,799
- Composite
- 42.18/100
- National rank
- #3290
- State rank
- #36 of 73 in FL
Livability — Fanning Springs
- Score
- 63/100
- State rank
- #739
- US rank
- #15960
Category grades
Schools grade is shown separately in the Schools card above.
Census & demographics
- Population (ZIP)
- 10,445
Population outlook (Dixie County) Hauer SSP2
- Today (2025)
- 15,122 people
- By 2030
- 14,521 · -4.0%
- By 2040
- 13,503 · -10.7%
- By 2050
- 12,671 · -16.2%
- By 2075
- 10,857 · -28.2%
- By 2100
- 8,344 · -44.8%
Race, ethnicity, and origin ACS 2023
- Neighborhood character
- Predominantly White (94%)
- Race & ethnicity
- White 94% Two or more races 4% Hispanic / Latino 3% Black 1%
- Common ancestry
- Romanian 2% Slovak 1% Italian 1%
- Foreign-born
- 3% · Canada
- Languages at home
- 99% English-only · Spanish 1%
Political lean MEDSL · Dixie
- 2024 margin
- Solid R (+70.4) · D 14.5% · R 84.9%
- 2008→2024 swing
- -25.4pp toward R · 2008: -45.0pp · 2024: -70.4pp
- All cycles
- 2024: R+70.4 2020: R+66.0 2016: R+63.2 2012: R+46.9 2008: R+45.0
Not yet ingested
- Civics
- —
Market trends
- HPI YoY
- ▲ 10.22%
- Current HPI
- 424.0037
- Rent YoY
- —
- Metro
- —
- State GDP YoY
- ▲ 3.28%
- F500 in state
- 36
Industry mix (Fortune 500 HQ in FL)
| Industry | F500 HQs | Revenue |
|---|---|---|
| Industrial Technology | 2 | $29B |
|
||
| Insurance | 2 | $17B |
|
||
| Retail | 1 | $60B |
|
||
| Technology Distribution | 1 | $58B |
|
||
| Homebuilding | 1 | $35B |
|
||
| Technology Manufacturing | 1 | $35B |
|
||
Price history
+248.9% since first listed3 events — show timeline
- 2026-05-03 Price Changed $164,000 DGLMLS
- 2026-03-09 Listed $189,000 DGLMLS
- 2012-03-23 Sold (Public Records) $47,000 Public Records
Property tax history
-3.0%/yrLatest (2025): $612 · +4.3% YoY. Source: county tax records.
Cash-flow waterfall
monthlySold comps — $/sqft
last 12 mo · ≤1 miLoading sold comps…