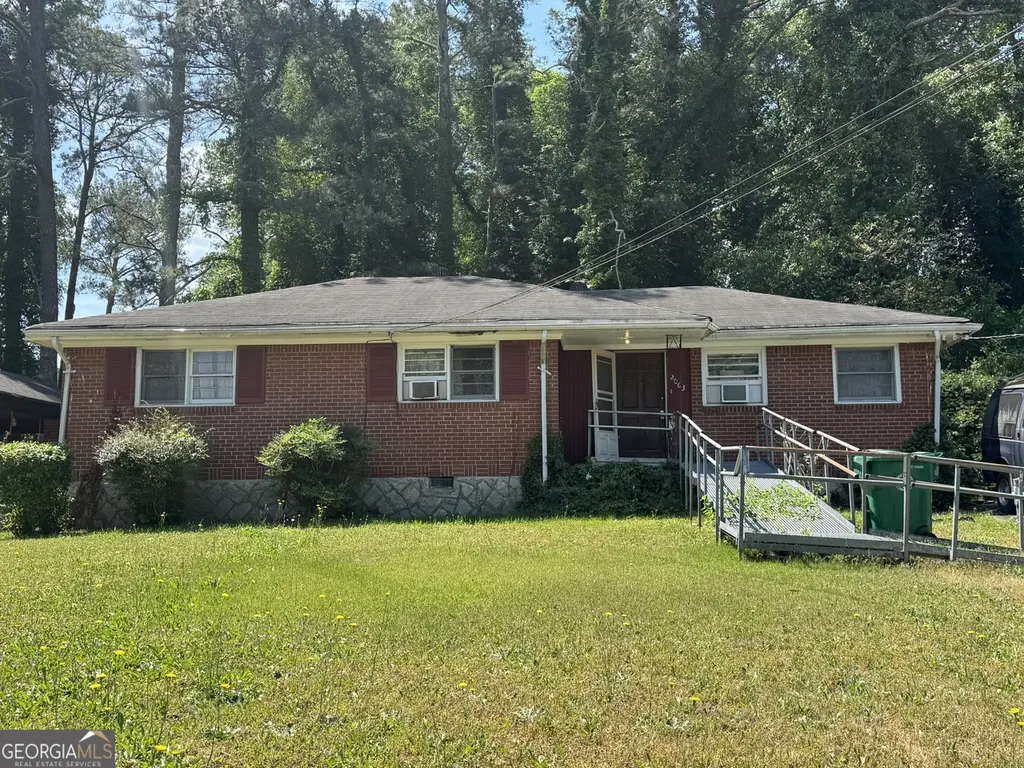
2063 Juanita St · Candler-McAfee, GA
Flood risk 1/10 · Minimal
- FEMA flood zone
- X (unshaded)
- Chance of flooding over 30 yrs
- 0.0%
- Est. flood insurance / yr
- $507 – $1,088
Fire risk 3/10 · Minor
- Est. fire insurance / yr
- $963 – $1,789
Heat risk 5/10 · Moderate
- Hot days now (above 105°F)
- 7 days/yr
- Hot days in 30 yrs
- 18 days/yr
Wind risk 5/10 · Moderate
- Chance of severe wind over 30 yrs
- 26.0%
Air-quality risk 5/10 · Moderate
- Unhealthy air days now
- 6 days/yr
- Unhealthy air days in 30 yrs
- 8 days/yr
Risk factors via First Street. Map © Google.
Why this score? — see what drove the B- grade
The composite is a weighted blend of 9 inputs, each scored 0–100. Each bar is that input's sub-score; the figure is the points it added to the 100-point composite (weight × sub-score).
- Cash flow +30.0/30.0
- DSCR +10.0/10.0
- 1% rule +8.8/10.0
- ARV discount +7.5/15.0
- Rent growth +2.8/5.0
- Livability +2.5/5.0
- Condition / age +2.5/5.0
- Schools +2.1/10.0
- Appreciation +0.0/10.0
$165,000
🖨 Deal sheet 📄 Offer letter ✓ Due diligence
Listing remarks MLS
Sold before ran
Key facts
- 9,583 sq ft lot
- Built 1950
Property features AI
Finance
- Other: Property condition noted as fixer
Exterior
- Parking: Parking pad
- Utilities: Public water; Public sewer; Electricity available; Electric service: Other
- Home design: One-level home; Fee simple ownership; Attic; Entry level: Kitchen level
- Construction: Brick construction; Composition roof
- Exterior features: Waterfrontage: none
Interior
- Kitchen: Kitchen features: Other; Appliances: Other
- Bedrooms: Three main-level bedrooms; Bedroom features: Other
- Flooring: Flooring: Other
- Bathrooms: 1 full bathroom; 1 half bathroom (main level)
- Heating & cooling: Central heating
- Interior features: High-speed Internet available; No shared/common walls; Property listed as a fixer
- Laundry & utility: Laundry features: Other
Neighborhood map
What this means for you Summary
Snapshot
- This is a 3-bed/1.5-bath single-family listed at $165k.
Deal economics
- At list price, monthly cash flow is $818 ($10k/yr) — positive.
- The deal already cash-flows at list — no discount required.
- Meets the 1% rule at list price ($2k rent vs $165k).
- Cap rate 12.2% vs local median 4.2% in Candler-McAfee — top-decile yield for the area; either an underpriced asset or a hidden risk that comps aren't pricing in. Stress-test before assuming the spread holds.
Location & tenants
- Location reads: area grade B — affects rentability + tenant quality, not the cash-flow math above.
- Dekalb County (suburban): math 19% / reading 28% proficiency, ranked #125 of 174 in GA (top 72%) — low school quality limits family demand, transient renter base, plan for 1-2y turnover; 68% free/reduced lunch — lower-income household profile, screen leases tightly.
- Zoned schools: Mcnair High School (math 2% / reading 5%, grade F, #413 of 424 statewide, top 99%, 768 students, 100% FRL) — zoned schools average 100% FRL vs 68% district-wide (32 pts higher); higher-poverty schools than district average — tighter screening recommended.
- Zoned-school proficiency averages 4% at this address vs 24% district-wide (-20 pts) — the specific schools serving this property underperform the Dekalb County average; the district grade overstates school quality for this exact location.
- Market conditions: Rents rising (+1.3%/yr); 422 active listings in the ZIP; 40 comparable units currently listed for rent nearby; rentals at typical pace (median 25d on market — plan ~3-4 weeks tenant-placement turnaround); 1,240 units permitted in DeKalb County in 2024 (385 in 5+ unit buildings).
- This rent runs 43% of the median local income ($63k/yr) — at the standard rent-burdened threshold; future hikes will face affordability resistance.
Forward outlook
- Local home prices are declining (-3.0%/yr); year-one equity from $1k of loan paydown is wiped out by about $5k of value loss. Plan a longer hold.
- DeKalb County population projected at +28% by 2050 — long-run rental-demand tailwind backs the buy-and-hold thesis.
- At projected returns (-3.0% appreciation + 1.3% rent growth), your $46k cash investment doubles in ~7 years — after that, you're playing with house money.
Negotiation context
- Only 1 days on market — expect competitive offers; lowballing is unlikely to land.
- 2 sale attempts with the ask held roughly flat each time — persistent listings suggest the price (not the market) is what's stuck; bring a comps-based counter.
Risks & watch-outs
- Watch-outs: built in 1950 — expect roof / HVAC / electrical / plumbing capex.
- Climate carrying-cost: moderate wind risk, 26% chance of damaging wind over 30y; extreme-heat days projected 7→18/yr by 2055 (HVAC capex compounding) — expect insurance premiums to compound above CPI over the hold.
Questions for the listing agent
- Built in 1950 — when were the roof, HVAC, electrical panel, plumbing, and water heater last replaced?
- Is there a deadline driving the sale (1031 exchange, divorce, estate, relocation)? That informs how much negotiation room exists.
- What's the average days-on-market for RENTAL listings here right now (not sales)? A rising rental-DOM trend means longer vacancies and softer asking-rent achievability than the comps imply.
- What's the recent tenant-quality profile in this submarket — average credit score on applications, eviction rate, late-payment / NSF rate, and stable-employment percentage? A property-management company in the area should have these aggregated.
- How much new for-sale + rental construction is in the pipeline within 1–3 miles? Heavy new supply typically softens prices + rents 12–24 months out; constrained supply supports both.
Investment metrics
- 1% rule
- 1.38% ✓
- Cap rate
- 12.24%
- Cash-on-cash
- 21.25%
- DSCR
- 1.95
- GRM
- 6.1
CMA / ARV
- ARV (on-the-fly)
- $359,142
- Comps found
- 12
Show comp detail 12 sales within ~0.75 mi
| Address | Dist | Beds/Ba | Sqft | Sold | Price | $/sf | Match |
|---|---|---|---|---|---|---|---|
| 2063 Juanita St | 0.00mi | 3/1.5 | 1,501 (-0%) | 1mo | $165,000 | $110 | 99 |
| 2177 Mark Trl | 0.31mi | 3/2.0 | 1,500 (-1%) | 2mo | $358,500 | $239 | 81 |
| 1978 Terry Mill Rd SE | 0.38mi | 3/2.0 | 1,425 (-6%) | 1mo | $385,000 | $270 | 70 |
| 742 Fayetteville Rd SE | 0.64mi | 3/2.0 | 1,510 (+0%) | 0mo | $337,000 | $223 | 68 |
| 2107 Second Ave | 0.20mi | 4/2.0 (+1) | 1,350 (-10%) | 1mo | $330,000 | $244 | 65 |
| 2139 Trailwood Rd | 0.32mi | 4/2.0 (+1) | 1,357 (-10%) | 1mo | $231,000 | $170 | 60 |
| 1933 Camellia Dr | 0.31mi | 3/2.0 | 1,302 (-14%) | 2mo | $285,000 | $219 | 58 |
| 1949 Capri Dr | 0.44mi | 3/1.5 | 1,307 (-13%) | 0mo | $265,000 | $203 | 57 |
| 2093 Wildrose | 0.35mi | 4/2.0 (+1) | 1,306 (-14%) | 1mo | $350,000 | $268 | 53 |
| 2283 Scotty Cir | 0.48mi | 3/2.0 | 1,298 (-14%) | 2mo | $309,000 | $238 | 50 |
| 672 Quillian Ave | 0.52mi | 3/2.0 | 1,289 (-15%) | 2mo | $300,000 | $233 | 48 |
| 682 Quillian Ave | 0.51mi | 4/3.0 (+1) | 1,700 (+13%) | 2mo | $427,500 | $251 | 42 |
Match score weights: distance 35% · size 25% · config 20% · recency 20%. Top-matched comps best support the ARV.
Projected returns pro-forma
-3.0% appreciation · 1.34% rent growth · sell at horizon
- IRR
- 12.0%
- Equity multiple
- 1.47×
- Total profit
- $21,574
- Equity at exit
- $24,602
- IRR
- 19.7%
- Equity multiple
- 2.53×
- Total profit
- $70,811
- Equity at exit
- $14,266
Cash invested: $46,200 (down + closing). Projections, not guarantees.
Landlord ↔ Tenant lean methodology
- Overall (STATE)
- 90 Strongly Landlord-Friendly
- State Georgia
- 90 Strongly Landlord-Friendly · R+3
- County
- — inherits STATE
- City
- — inherits STATE
ZIP-level market 30032
- Rents YoY
- 1.3%
- Active inventory
- 422
- Price-to-rent
- 6.1×
Monthly cashflow live
- Estimated rent
- $2,269 high interval (Pro) →
- Mortgage (P&I)
- −$865
- Tax from tax record
- −$40 /mo · $485/yr
- Insurance
- −$69
- HOA
- −$0
- Vacancy / Maint / Mgmt
- −$477
- Net cashflow
- $818
Break-even live
UW: 25.0% down · 7.5% · 30yr · 1.5% tax · 5.0% vac · 8.0% maint · 8.0% mgmt
Financing live
Cash to close
- Down payment
- $41,250
- Closing costs
- $4,950
- Reserves months
- —
- Total cash needed
- —
Loan-product check · same deal, 3 products live
Conventional
25% down · 7.5% · 30yr
- Down + closing
- —
- Monthly P&I
- —
- Monthly cashflow
- —
- DSCR
- —
- Eligible?
- —
Personal DTI + credit; lowest rate.
DSCR
20% down · 8.5% · 30yr
- Down + closing
- —
- Monthly P&I
- —
- Monthly cashflow
- —
- DSCR
- —
- Eligible?
- —
No personal income docs; deal must DSCR.
Hard money
10% down · 12.0% · 12mo
- Down + closing
- —
- Monthly P&I
- —
- Monthly cashflow
- —
- DSCR
- —
- Eligible?
- —
Short-term bridge; refi at stabilization.
Rent comps 40 comps
| Address | Beds | Baths | Sqft | Rent | $/sqft | DOM | Units | Dist |
|---|---|---|---|---|---|---|---|---|
| 2043 Juanita St Decatur, GA | 3.0 | 2.0 | 1500 | $3,000 | $2.00 | 43d | 1 | 0.05mi |
| 2181 Juanita St Decatur, GA | 4.0 | 3.0 | 1595 | $3,500 | $2.19 | 24d | 1 | 0.18mi |
| 2123 Second Ave Decatur, GA | 4.0 | 2.0 | 1302 | $2,075 | $1.59 | 18d | 1 | 0.19mi |
| 2078 E Lilac Ln Decatur, GA | 3.0 | 1.0 | 1160 | $1,600 | $1.38 | 43d | 1 | 0.27mi |
| 1932 Camellia Dr Decatur, GA | 4.0 | 3.0 | 2200 | $1,800 | $0.82 | 22d | 1 | 0.30mi |
| 2006 McAfee Pl Decatur, GA | 3.0 | 2.0 | 1128 | $2,295 | $2.03 | 24d | 1 | 0.33mi |
| 1916 Longdale Dr Decatur, GA | 3.0 | 2.0 | 1176 | $2,395 | $2.04 | 43d | 1 | 0.37mi |
| 2163 Lilac Ln Decatur, GA | 3.0 | 2.0 | 1107 | $2,150 | $1.94 | 43d | 1 | 0.42mi |
| 2176 Lilac Ln Decatur, GA | 3.0 | 2.0 | 1800 | $1,395 | $0.78 | 24d | 1 | 0.45mi |
| 2283 Scotty Cir Decatur, GA | 3.0 | 2.0 | 1298 | $2,150 | $1.66 | 43d | 1 | 0.46mi |
| 1840 Camellia Dr Decatur, GA | 3.0 | 2.0 | 1340 | $1,950 | $1.46 | 22d | 1 | 0.51mi |
| 1840 Camellia Dr Decatur, GA | 3.0 | 2.0 | 1394 | $2,100 | $1.51 | 43d | 1 | 0.51mi |
| 1892 Terry Mill Rd SE Atlanta, GA | 4.0 | 2.0 | 1925 | $2,975 | $1.55 | 43d | 1 | 0.58mi |
| 1881 2nd Ave Decatur, GA | 3.0 | 1.0–2.5 | 1010 | $3,761 | $3.72 | 2d | 60 | 0.62mi |
| 773 Fayetteville Rd SE Atlanta, GA | 3.0 | 2.0 | 1085 | $2,100 | $1.94 | 43d | 1 | 0.66mi |
| 1878 South Hampton Ln SE Atlanta, GA | 3.0 | 2.5 | 1890 | $2,616 | $1.38 | 24d | 1 | 0.67mi |
| 2386 Cresta Dr Decatur, GA | 3.0 | 2.5 | 1107 | $2,000 | $1.81 | 43d | 1 | 0.74mi |
| 2000 Bencal Dr SE Atlanta, GA | 3.0 | 2.0 | 1500 | $1,850 | $1.23 | 24d | 1 | 0.77mi |
| 2062 Bencal Dr SE Atlanta, GA | 3.0 | 2.0 | 1260 | $1,650 | $1.31 | 24d | 1 | 0.80mi |
| 2480 Flat Shoals Rd Decatur, GA | 1.0–3.0 | 1.0–2.0 | 1017 | $2,149 | $2.11 | 2d | 23 | 0.82mi |
| 1761 Terry Mill Rd SE Atlanta, GA | 3.0 | 1.5 | 1296 | $1,900 | $1.47 | 17d | 1 | 0.84mi |
| 2201 Glenwood Ave SE Atlanta, GA | 2.0 | 1.0–2.0 | 819 | $2,699 | $3.30 | 20d | 5 | 0.85mi |
| 2570 Castellan Dr Atlanta, GA | 3.0 | 2.5 | 1576 | $2,700 | $1.71 | 24d | 1 | 0.89mi |
| 460 E Lake Blvd SE Atlanta, GA | 1.0–2.0 | 1.0–2.0 | 1104 | $1,699 | $1.54 | 2d | 6 | 0.91mi |
| 2191 Greystone Way Decatur, GA | 3.0 | 1.0 | 1053 | $1,800 | $1.71 | 43d | 1 | 0.95mi |
| 1930 Normal St Decatur, GA | 4.0 | 2.0 | 1459 | $1,850 | $1.27 | 43d | 1 | 1.00mi |
| 2461 Fontaine Cir Decatur, GA | 3.0 | 2.0 | 1193 | $1,795 | $1.50 | 24d | 1 | 1.02mi |
| 2126 Rexford Dr Decatur, GA | 3.0 | 1.5 | 1092 | $1,400 | $1.28 | 43d | 1 | 1.03mi |
| 1930 Flat Shoals Rd SE Atlanta, GA | 1.0–2.0 | 1.0–1.5 | 1045 | $1,479 | $1.42 | 5d | 17 | 1.08mi |
| 2912 Glenwood Ave SE Atlanta, GA | 2.0 | 1.0 | 1063 | $1,695 | $1.59 | 22d | 1 | 1.08mi |
| 2378 Charleston Pointe SE Atlanta, GA | 3.0 | 3.0 | 1604 | $2,100 | $1.31 | 22d | 1 | 1.10mi |
| 2407 Summerland Dr Decatur, GA | 3.0 | 2.0 | 1515 | $1,800 | $1.19 | 2d | 1 | 1.12mi |
| 2524 Habersham Dr Decatur, GA | 3.0 | 1.0 | 1251 | $1,395 | $1.12 | 5d | 1 | 1.13mi |
| 2529 Habersham Dr Decatur, GA | 4.0 | 2.0 | 1272 | $7,895 | $6.21 | 20d | 1 | 1.15mi |
| 1872 Cannon St Decatur, GA | 4.0 | 3.0 | 1518 | $2,695 | $1.78 | 5d | 1 | 1.16mi |
| 2447 Whites Mill Ln Decatur, GA | 4.0 | 2.5 | 2050 | $2,349 | $1.15 | 43d | 1 | 1.20mi |
| 254 2nd Ave SE Atlanta, GA | 3.0 | 2.0 | 1715 | $2,895 | $1.69 | 4d | 1 | 1.20mi |
| 2553 Habersham Dr Decatur, GA | 2.0 | 4.5 | 1272 | $1,520 | $1.19 | 12d | 1 | 1.20mi |
| 2297 Charleston Pointe SE Atlanta, GA | 3.0 | 2.0 | 1604 | $2,200 | $1.37 | 43d | 1 | 1.20mi |
| 2435 Bouldercliff Way SE Unit B Atlanta, GA | 2.0 | 1.0 | 1236 | $1,600 | $1.29 | 43d | 1 | 1.21mi |
Listing history 4 events
-
2026-05-20status Pending
Show marketing remark (15 chars)
Sold before ran
-
2026-05-20status Under Contract 15-char remark
Show marketing remark (15 chars)
Sold before ran
-
2026-05-20$165,000 Active
Show marketing remark (15 chars)
Sold before ran
-
2026-05-20$165,000 New 15-char remark
Show marketing remark (15 chars)
Sold before ran
ⓘ Source: listings_history table (triggers on properties + properties_extension) + one-shot
backfill from property_details.listing_events for pre-trigger history.
Tax reassessment forecast GA · Resets to sale price
- Current annual tax
- $485 · $40/mo
- Projected year-2 tax
- $1,518 · $126/mo
- Expected delta
- +$1,033/yr (+$86/mo · 213.2%)
ⓘ Screening estimate from a state-policy table — verify with the county assessor before closing.
Climate risk First Street
- Flood 1/10 Low FEMA zone X (unshaded) · 0% chance over 30 yrs
- Wildfire 3/10 Moderate
- Heat 5/10 Major 7 d/yr ≥105°F today · 18 d/yr by 30 yrs out
- Wind 5/10 Major 26% chance of damaging wind over 30 yrs
- Air quality 5/10 Major 6 unhealthy d/yr today · 8 by 30 yrs out
Nearby sold comps map
Loading sold comps map…
Walkable amenities ~0.75 mi
Loading nearby amenities…
Taxation est. · year 1
- Rental income
- $27,229
- − Mortgage interest
- −$9,243
- − Property taxes
- −$485
- − Insurance
- −$825
- − Repairs & maintenance
- −$2,178
- − Management
- −$2,178
- − Depreciation
- −$4,800
- Taxable income
- $7,520
- Est. tax owed @ 24.0%
- −$1,805
- After-tax cash flow
- $8,013/yr
For passive investors: Depreciation is non-cash, so a rental often shows a tax loss while cash-flowing — sheltering income. Rental losses are passive: they offset passive income freely, and up to $25,000/yr can offset ordinary (W-2) income if you actively participate and your MAGI is under $100k (phasing out to $0 by $150k); unused losses carry forward. On sale, claimed depreciation is recaptured at up to 25%, and gains may owe capital-gains tax (a 1031 exchange can defer both). Figures are a year-1 estimate at your 24.0% rate — not tax advice; consult a CPA.
Schools (NCES district)
- District
- Dekalb County
- NCES district ID
- 1301740
- Math proficiency
- 19% ▼ -12.00%
- Reading proficiency
- 28% ▼ -7.00%
- Median HH income
- $51,448
- Composite
- 20.92/100
- National rank
- #8482
- State rank
- #125 of 174 in GA
Livability — Candler-McAfee
No livability data for this city. (Only ~50 U.S. cities are tracked.)
Census & demographics
- Census place
- Candler-McAfee, GA
- County
- Dekalb County · 782,738 people
- Metro
- Atlanta-Sandy Springs-Alpharetta, GA
- Population (ZIP)
- 42,948
- Household income
- $62,765
- Rent vs Own
- Severe rent burden
- 2097.0
Population outlook (DeKalb County) Hauer SSP2
- Today (2025)
- 839,977 people
- By 2030
- 891,768 · +6.2%
- By 2040
- 988,894 · +17.7%
- By 2050
- 1,074,583 · +27.9%
- By 2075
- 1,245,026 · +48.2%
- By 2100
- 1,303,135 · +55.1%
Race, ethnicity, and origin ACS 2023
- Neighborhood character
- Predominantly Black (70%)
- Race & ethnicity
- Black 70% White 18% Two or more races 6% Hispanic / Latino 5% Asian 2%
- Hispanic origin (detail)
- Mexican 2%
- Common ancestry
- Slovak 1% Italian 1% Serbian 1%
- Foreign-born
- 7% · Canada, China, Guatemala
- Languages at home
- 91% English-only · Spanish 4% Arabic 1% Other Indo-European 0%
Political lean MEDSL · DeKalb
- 2024 margin
- Solid D (+64.8) · D 81.9% · R 17.1% · Other 1.0%
- 2008→2024 swing
- +6.1pp toward D · 2008: 58.6pp · 2024: 64.8pp
- All cycles
- 2024: D+64.8 2020: D+67.4 2016: D+64.8 2012: D+56.8 2008: D+58.6
Not yet ingested
- Civics
- —
Market trends
- HPI YoY
- ▼ -203.83%
- Current HPI
- 221.0467
- Rent YoY
- ▲ 1.34%
- Metro
- Atlanta-Sandy Springs-Alpharetta, GA
- State GDP YoY
- ▲ 2.66%
- F500 in state
- 28
Industry mix (Fortune 500 HQ in GA)
| Industry | F500 HQs | Revenue |
|---|---|---|
| Paper / Packaging | 2 | $29B |
|
||
| Retail | 1 | $160B |
|
||
| Transportation / Logistics | 1 | $91B |
|
||
| Airlines | 1 | $62B |
|
||
| Consumer Goods | 1 | $47B |
|
||
| Utilities | 1 | $25B |
|
||
Price history
+0.0% since first listed4 events — show timeline
- 2026-05-20 Pending — FMLS
- 2026-05-20 Pending — GAMLS
- 2026-05-20 Listed $165,000 GAMLS
- 2026-05-20 Listed $165,000 FMLS
Property tax history
+2.7%/yrLatest (2025): $485 · -9.1% YoY. Source: county tax records.
Cash-flow waterfall
monthlySold comps — $/sqft
last 12 mo · ≤1 miLoading sold comps…