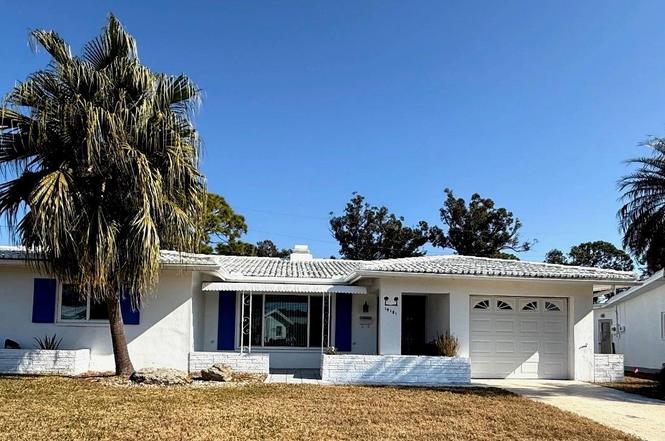
14181 90th Ave · Seminole, FL
Flood risk 1/10 · Minimal
- FEMA flood zone
- X (unshaded)
- Chance of flooding over 30 yrs
- 0.0%
- Est. flood insurance / yr
- $507 – $1,088
Fire risk 1/10 · Minimal
- Est. fire insurance / yr
- $947 – $1,759
Heat risk 10/10 · Severe
- Hot days now (above 107°F)
- 7 days/yr
- Hot days in 30 yrs
- 27 days/yr
Wind risk 10/10 · Severe
- Chance of severe wind over 30 yrs
- 99.0%
Air-quality risk 3/10 · Minor
- Unhealthy air days now
- 2 days/yr
- Unhealthy air days in 30 yrs
- 3 days/yr
Risk factors via First Street. Map © Google.
Why this score? — see what drove the B grade
The composite is a weighted blend of 9 inputs, each scored 0–100. Each bar is that input's sub-score; the figure is the points it added to the 100-point composite (weight × sub-score).
- Cash flow +25.6/30.0
- ARV discount +15.0/15.0
- DSCR +8.5/10.0
- 1% rule +8.3/10.0
- Livability +4.4/5.0
- Schools +4.3/10.0
- Rent growth +2.5/5.0
- Condition / age +2.5/5.0
- Appreciation +0.0/10.0
$309,000
🖨 Deal sheet 📄 Offer letter ✓ Due diligence
Listing remarks
Welcome to Tamarac by the Gulf, a premier 55+ community conveniently located just minutes from shopping, entertainment and the beach! This home is the Skipper floor plan, the largest model in Tamarac, boasting generous room sizes and an inside laundry room. Location!! The park is your backyard. Walk out and enjoy a one-mile loop or a two-mile loop through the former golf course, which is now a Pinellas County Park. Bird watching is fabulous with a great variety in the ponds, bushes and trees. Or just take in the view from the Family Room through the large windows. Relax and enjoy the outdoors in the covered front porch or the side screened porch. Versatile floor plan gives a variety of cho
Key facts
- Inside laundry room
- 6,447 sq ft lot
- Garage
Tags
Property features AI
Finance
- Other: Lease restrictions apply; Total annual fees $3,024
- HOA & community: Monthly HOA fee of $252 (includes pool, maintenance of grounds, private road, sewer, trash, water); Buyer/association approval required; Association amenities: clubhouse, pool, shuffleboard court; deed restrictions; golf carts allowed; reclaimed water irrigation; Pets allowed (cats and dogs; number limit)
Exterior
- Parking: Driveway; Attached garage with garage door opener; 1-car garage
- Utilities: Public water; Public sewer; Electricity connected
- Home design: Single-family residence; One story; South-facing
- Construction: Stucco construction; Tile roof; Slab foundation; Built as model 'SKIPPER'
- Exterior features: Front porch; Awnings; Irrigation equipment; Trees and landscaped yard; Private maintained asphalt road
Interior
- Kitchen: Refrigerator
- Bedrooms: 2 bedrooms
- Flooring: Carpet; Tile
- Bathrooms: 2 full bathrooms
- Heating & cooling: Electric heat; Central air conditioning
- Interior features: Ceiling fans; Open floor plan; Walk-in closets; Window treatments; Skylight(s)
- Laundry & utility: Laundry room; Washer; Dryer
Neighborhood map
What this means for you Summary
Snapshot
- This is a 2-bed/2.0-bath single-family listed at $309k.
Deal economics
- At list price, monthly cash flow is $728 ($9k/yr) — positive.
- The deal already cash-flows at list — no discount required.
- Meets the 1% rule at list price ($4k rent vs $309k).
- Recommended offer: $272k (12.0% below list) — sets the bar for market timing.
- Cap rate 9.1% vs local median 3.8% in Seminole — top-decile yield for the area; either an underpriced asset or a hidden risk that comps aren't pricing in. Stress-test before assuming the spread holds.
Location & tenants
- Location reads 88/100 on livability (#5 in FL, #174 nationally) — a professional / high-income tenant draw. Strengths: commute A+, housing A+, health & safety A+.
- Pinellas (suburban): math 51% / reading 51% proficiency, ranked #31 of 73 in FL (top 42%) — acceptable for families but not a draw, mixed tenant base, ~2y average lease.
- Market conditions: 146 active listings in the ZIP; 17 comparable units currently listed for rent nearby; rentals leasing fast (median 11d on market — plan ~1-2 weeks tenant-placement turnaround); 2,676 units permitted in Pinellas County in 2024 (1,422 in 5+ unit buildings).
Forward outlook
- Local home prices are declining (-3.0%/yr); year-one equity from $2k of loan paydown is wiped out by about $9k of value loss. Plan a longer hold.
- Pinellas County population projected at +14% by 2050 — modest demand growth; plan on rents tracking national, not racing it.
Negotiation context
- It's been on market 122 days — a 12% lower offer ($272k) is reasonable based on typical stale-listing flexibility.
Risks & watch-outs
- Climate carrying-cost: severe wind risk, 99% chance of damaging wind over 30y; extreme-heat days projected 7→27/yr by 2055 (HVAC capex compounding) — expect insurance premiums to compound above CPI over the hold.
Questions for the listing agent
- It's been on market 122 days. Have you received any prior offers? Is the seller open to a 12% concession, seller financing, or rate buy-down credit?
- Built in 1968 — when were the roof, HVAC, electrical panel, plumbing, and water heater last replaced?
- What does the HOA fee cover, when was the last increase, and are there any pending special assessments or reserve-fund shortfalls?
- Why hasn't it sold? Are there any deal-killer items the seller is aware of (foundation, flood, title, zoning, code violations)?
- Is there a deadline driving the sale (1031 exchange, divorce, estate, relocation)? That informs how much negotiation room exists.
- Schools are B-rated — typically a magnet for longer-tenancy family renters. What's the average tenant stay here, and is there a school-zone premium baked into asking?
- What's the average days-on-market for RENTAL listings here right now (not sales)? A rising rental-DOM trend means longer vacancies and softer asking-rent achievability than the comps imply.
- What's the recent tenant-quality profile in this submarket — average credit score on applications, eviction rate, late-payment / NSF rate, and stable-employment percentage? A property-management company in the area should have these aggregated.
- How much new for-sale + rental construction is in the pipeline within 1–3 miles? Heavy new supply typically softens prices + rents 12–24 months out; constrained supply supports both.
Investment metrics
- 1% rule
- 1.33% ✓
- Cap rate
- 9.12%
- Cash-on-cash
- 10.09%
- DSCR
- 1.45
- GRM
- 6.2
CMA / ARV
- ARV (on-the-fly)
- $505,896
- Comps found
- 12
Show comp detail 12 sales within ~0.75 mi
| Address | Dist | Beds/Ba | Sqft | Sold | Price | $/sf | Match |
|---|---|---|---|---|---|---|---|
| 14362 93rd Ave | 0.22mi | 2/2.0 | 1,576 (0%) | 1mo | $360,000 | $228 | 89 |
| 14128 87th Ave | 0.20mi | 2/2.0 | 1,576 (0%) | 3mo | $424,000 | $269 | 88 |
| 13996 Barbados Dr | 0.51mi | 3/2.0 (+1) | 1,522 (-3%) | 0mo | $515,000 | $338 | 65 |
| 13845 94th Ave | 0.41mi | 3/2.5 (+1) | 1,656 (+5%) | 2mo | $499,000 | $301 | 63 |
| 13883 Jamaica Dr | 0.50mi | 2/2.0 | 1,465 (-7%) | 3mo | $405,000 | $276 | 63 |
| 13931 Dominica Dr | 0.64mi | 3/2.0 (+1) | 1,562 (-1%) | 3mo | $440,000 | $282 | 61 |
| 13840 94th Ave | 0.39mi | 2/2.0 | 1,396 (-11%) | 2mo | $385,000 | $276 | 61 |
| 13891 88th Ter | 0.30mi | 3/2.0 (+1) | 1,792 (+14%) | 0mo | $575,000 | $321 | 58 |
| 13725 Bermuda Dr | 0.54mi | 3/2.0 (+1) | 1,407 (-11%) | 5mo | $460,000 | $327 | 48 |
| 13625 86th Ave | 0.57mi | 3/2.0 (+1) | 1,789 (+14%) | 1mo | $600,000 | $335 | 45 |
| 14096 Passage Way | 0.68mi | 3/2.0 (+1) | 1,800 (+14%) | 1mo | $652,500 | $363 | 38 |
| 9078 134th Way | 0.66mi | 3/2.0 (+1) | 1,800 (+14%) | 3mo | $587,500 | $326 | 38 |
Match score weights: distance 35% · size 25% · config 20% · recency 20%. Top-matched comps best support the ARV.
Projected returns pro-forma
-3.0% appreciation · 3.0% rent growth · sell at horizon
- IRR
- -1.0%
- Equity multiple
- 0.96×
- Total profit
- $-3,430
- Equity at exit
- $46,073
- IRR
- 8.7%
- Equity multiple
- 1.67×
- Total profit
- $57,916
- Equity at exit
- $26,717
Cash invested: $86,520 (down + closing). Projections, not guarantees.
Landlord ↔ Tenant lean methodology
- Overall (STATE)
- 87 Strongly Landlord-Friendly
- State Florida
- 87 Strongly Landlord-Friendly · R+3
- County
- — inherits STATE
- City
- — inherits STATE
ZIP-level market 33776
- Active inventory
- 146
- Price-to-rent
- 6.2×
Monthly cashflow live
- Estimated rent
- $4,122 high interval (Pro) →
- Mortgage (P&I)
- −$1,620
- Tax from tax record
- −$528 /mo · $6,333/yr
- Insurance
- −$129
- HOA
- −$252
- Vacancy / Maint / Mgmt
- −$866
- Net cashflow
- $728
Break-even live
UW: 25.0% down · 7.5% · 30yr · 1.5% tax · 5.0% vac · 8.0% maint · 8.0% mgmt
Financing live
Cash to close
- Down payment
- $77,250
- Closing costs
- $9,270
- Reserves months
- —
- Total cash needed
- —
Loan-product check · same deal, 3 products live
Conventional
25% down · 7.5% · 30yr
- Down + closing
- —
- Monthly P&I
- —
- Monthly cashflow
- —
- DSCR
- —
- Eligible?
- —
Personal DTI + credit; lowest rate.
DSCR
20% down · 8.5% · 30yr
- Down + closing
- —
- Monthly P&I
- —
- Monthly cashflow
- —
- DSCR
- —
- Eligible?
- —
No personal income docs; deal must DSCR.
Hard money
10% down · 12.0% · 12mo
- Down + closing
- —
- Monthly P&I
- —
- Monthly cashflow
- —
- DSCR
- —
- Eligible?
- —
Short-term bridge; refi at stabilization.
Rent comps 17 comps
| Address | Beds | Baths | Sqft | Rent | $/sqft | DOM | Units | Dist |
|---|---|---|---|---|---|---|---|---|
| 14414 91st Ave Seminole, FL | 3.0 | 2.5 | 2083 | $8,000 | $3.84 | 24d | 1 | 0.16mi |
| 9262 140th Ln Seminole, FL | 2.0 | 2.0 | 1402 | $4,500 | $3.21 | 4d | 1 | 0.20mi |
| 9433 Harbor Greens Way #504 Seminole, FL | 2.0 | 2.0 | 1200 | $2,500 | $2.08 | 4d | 1 | 0.27mi |
| 9652 Commodore Dr Seminole, FL | 3.0 | 2.0 | 1680 | $2,800 | $1.67 | 10d | 1 | 0.43mi |
| 13788 84th Ter Seminole, FL | 3.0 | 2.0 | 1330 | $2,850 | $2.14 | 24d | 1 | 0.51mi |
| 13610 87th Pl Seminole, FL | 3.0 | 2.0 | 1216 | $2,195 | $1.81 | 16d | 1 | 0.53mi |
| 19111 Vista Bay Dr #612 Indian Shores, FL | 2.0 | 2.0 | 1265 | $6,000 | $4.74 | 2d | 1 | 0.69mi |
| 19111 Vista Bay Dr Indian Shores, FL | 2.0 | 2.0 | 1265 | $4,550 | $3.60 | 3d | 2 | 0.69mi |
| 19111 Vista Bay Dr Indian Shores, FL | 2.0 | 2.0 | 1310 | $4,200 | $3.21 | 24d | 3 | 0.69mi |
| 19610 Gulf Blvd #101 Indian Shores, FL | 2.0 | 2.0 | 1100 | $3,000 | $2.73 | 24d | 1 | 0.70mi |
| 13607 101st Ter Seminole, FL | 2.0 | 2.0 | 1503 | $3,850 | $2.56 | 4d | 1 | 0.86mi |
| 19829 Gulf Blvd Indian Shores, FL | 2.0 | 2.0 | 1400 | $3,350 | $2.39 | 7d | 1 | 0.90mi |
| 10215 Regal Dr #4 Largo, FL | 2.0 | 2.0 | 1105 | $2,300 | $2.08 | 4d | 1 | 0.99mi |
| 10216 Regal Dr #201 Largo, FL | 2.0 | 2.0 | 1100 | $2,000 | $1.82 | 14d | 1 | 1.03mi |
| 14623 Sunset Dr Largo, FL | 3.0 | 2.0 | 1621 | $2,545 | $1.57 | 4d | 1 | 1.26mi |
| 12932 81st Ave Seminole, FL | 3.0 | 2.0 | 1207 | $2,600 | $2.15 | 24d | 1 | 1.26mi |
| 12644 81st Ter Seminole, FL | 3.0 | 2.0 | 1426 | $2,590 | $1.82 | 24d | 1 | 1.44mi |
HOA detail
- Monthly dues
- $252 · $3,024/yr
Listing history 15 events
-
2026-06-16status $309,000 Pending 122 DOM
-
2026-06-15days on market $309,000 Active 122 DOM
-
2026-06-13days on market $309,000 Active 120 DOM
-
2026-06-09days on market $309,000 Active 116 DOM
-
2026-06-08days on market $309,000 Active 115 DOM
-
2026-06-08price $309,000 Active 114 DOM
-
2026-06-07days on market $329,900 Active 114 DOM
-
2026-06-04days on market $329,900 Active 111 DOM
-
2026-06-03days on market $329,900 Active 110 DOM
-
2026-06-01days on market $329,900 Active 108 DOM
-
2026-05-31days on market $329,900 Active 107 DOM
-
2026-05-22price $329,900
-
2026-05-09price $339,900
-
2026-04-08price $359,900
-
2026-02-13$389,900 Active
ⓘ Source: listings_history table (triggers on properties + properties_extension) + one-shot
backfill from property_details.listing_events for pre-trigger history.
Tax reassessment forecast FL · Resets to sale price
- Current annual tax
- $6,333 · $528/mo
- Projected year-2 tax
- $6,333 · $528/mo
- Expected delta
- $0/yr ($0/mo · 0.0%)
ⓘ Screening estimate from a state-policy table — verify with the county assessor before closing.
Climate risk First Street
- Flood 1/10 Low FEMA zone X (unshaded) · 0% chance over 30 yrs
- Wildfire 1/10 Low
- Heat 10/10 Extreme 7 d/yr ≥107°F today · 27 d/yr by 30 yrs out
- Wind 10/10 Extreme 99% chance of damaging wind over 30 yrs
- Air quality 3/10 Moderate 2 unhealthy d/yr today · 3 by 30 yrs out
Nearby sold comps map
Loading sold comps map…
Walkable amenities ~0.75 mi
Loading nearby amenities…
Taxation est. · year 1
- Rental income
- $49,466
- − Mortgage interest
- −$17,309
- − Property taxes
- −$6,333
- − Insurance
- −$1,545
- − Repairs & maintenance
- −$3,957
- − Management
- −$3,957
- − HOA
- −$3,024
- − Depreciation
- −$8,989
- Taxable income
- $4,351
- Est. tax owed @ 24.0%
- −$1,044
- After-tax cash flow
- $7,686/yr
For passive investors: Depreciation is non-cash, so a rental often shows a tax loss while cash-flowing — sheltering income. Rental losses are passive: they offset passive income freely, and up to $25,000/yr can offset ordinary (W-2) income if you actively participate and your MAGI is under $100k (phasing out to $0 by $150k); unused losses carry forward. On sale, claimed depreciation is recaptured at up to 25%, and gains may owe capital-gains tax (a 1031 exchange can defer both). Figures are a year-1 estimate at your 24.0% rate — not tax advice; consult a CPA.
Schools (NCES district)
- District
- Pinellas
- NCES district ID
- 1201560
- Math proficiency
- 51% ▼ -5.00%
- Reading proficiency
- 51% ▼ -3.00%
- Median HH income
- $46,270
- Composite
- 43.27/100
- National rank
- #3046
- State rank
- #31 of 73 in FL
Livability — Seminole
- Score
- 88/100
- State rank
- #5
- US rank
- #174
Category grades
Schools grade is shown separately in the Schools card above.
Census & demographics
- City population
- 42,315
- Population (ZIP)
- 12,711
Population outlook (Pinellas County) Hauer SSP2
- Today (2025)
- 1,027,532 people
- By 2030
- 1,063,586 · +3.5%
- By 2040
- 1,125,020 · +9.5%
- By 2050
- 1,168,637 · +13.7%
- By 2075
- 1,265,188 · +23.1%
- By 2100
- 1,260,357 · +22.7%
Race, ethnicity, and origin ACS 2023
- Neighborhood character
- Predominantly White (84%)
- Race & ethnicity
- White 84% Hispanic / Latino 7% Two or more races 7% Asian 2% Black 2%
- Hispanic origin (detail)
- Mexican 3%
- Common ancestry
- Romanian 7% Lithuanian 3% Slovak 1%
- Foreign-born
- 9% · Canada, Jamaica
- Languages at home
- 89% English-only · Other Indo-European 4% Russian/Polish/Slavic 3% Spanish 2%
Political lean MEDSL · Pinellas
- 2024 margin
- Lean R (+5.2) · D 46.9% · R 52.1%
- 2008→2024 swing
- -13.5pp toward R · 2008: 8.3pp · 2024: -5.2pp
- All cycles
- 2024: R+5.2 2020: D+0.2 2016: R+1.1 2012: D+5.6 2008: D+8.3
Not yet ingested
- Civics
- —
Market trends
- HPI YoY
- ▼ -455.42%
- Current HPI
- 337.3149
- Rent YoY
- —
- Metro
- —
- State GDP YoY
- ▲ 3.28%
- F500 in state
- 36
Industry mix (Fortune 500 HQ in FL)
| Industry | F500 HQs | Revenue |
|---|---|---|
| Industrial Technology | 2 | $29B |
|
||
| Insurance | 2 | $17B |
|
||
| Retail | 1 | $60B |
|
||
| Technology Distribution | 1 | $58B |
|
||
| Homebuilding | 1 | $35B |
|
||
| Technology Manufacturing | 1 | $35B |
|
||
Price history
-15.4% since first listed4 events — show timeline
- 2026-05-22 Price Changed $329,900 Stellar MLS as Distributed by MLS Grid
- 2026-05-09 Price Changed $339,900 Stellar MLS as Distributed by MLS Grid
- 2026-04-08 Price Changed $359,900 Stellar MLS as Distributed by MLS Grid
- 2026-02-13 Listed $389,900 Stellar MLS as Distributed by MLS Grid
Property tax history
+8.2%/yrLatest (2025): $6,333 · +11.2% YoY. Source: county tax records.
Cash-flow waterfall
monthlySold comps — $/sqft
last 12 mo · ≤1 miLoading sold comps…